


 |
市場調查報告書
商品編碼
2100258
網路安全:市場佔有率分析、產業趨勢與統計、成長預測(2026-2031)Network Security - Market Share Analysis, Industry Trends & Statistics, Growth Forecasts (2026 - 2031) |
||||||

※ 本網頁內容可能與最新版本有所差異。詳細情況請與我們聯繫。
根據 Mordor Intelligence 預測,網路安全市場規模將從 2025 年的 249.5 億美元成長到 2026 年的 277.6 億美元,然後在 2031 年達到 473.7 億美元,2026 年至 2031 年的複合年成長率為 11.28%。
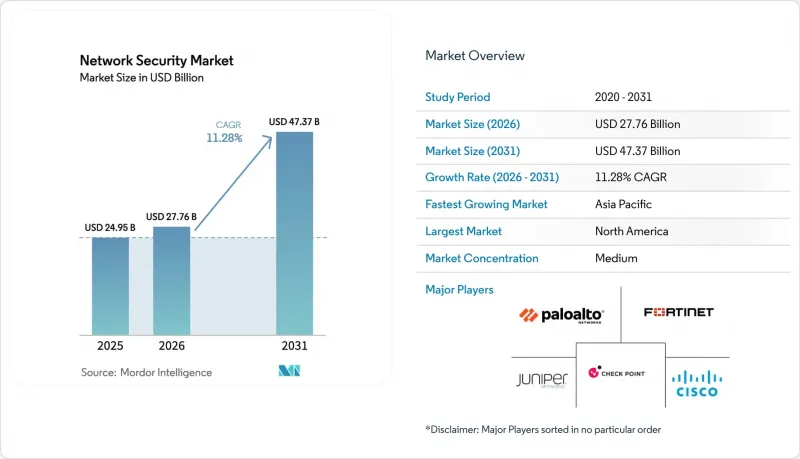
本報告按安全產品和服務(解決方案和服務)、部署類型(雲端、本地部署、混合部署)、企業規模(大型企業、中小企業)、最終用戶產業(IT與電信、銀行、金融服務和保險、政府與國防、醫療保健、製造業及其他)以及地區進行細分。市場預測以美元計價。
全球網路安全市場趨勢與洞察
勒索軟體即服務 (RaaS) 正變得越來越複雜。
勒索軟體即服務 (RaaS) 工具包現在捆綁了偵察和橫向移動工具,迫使企業建立零信任網路架構,以檢查東西向流量並應用即時微隔離。據 CrowdStrike 稱,現代 RaaS 組織的目標是網路漏洞而非終端,這推動了分析工具在識別可疑內部流量方面的應用。 Arctic Wolf 的研究表明,到 2024 年,72% 的勒索軟體入侵成功案例將源自未隔離的網路,這增加了對行為模式的檢測技術的需求,以最大限度地減少損失。經濟影響不僅限於贖金支付;董事會現在正在為彈性投資累計,以確保在攻擊恢復期間的運作。
快速雲遷移擴大了威脅的攻擊面。
由於95%的企業至少使用一種公共雲端,安全措施的激增對傳統的邊界防禦工具構成了挑戰。 Palo Alto Networks的一項調查發現,70%的企業無法在其混合環境中應用統一的規則,這推動了雲端原生防火牆和SASE疊加網路的普及。 Menlo Security指出,65%的資料外洩事件是由雲端配置錯誤造成的,而他們的平台能夠自動偵測風險配置,並為所有工作負載提供統一的糾正措施,從而有效解決了這個問題。正是這些功能使那些能夠提供無基礎設施瓶頸的彈性保護的供應商脫穎而出。
網路安全專業人員短缺
ISC2指出,全球網路安全人才缺口高達480萬人,90%的雇主擔憂人才短缺會直接影響安全品質。 NIST報告稱,美國有超過66.3萬個網路安全相關職缺,推高了網路專家的薪資,迫使企業轉向自動化平台和託管檢測服務。雖然人工智慧驅動的監控工具日益普及,減少了人工調整,但技能短缺仍然限制著複雜零信任項目的部署速度。
細分市場分析
預計到2025年,解決方案將保持網路安全市場55.15%的佔有率,而服務領域預計到2031年將以14.55%的複合年成長率穩步成長。威脅行為者擴大將人工智慧用作攻擊工具,這推動了對外部專業知識的需求,迫使企業將全天候監控和事件回應外包。專業服務顧問公司正在訂單零信任藍圖設計項目,而資安管理服務提供者(MSSP)則在獲得持續營運這些環境的合約。思科透過將Splunk的分析功能整合到其產品組合中,並在該整合技術之上疊加託管服務,使其在2025年第一季的安全相關收入加倍,達到20.2億美元。
供應商的定價模式正從永久授權轉向與風險降低關鍵績效指標 (KPI) 掛鉤的基於績效的訂閱模式,從而確保可預測的年度收入。雖然網路存取控制和 DDoS 防護等基礎工具依然暢銷,但成長最快的解決方案是“零信任網路存取”,它可在雲端和邊緣環境中原生運行。網路安全市場正受益於買家將諮詢、整合和持續管理整合到單一合約中,從而明確預算和責任。
預計到2025年,雲端採用將佔網路安全市場佔有率的52.35%,隨著企業逐步淘汰設備堆疊,預計到2031年將以15.5%的複合年成長率持續成長。在本地、公共雲端和邊緣環境中應用統一的措施需要集中式編配,而不是孤立的防火牆規則。隨著SaaS、PaaS和容器工作負載中嵌入的檢測點的普及,與雲端控制相關的網路安全市場規模預計將在預測期內擴大。
歐洲 NIS2 指令要求關鍵基礎設施營運商實施一致的安全保障和報告機制,而集中式雲端安全控制面板簡化了這項工作。即使是空氣間隙隔離的工業設施現在也開始採用混合模式,資料平面保留在本地,而分析和補丁資訊則從雲端提供。 Palo Alto Networks 雲端安全營收成長 36%,凸顯了市場對虛擬化應用效能的信心,認為其可以達到甚至超越專用硬體的效能水準。
區域分析
預計到2025年,北美將佔網路安全市場收入的35.10%。這得益於嚴格的監管,例如美國證券交易委員會(SEC)的網路安全事件揭露規則,以及成熟的供應商和資安管理服務提供者(MSSP)生態系統。支出主要集中在財富1000強企業,這些企業正在對其架構進行現代化改造,重點關注零信任和可觀測性的整合。該地區也正在採用新的檢測技術,例如基於人工智慧的異常評分和後量子密碼學檢測。
預計到2031年,亞太地區的複合年成長率將達到12.05%,為全球最高。公共雲端的普及、電子商務的擴張以及製造業的數位化,為現代網路安全創造了有利環境。新加坡就是一個典型的例子,該國網路安全支出預計到2026年將達到20億至25億美元,這得益於一項國家戰略,該戰略包括對人才培養的資金投入和針對特定行業的指導方針。當地通訊業者正在提供與5G專用網路捆綁的安全服務,使工廠能夠在不影響安全性的前提下自動化。
在歐洲,安全領域預計將保持穩定成長,這主要得益於NIS2指令的實施。該指令將安全範圍擴大到18個關鍵產業,並對違規行為處以嚴厲的處罰。根據歐盟跨境資料居住和主權的擔憂,推動了對能夠為跨國公司提供統一控制面板並支援區域雲端區域的解決方案的需求。
其他好處
- Excel格式的市場預測(ME)表
- 3個月的分析師支持
目錄
第1章:引言
- 市場定義與研究假設
- 調查範圍
第2章:調查方法
第3章執行摘要
第4章 市場狀況
- 市場概覽
- 市場促進因素
- 勒索軟體即服務 (RaaS) 的生態系統正變得越來越複雜。
- 快速向雲端遷移正在擴大威脅的目標範圍。
- 需要網路分段的物聯網/OT設備的激增
- SASE 的引進正在加速小規模分店安全現代化進程。
- 強制性軟體材料清單(SBOM) 正在提升網路異常偵測能力。
- 電信公司開始為 5G 專用網路提供「SaaS(安全即服務)」套餐。
- 市場限制因素
- 網路安全專業人員短缺
- 對下一代基於ASIC的設備進行大量資本投資
- 在舊設備上進行完整的 TLS 1.3 檢查所帶來的效能權衡
- 供應商 API 鎖定阻礙了最佳組合的實作。
- 產業價值鏈分析
- 重要法規結構的評估
- 對關鍵相關人員的影響評估
- 技術展望
- 波特五力分析
- 宏觀經濟因素對市場的影響
第5章 市場規模與成長預測
- 安全產品和服務
- 解決方案
- 網路防火牆
- 入侵偵測與防禦系統(IDPS)
- 安全網路閘道器
- 統一威脅管理 (UTM)
- 分散式阻斷服務 (DDoS) 防護
- 零信任網路存取(ZTNA)
- 網路存取控制(NAC)
- 其他解決方案
- 服務
- 專業服務
- 資安管理服務
- 解決方案
- 按實現類型
- 雲
- 現場
- 混合
- 按公司規模
- 中小企業
- 大公司
- 按最終用戶行業分類
- IT/通訊
- BFSI
- 政府/國防
- 醫療保健
- 製造業
- 零售與電子商務
- 能源與公共產業
- 其他
- 按地區
- 北美洲
- 美國
- 加拿大
- 墨西哥
- 南美洲
- 巴西
- 阿根廷
- 其他南美國家
- 歐洲
- 德國
- 英國
- 法國
- 義大利
- 西班牙
- 其他歐洲國家
- 亞太地區
- 中國
- 日本
- 印度
- 韓國
- 澳洲和紐西蘭
- 其他亞太國家
- 中東和非洲
- 中東
- 沙烏地阿拉伯
- 阿拉伯聯合大公國
- 土耳其
- 其他中東國家
- 非洲
- 南非
- 奈及利亞
- 埃及
- 其他非洲地區
- 中東
- 北美洲
第6章 競爭情勢
- 市場集中度
- 策略趨勢
- 市佔率分析
- 公司簡介
- Cisco Systems, Inc.
- Palo Alto Networks, Inc.
- Fortinet, Inc.
- Check Point Software Technologies Ltd.
- Juniper Networks, Inc.
- Trend Micro Incorporated
- Cloudflare, Inc.
- Zscaler, Inc.
- Sophos Limited
- Barracuda Networks, Inc.
- WatchGuard Technologies, Inc.
- F5, Inc.
- Arista Networks, Inc.(Awake Security)
- Akamai Technologies, Inc.
- Forcepoint LLC
- Ivanti Software, Inc.(Pulse Secure)
- Dell Technologies Inc.(SonicWall)
- Hewlett Packard Enterprise Development LP(Aruba)
- Broadcom Inc.(Symantec Enterprise)
- Proofpoint, Inc.
- CrowdStrike Holdings, Inc.
- Elastic NV(Endgame)
- Darktrace plc
- Nozomi Networks, Inc.
- Radware Ltd.
第7章 市場機會與未來趨勢
- 對未開發市場和未滿足需求的評估
According to Mordor Intelligence, the network security market size is expected to grow from USD 24.95 billion in 2025 to USD 27.76 billion in 2026 and is forecast to reach USD 47.37 billion by 2031 at 11.28% CAGR over 2026-2031.
This report is Segmented by Security Offering ( Solutions, and Services), Deployment (Cloud, On-Premises, and Hybrid), Enterprise Size (Large Enterprises, and Small and Medium Enterprises), End-User Industry (IT and Telecom, BFSI, Government and Defense, Healthcare, Manufacturing, and More), and Geography. The Market Forecasts are Provided in Terms of Value (USD).
Global Network Security Market Trends and Insights
Escalating sophistication of ransomware-as-a-service
Service-based ransomware kits now bundle reconnaissance and lateral-movement tools, forcing companies to build zero-trust network architectures that inspect east-west traffic and apply real-time micro-segmentation. CrowdStrike reported that modern RaaS groups target network vulnerabilities more than endpoints, prompting purchases of analytics that spotlight suspicious internal flows. Arctic Wolf found that 72% of successful ransomware intrusions in 2024 originated from unsegmented networks, reinforcing the demand for behavior-based detection that minimizes blast radius. The economic fallout extends beyond ransom; boards now budget for resilience investments that maintain uptime even during attack recovery.
Rapid cloud migration expanding threat surface
With 95% of enterprises using at least one public cloud, policy sprawl poses a challenge to traditional perimeter tools. Palo Alto Networks observed that 70% of firms cannot enforce uniform rules across hybrid estates, motivating the adoption of cloud-native firewalls and SASE overlays. Menlo Security attributes 65% of data-exposure incidents to cloud misconfigurations, an issue addressed by platforms that auto-detect risky settings and provide integrated remediation across workloads. These capabilities differentiate vendors able to deliver elastic protection without infrastructure bottlenecks.
Shortage of skilled cyber-security professionals
ISC2 cites a 4.8 million-person global talent gap, with 90% of employers anticipating staff shortfalls that directly affect protection quality. NIST lists over 663,000 unfilled US cyber roles, inflating salaries for network specialists and pushing companies toward automated platforms and managed detection services. AI-driven monitoring tools that reduce manual tuning gain traction, yet the skill deficit continues to limit rollout speed of complex zero-trust projects
Other drivers and restraints analyzed in the detailed report include:
- Proliferation of IoT/OT devices requiring network segmentation
- Adoption of SASE driving thin-branch refreshes
- High capex for next-gen ASIC-based appliances
For complete list of drivers and restraints, kindly check the Table Of Contents.
Segment Analysis
Solutions retained 55.15% share of the network security market in 2025, but Services are poised for a brisk 14.55% CAGR to 2031. Demand for external expertise arises because threat actors now weaponize AI, forcing enterprises to outsource 24/7 monitoring and incident response. Professional services consultancies win projects designing zero-trust blueprints, while managed security service providers (MSSPs) secure recurring contracts to operate those environments. Cisco doubled security revenue to USD 2.02 billion in Q1 2025 after folding Splunk analytics into its portfolio and layering managed offerings atop the combined stack.
Vendor pricing models are shifting from perpetual licenses to outcome-based subscriptions tied to risk-reduction KPIs, locking in predictable annuities. Baseline tools such as network access control and DDoS protection continue to sell steadily, yet the fastest-rising solution is Zero Trust Network Access, which operates natively in cloud and edge contexts. The network security market benefits as buyers bundle consulting, integration, and ongoing management into a single contract that simplifies budgeting and accountability.
Cloud deployments commanded 52.35% of the network security market share in 2025 and are expected to compound at 15.5% annual growth rate through 2031, as enterprises retire their appliance stacks. Uniform policy enforcement across on-prem, public cloud, and edge requires centralized orchestration rather than siloed firewall rules. The network security market size for cloud controls is projected to expand during the forecast period, reflecting the adoption of inspection points embedded in SaaS, PaaS, and container workloads.
Europe's NIS2 Directive obligates critical infrastructure operators to demonstrate consistent protection and reporting, a task simplified by centrally managed cloud security dashboards. Even air-gapped industrial sites now employ hybrid models, where analytics and patch intelligence are delivered from the cloud, while data planes remain on-site. Palo Alto Networks' 36% jump in cloud security revenue underscores market confidence that virtualized enforcement can equal or surpass the performance of bespoke hardware.
Complete Report Scope:
- By Security Offering
- Solutions
- Network Firewall
- Intrusion Detection and Prevention Systems (IDPS)
- Secure Web Gateway
- Unified Threat Management (UTM)
- Distributed Denial-of-Service (DDoS) Protection
- Zero Trust Network Access (ZTNA)
- Network Access Control (NAC)
- Other Solutions
- Services
- Professional Services
- Managed Security Services
- Solutions
- By Deployment Mode
- Cloud
- On-Premises
- Hybrid
- By Enterprise Size
- Small and Medium Enterprises (SMEs)
- Large Enterprises
- By End-user Industry
- IT and Telecom
- BFSI
- Government and Defense
- Healthcare
- Manufacturing
- Retail and E-commerce
- Energy and Utilities
- Other End-user Industries
- By Geography
- North America
- United States
- Canada
- Mexico
- South America
- Brazil
- Argentina
- Rest of South America
- Europe
- Germany
- United Kingdom
- France
- Italy
- Spain
- Rest of Europe
- Asia-Pacific
- China
- Japan
- India
- South Korea
- Australia and New Zealand
- Rest of Asia-Pacific
- Middle East and Africa
- Middle East
- Saudi Arabia
- UAE
- Turkey
- Rest of Middle East
- Africa
- South Africa
- Nigeria
- Egypt
- Rest of Africa
- Middle East
- North America
Geography Analysis
North America generated 35.10% of network security market revenue in 2025, underpinned by stringent mandates such as the SEC's cyber-incident disclosure rule and a mature ecosystem of vendors and MSSPs. Spending is concentrated among Fortune 1000 enterprises that are refreshing their architectures around zero-trust and observability convergence. The region also pilots emerging technologies, including AI-based anomaly scoring and post-quantum cryptography inspection.
The Asia-Pacific region is expected to register a 12.05% CAGR through 2031, the fastest growth rate worldwide. The public cloud's uptake, e-commerce expansion, and manufacturing digitalization create fertile ground for modern defenses. Singapore demonstrates the pattern; its cybersecurity outlays are projected to reach USD 2 billion to USD 2.5 billion by 2026, buoyed by a national strategy that funds workforce development and sector-specific guidelines. Local telcos bundle security with 5G private networks, enabling factories to adopt automation without compromising safety.
Europe delivers steady growth anchored by the NIS2 Directive, which broadens coverage to 18 critical sectors and imposes stiff fines for non-compliance. ENISA states security budgets now account for 9% of total IT expenditures, with median spending per organization doubling compared with 2023. Cross-border data residency and sovereignty concerns boost demand for solutions that support regional cloud zones while offering harmonized dashboards for multinationals.
- Cisco Systems, Inc.
- Palo Alto Networks, Inc.
- Fortinet, Inc.
- Check Point Software Technologies Ltd.
- Juniper Networks, Inc.
- Trend Micro Incorporated
- Cloudflare, Inc.
- Zscaler, Inc.
- Sophos Limited
- Barracuda Networks, Inc.
- WatchGuard Technologies, Inc.
- F5, Inc.
- Arista Networks, Inc. (Awake Security)
- Akamai Technologies, Inc.
- Forcepoint LLC
- Ivanti Software, Inc. (Pulse Secure)
- Dell Technologies Inc. (SonicWall)
- Hewlett Packard Enterprise Development LP (Aruba)
- Broadcom Inc. (Symantec Enterprise)
- Proofpoint, Inc.
- CrowdStrike Holdings, Inc.
- Elastic N.V. (Endgame)
- Darktrace plc
- Nozomi Networks, Inc.
- Radware Ltd.
Additional Benefits:
- The market estimate (ME) sheet in Excel format
- 3 months of analyst support
TABLE OF CONTENTS
1 INTRODUCTION
- 1.1 Market Definition and Study Assumptions
- 1.2 Scope of the Study
2 RESEARCH METHODOLOGY
3 EXECUTIVE SUMMARY
4 MARKET LANDSCAPE
- 4.1 Market Overview
- 4.2 Market Drivers
- 4.2.1 Escalating sophistication of ransomware-as-a-service (RaaS) eco-system
- 4.2.2 Rapid cloud migration expanding threat surface
- 4.2.3 Proliferation of IoT/OT devices requiring network segmentation
- 4.2.4 Adoption of SASE driving thin-branch security refreshes
- 4.2.5 Mandatory software bill-of-materials (SBOM) rules pushing network anomaly detection
- 4.2.6 Telcos launching security-as-a-service bundles for 5G private networks
- 4.3 Market Restraints
- 4.3.1 Shortage of skilled cyber-security professionals
- 4.3.2 High capex for next-gen ASIC-based appliances
- 4.3.3 Performance trade-offs of full TLS 1.3 inspection on legacy gear
- 4.3.4 Vendor API lock-in impeding best-of-breed strategy adoption
- 4.4 Industry Value Chain Analysis
- 4.5 Evaluation of Critical Regulatory Framework
- 4.6 Impact Assessment of Key Stakeholders
- 4.7 Technological Outlook
- 4.8 Porter's Five Forces Analysis
- 4.8.1 Bargaining Power of Suppliers
- 4.8.2 Bargaining Power of Consumers
- 4.8.3 Threat of New Entrants
- 4.8.4 Threat of Substitutes
- 4.8.5 Intensity of Competitive Rivalry
- 4.9 Impact of Macroeconomic Factors on the Market
5 MARKET SIZE AND GROWTH FORECASTS (VALUE)
- 5.1 By Security Offering
- 5.1.1 Solutions
- 5.1.1.1 Network Firewall
- 5.1.1.2 Intrusion Detection and Prevention Systems (IDPS)
- 5.1.1.3 Secure Web Gateway
- 5.1.1.4 Unified Threat Management (UTM)
- 5.1.1.5 Distributed Denial-of-Service (DDoS) Protection
- 5.1.1.6 Zero Trust Network Access (ZTNA)
- 5.1.1.7 Network Access Control (NAC)
- 5.1.1.8 Other Solutions
- 5.1.2 Services
- 5.1.2.1 Professional Services
- 5.1.2.2 Managed Security Services
- 5.1.1 Solutions
- 5.2 By Deployment Mode
- 5.2.1 Cloud
- 5.2.2 On-Premises
- 5.2.3 Hybrid
- 5.3 By Enterprise Size
- 5.3.1 Small and Medium Enterprises (SMEs)
- 5.3.2 Large Enterprises
- 5.4 By End-user Industry
- 5.4.1 IT and Telecom
- 5.4.2 BFSI
- 5.4.3 Government and Defense
- 5.4.4 Healthcare
- 5.4.5 Manufacturing
- 5.4.6 Retail and E-commerce
- 5.4.7 Energy and Utilities
- 5.4.8 Other End-user Industries
- 5.5 By Geography
- 5.5.1 North America
- 5.5.1.1 United States
- 5.5.1.2 Canada
- 5.5.1.3 Mexico
- 5.5.2 South America
- 5.5.2.1 Brazil
- 5.5.2.2 Argentina
- 5.5.2.3 Rest of South America
- 5.5.3 Europe
- 5.5.3.1 Germany
- 5.5.3.2 United Kingdom
- 5.5.3.3 France
- 5.5.3.4 Italy
- 5.5.3.5 Spain
- 5.5.3.6 Rest of Europe
- 5.5.4 Asia-Pacific
- 5.5.4.1 China
- 5.5.4.2 Japan
- 5.5.4.3 India
- 5.5.4.4 South Korea
- 5.5.4.5 Australia and New Zealand
- 5.5.4.6 Rest of Asia-Pacific
- 5.5.5 Middle East and Africa
- 5.5.5.1 Middle East
- 5.5.5.1.1 Saudi Arabia
- 5.5.5.1.2 UAE
- 5.5.5.1.3 Turkey
- 5.5.5.1.4 Rest of Middle East
- 5.5.5.2 Africa
- 5.5.5.2.1 South Africa
- 5.5.5.2.2 Nigeria
- 5.5.5.2.3 Egypt
- 5.5.5.2.4 Rest of Africa
- 5.5.5.1 Middle East
- 5.5.1 North America
6 COMPETITIVE LANDSCAPE
- 6.1 Market Concentration
- 6.2 Strategic Moves
- 6.3 Market Share Analysis
- 6.4 Company Profiles (includes Global level Overview, Market level overview, Core Segments, Financials as available, Strategic Information, Market Rank/Share for key companies, Products and Services, and Recent Developments)
- 6.4.1 Cisco Systems, Inc.
- 6.4.2 Palo Alto Networks, Inc.
- 6.4.3 Fortinet, Inc.
- 6.4.4 Check Point Software Technologies Ltd.
- 6.4.5 Juniper Networks, Inc.
- 6.4.6 Trend Micro Incorporated
- 6.4.7 Cloudflare, Inc.
- 6.4.8 Zscaler, Inc.
- 6.4.9 Sophos Limited
- 6.4.10 Barracuda Networks, Inc.
- 6.4.11 WatchGuard Technologies, Inc.
- 6.4.12 F5, Inc.
- 6.4.13 Arista Networks, Inc. (Awake Security)
- 6.4.14 Akamai Technologies, Inc.
- 6.4.15 Forcepoint LLC
- 6.4.16 Ivanti Software, Inc. (Pulse Secure)
- 6.4.17 Dell Technologies Inc. (SonicWall)
- 6.4.18 Hewlett Packard Enterprise Development LP (Aruba)
- 6.4.19 Broadcom Inc. (Symantec Enterprise)
- 6.4.20 Proofpoint, Inc.
- 6.4.21 CrowdStrike Holdings, Inc.
- 6.4.22 Elastic N.V. (Endgame)
- 6.4.23 Darktrace plc
- 6.4.24 Nozomi Networks, Inc.
- 6.4.25 Radware Ltd.
7 MARKET OPPORTUNITIES AND FUTURE TRENDS
- 7.1 White-space and Unmet-need Assessment

 網路安全市場預測至2034年—按組件、部署模式、組織規模、應用、最終用戶和地區分類的全球分析
 網路安全市場分析及預測(至2035年):按類型、產品類型、服務、技術、組件、應用、部署類型、最終用戶和解決方案分類
 網路安全市場規模、佔有率、成長率及全球產業分析:按類型、應用和地區分類的洞察,2026-2034 年預測
 網路安全市場規模、佔有率、趨勢和預測(按組件、部署類型、組織規模、垂直行業和地區分類),2026-2034 年
 網路安全市場 - 全球產業規模、佔有率、趨勢、競爭格局、機會及預測(按公司規模、部署類型、產業垂直領域、地區和競爭格局分類,2021-2031 年)網路安全市場-2026-2031年預測日本網路安全市場報告:按組件、部署類型、組織規模、產業和地區分類(2026-2034 年)
 網路安全市場規模、佔有率和成長分析(按組件、部署方式、公司規模、行業垂直領域和地區分類)—產業預測,2026-2033年
 全球網路安全市場(至 2030 年)依解決方案(防火牆/新一代防火牆、安全 Web 閘道、統一威脅管理、網路偵測與回應、網路存取控制)及網路環境(分公司、園區、資料中心)分類
 網路安全市場規模、佔有率、趨勢分析報告:按組件、部署、公司規模、行業垂直、地區、細分預測,2025 年至 2033 年