


 |
市場調查報告書
商品編碼
2099969
行動威脅防禦 (MTD) 軟體:市場佔有率分析、產業趨勢和統計數據以及成長預測 (2026-2031)Mobile Threat Defense (MTD) Software - Market Share Analysis, Industry Trends & Statistics, Growth Forecasts (2026 - 2031) |
||||||

※ 本網頁內容可能與最新版本有所差異。詳細情況請與我們聯繫。
根據 Mordor Intelligence 預測,行動威脅防禦 (MTD) 軟體市場規模預計將在 2025 年達到 29.3 億美元,到 2031 年達到 90.6 億美元,2026 年至 2031 年的複合年成長率為 21.37%。
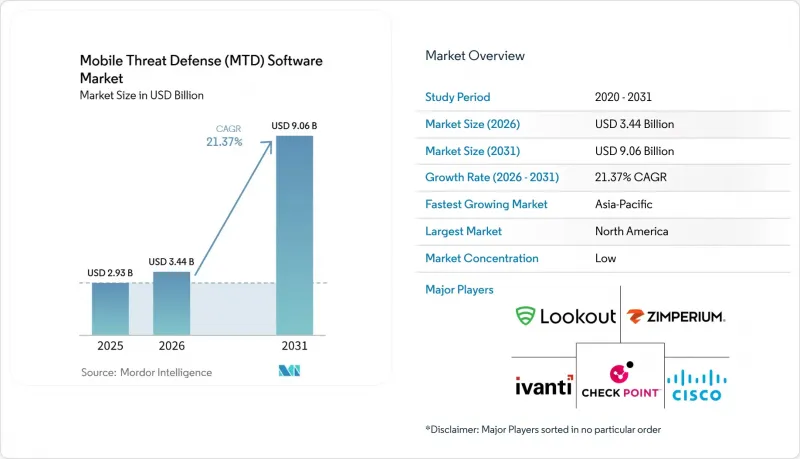
本報告按解決方案(軟體和服務)、部署類型(雲端、混合、本地部署)、作業系統(Android、iOS、Windows 及其他)、企業規模(大型企業和中小企業)、最終用戶(IT 和電信、銀行、金融服務和保險 (BFSI) 及其他)以及地區進行細分。市場預測以美元 (USD) 為單位。
全球行動威脅防禦 (MTD) 軟體市場趨勢與洞察
企業設備中「行動優先」的攻擊面不斷擴大
目前,企業行動裝置已成為攻擊鏈中最有可能的起點之一,這項轉變正在推動整個行動威脅防禦 (MTD) 軟體市場的需求成長。 Digital.ai 的研究顯示,到 2025 年 1 月,在受監控的 Android 應用中,90.4% 的攻擊被檢測到;在 iOS 應用中,這一比例也達到了 88.1%,較 2024 年 2 月報告的跨平台總體水平顯著上升。許多企業歷來將行動相關支出集中於設備管理而非威脅檢測,導致控制與風險暴露之間存在明顯的差距。這種差距使得以往的行動投資顯得不夠完善,因為僅靠管理工具無法消除網路釣魚、惡意內容和裝置級攻擊風險。 Lookout 報告稱,到 2025 年第三季度,企業釣魚網站數量將超過 120 萬個,這表明行動裝置已成為攻擊者可靠的入口點。這也解釋了為什麼採購決策的速度正在加快,並且比以往任何時候都更早進入了高階主管審核階段。
BYOD 和 COPE 的日益普及導致了未管理終端數量的增加。
自帶設備辦公室 (BYOD) 正從一種特殊現象轉變為一種常見的職場實踐,從而擴大了行動威脅防禦 (MTD) 軟體市場的潛在基本客群。 Verizon 的一項調查顯示,雖然四分之三的 IT負責人認為 BYOD 已成為日常現象,但只有 52% 的企業明確允許這種做法,而即使在被禁止的情況下,也只有 22% 的員工能夠完全遵守。這種差異常常導致企業憑證和商用應用程式儲存在沒有專用行動威脅防護層的個人裝置上。美國國家標準與技術研究院 (NIST) 關於 BYOD 的指南明確指出,為公司所有設備設計的控制措施無法完全涵蓋員工自有終端特有的風險。因此,僅完成行動裝置管理 (MDM) 的註冊已不再是行動安全防護的可靠指標,這促使買家更加關注那些在 MDM 註冊範圍之外運行的部署模式。
在自帶裝置辦公室 (BYOD) 主導的環境下,隱私問題引發強烈反彈。
在自備設備辦公 (BYOD) 環境中,員工隱私問題仍然是一個不容忽視的難題,尤其是在資料保護法規限制雇主對個人裝置存取權限的情況下。 Verizon 的一項調查發現,29% 的安全專業人員認為 BYOD 本身會增加風險,而員工仍在個人裝置上使用各種變通方法,這需要在風險管理和使用者接受度之間找到微妙的平衡。問題的根源在於,行動威脅主體可以收集行為資料、應用程式活動、網路資訊或位置相關訊號,而員工可能會將這些資訊解讀為監視。在歐洲部分地區,雇主委員會和當地的隱私保護要求已經促使一些部署轉向“企業容器”,而不是全面的設備監控,即使企業希望獲得更強大的保護,這種做法也會降低可見度。這種矛盾可能會減緩部署擴展速度,延長內部核准流程,並導致個人設備環境中的覆蓋水準低於安全團隊的預期。
細分市場分析
在2025年的行動威脅防禦(MTD)軟體市場中,軟體佔了68.41%的市場。這表明許多買家仍然傾向於選擇自行管理的工具,而不是外包的疊加層。在行動威脅防禦(MTD)軟體市場,這一趨勢反映了那些已經建立保全行動營運系統並希望自行控制策略、連接器和遙測處理的組織的需求。這些買家傾向於選擇軟體,因為軟體可以更直接地調整偵測規則,並與現有的端點和身分識別管理工作流程更緊密地整合。這一趨勢在大型企業中尤其明顯,在這些企業中,行動安全已被視為保全行動的正式組成部分,而不僅僅是一項行動功能。
預計2026年至2031年間,服務業將以24.83%的複合年成長率成長,成為行動威脅防禦(MTD)軟體市場中成長最快的解決方案細分領域。這一成長主要源於明顯的技能缺口:許多中型企業團隊仍然缺乏能夠將行動警報與身分事件、應用程式風險和使用者行為關聯起來的分析師。 Zimperium報告稱,針對行動裝置的網路釣魚攻擊約佔已識別威脅的三分之一,這進一步加重了缺乏行動專業知識的小規模安全團隊的負擔。託管交付模式透過全天候監控、預先建立的回應手冊以及與更廣泛的保全行動的簡化整合,彌合了這一差距。這使得該服務對於員工人數少於1000人的組織尤為重要,這些組織希望獲得可靠的行動保護,而無需從頭開始建立專門的內部系統。
在2025年的行動威脅防禦(MTD)軟體市場中,雲端部署佔比高達74.18%,這證實了集中式交付仍然是大多數買家的標準模式。雲端部署之所以在行動威脅防禦(MTD)軟體市場中保持吸引力,是因為它易於擴充性、降低了基礎設施負擔,並且供應商能夠持續更新簽章和模型。雲端部署還支援威脅情報共用,使供應商能夠比單一公司更快地識別客戶環境中的新興攻擊模式。這些優勢使得雲端部署成為那些尋求速度、降低部署負擔和獲得廣泛的跨客戶可見性的組織的理想選擇。
混合部署預計將在2026年至2031年間以23.69%的複合年成長率成長,反映出行動威脅防禦(MTD)軟體市場對數據居住日益成長的關注。醫療保健、金融服務和政府機構的買家越來越需要像雲端一樣快速的分析,同時也要嚴格控制敏感遙測資料的儲存位置。美國國家標準與技術研究院(NIST)的指南指出,行動安全架構的選擇應與設備上存取的資料的敏感度相匹配,這促使在受監管的環境中採取更具選擇性的部署方法。因此,雖然本地部署在空氣間隙和敏感環境中仍然很重要,但其目標使用者僅限於需要更高隔離等級的特定使用者群體。混合模式介於兩者之間,它將集中式檢測邏輯與對遙測和策略處理的更本地化控制相結合。
區域分析
2025年,北美繼續保持領先地位,佔據行動威脅防禦(MTD)軟體市場36.42%的佔有率。這一地位反映了企業行動裝置的高使用率、成熟的安全支出以及眾多主要供應商湧入行動威脅防禦(MTD)軟體市場。政府政策也是關鍵因素,公共部門設備移動威脅防禦和應用審查的正式要求推動了相關監管行業的企業採購決策。加拿大和墨西哥也促進了區域需求,尤其是加拿大金融機構,它們對監管機構日益重視的行動安全措施做出了更迅速的回應。
預計亞太地區在2026年至2031年間將以26.81%的複合年成長率成長,成為行動威脅防禦(MTD)軟體市場成長最快的地區。在亞太地區的許多國家,企業運算模式正變得更加“行動優先”,智慧型手機在業務數據和用戶活動中的佔比通常高於以PC為中心的環境。 Zimperium報告稱,到2025年,該地區針對行動金融應用程式的銀行木馬活動年增67%,推動了銀行和數位支付領域的加速普及。該公司還表示,在一個會計年度內,其與亞太地區的12家金融機構簽署了契約,這切實徵兆了該地區強勁的採購勢頭。由於中國獨特的競爭環境,其市場格局與其他地區有所不同。中國的市場格局與國際供應商市場並不完全一致,受到當地合規體系和國內供應商定位的影響。
2025年,歐洲在區域排名中排名第二,其中德國、英國和法國是行動威脅防禦(MTD)軟體市場的關鍵支柱市場。 NIS2涵蓋的組織數量的顯著成長,進一步提升了行動終端控制對那些在更嚴格的網路安全義務下運作的組織的實際重要性。德國的安全框架強調操作系統加固之外的保護,而法國則授予Pradeo的套件CSPN認證,這為受監管的買家創造了顯著的本地合規優勢。南美、中東和非洲的行動威脅防禦(MTD)軟體市場仍處於起步階段,但隨著行動銀行詐騙的日益猖獗和數位政府的普及,巴西的金融業和海灣國家的政府計畫正逐漸成為明顯的市場需求中心。
其他好處:
- Excel格式的市場預測(ME)表
- 3個月的分析師支持
目錄
第1章:引言
- 研究假設和市場定義
- 調查範圍
第2章:調查方法
第3章執行摘要
第4章 市場狀況
- 市場概覽
- 市場促進因素
- 「行動優先」策略擴大了企業所有設備的攻擊面。
- BYOD 和 COPE 的日益普及導致了未管理終端數量的增加。
- 由於人工智慧驅動的簡訊釣魚和QR碼釣魚,行動裝置遭受入侵的風險正在增加。
- 零信任機制的引入意味著行動裝置將受到統一策略管理。
- 5G 和 SASE 的融合增加了對行動專用遙測技術的需求。
- 受監管產業對合規主導行動資料外洩防護的需求
- 市場限制因素
- 在以自帶裝置辦公室 (BYOD) 為主導的部署環境中,隱私問題日益凸顯。
- 由於與 MDM、UEM 和 EDR 的預算重疊,獨立採購正在放緩。
- 對消費性設備安全遙測的限制
- 與傳統身分管理系統和移動車輛管理工具整合的挑戰
- 宏觀經濟因素對市場的影響
- 產業價值鏈分析
- 科技趨勢
- 監理情勢
- 波特五力分析
第5章 市場規模與成長預測
- 透過解決方案
- 軟體
- 服務
- 不同的發展
- 基於雲端的
- 混合
- 現場
- 透過作業系統
- Android
- iOS
- Windows
- 其他
- 按公司規模
- 大公司
- 小型企業
- 按最終用戶行業分類
- 資訊科技/通訊
- BFSI
- 醫療保健和生命科學
- 零售與電子商務
- 工業製造
- 教育和研究機構
- 媒體與娛樂
- 政府/行政部門
- 能源公用事業
- 其他終端用戶產業
- 按地區
- 北美洲
- 美國
- 加拿大
- 墨西哥
- 南美洲
- 巴西
- 阿根廷
- 其他南美國家
- 歐洲
- 德國
- 英國
- 法國
- 俄羅斯
- 西班牙
- 其他歐洲國家
- 亞太地區
- 中國
- 日本
- 印度
- 韓國
- 東南亞
- 其他亞太國家
- 中東和非洲
- 中東
- 沙烏地阿拉伯
- 阿拉伯聯合大公國
- 土耳其
- 其他中東國家
- 非洲
- 南非
- 奈及利亞
- 埃及
- 其他非洲國家
- 中東
- 北美洲
第6章 競爭情勢
- 市場集中度
- 策略趨勢
- 市佔率分析
- 公司簡介
- Lookout, Inc.
- Zimperium, Inc.
- Check Point Software Technologies Ltd.
- Cisco Systems, Inc.
- Broadcom Inc.
- IBM Corporation
- Palo Alto Networks, Inc.
- Jamf Holding Corp.
- Ivanti, Inc.
- Trend Micro Incorporated
- Sophos Limited
- BlackBerry Limited
- Microsoft Corporation
- VMware, Inc.
- OPSWAT, Inc.
- Pradeo Security Systems SAS
- Guardsquare NV
- Matrix42 AG
- Esper.io Inc.
- F-Secure Oyj
第7章 市場機會與未來展望
According to Mordor Intelligence, the mobile threat defense (MTD) software market size stood at USD 2.93 billion in 2025 and is projected to reach USD 9.06 billion by 2031, expanding at a CAGR of 21.37% during 2026-2031.
This report is Segmented by Solution (Software and Services), Deployment (Cloud-Based, Hybrid, and On-Premises), Operating System (Android, IOS, Windows, and Others), Enterprise Size (Large Enterprises and Small and Medium Enterprises), End User (IT and Telecommunication, BFSI, and More), and Geography. The Market Forecasts are Provided in Terms of Value (USD).
Global Mobile Threat Defense (MTD) Software Market Trends and Insights
Rising Mobile-First Attack Surface Across Enterprise Devices
Enterprise mobile devices now sit at a point where they are one of the most likely starting points in an attack chain, and that shift is strengthening demand across the Mobile Threat Defense (MTD) Software Market. Digital.ai recorded attacks on 90.4% of monitored Android apps and 88.1% of monitored iOS apps in January 2025, which marked a sharp rise from the cross-platform level reported in February 2024. Many organizations had previously aligned mobile spending with device management rather than with threat detection, leaving a clear gap between control and exposure. That gap has made earlier mobility investments look incomplete because management tools do not remove phishing, malicious content, or device-level attack risk on their own. Lookout reported more than 1.2 million enterprise phishing sites in Q3 2025 and described mobile as a reliable entry point for attackers, which helps explain why buying decisions are now moving faster and reaching senior leadership review much earlier.
BYOD and COPE Adoption Expanding Unmanaged Endpoints
Bring-your-own-device use has moved from an exception to a regular workplace practice, widening the accessible base for the Mobile Threat Defense (MTD) Software Market. Verizon found that 3 in 4 IT workers saw BYOD as a regular occurrence, yet only 52% of organizations explicitly permitted it, and only 22% of employees fully complied where it was prohibited. That mismatch means corporate credentials and business applications are often present on personal devices without a dedicated mobile threat layer. NIST guidance on BYOD makes clear that controls designed for corporate devices do not fully address the distinct risks associated with employee-owned endpoints. As a result, buyers are paying more attention to deployment models that can work outside full mobile device management enrollment, because enrollment coverage alone no longer serves as a dependable proxy for mobile protection.
Privacy Pushback in BYOD-Heavy Deployments
Employee privacy concerns remain a real obstacle in BYOD settings, especially when data protection rules limit the visibility employers can demand into personal devices. Verizon found that 29% of security professionals viewed BYOD itself as a heightened risk, yet employee workarounds on personal devices persisted, creating a difficult balance between risk control and user acceptance. The core issue is that mobile threat agents may collect behavior data, app activity, network information, or location-linked signals that employees can interpret as surveillance. In parts of Europe, employer councils and local privacy expectations have already pushed some deployments toward corporate containers rather than full-device monitoring, reducing visibility even when companies want stronger protection. This tension can slow rollout scope, prolong internal approvals, and keep coverage below what security teams would prefer in personal-device environments.
Other drivers and restraints analyzed in the detailed report include:
- AI-Enhanced Smishing and QR Phishing Increasing Mobile Intrusion Risk
- Zero-Trust Rollouts Pulling Mobile Devices into Unified Policy Control
- Overlap With MDM, UEM, and EDR Budgets Slowing Standalone Purchases
For complete list of drivers and restraints, kindly check the Table Of Contents.
Segment Analysis
Software commanded 68.41% of the Mobile Threat Defense (MTD) Software market share in 2025, which showed that many buyers still preferred directly managed tools over outsourced overlays. In the Mobile Threat Defense (MTD) Software Market, that preference reflected the needs of organizations that already had security operations capacity and wanted control over policies, connectors, and telemetry handling. These buyers often favored software because it allowed more direct tuning of detection rules and tighter alignment with established endpoint and identity workflows. The pattern was strongest in larger enterprises, where mobile security had already moved into formal security operations rather than remaining a simple mobility function.
Services are projected to expand at a 24.83% CAGR during 2026-2031, making it the fastest-growing solution segment in the Mobile Threat Defense (MTD) Software Market. That growth stemmed from a clear skills gap: many mid-market teams still lacked analysts who could connect mobile alerts to identity events, application risk, and user behavior. Zimperium reported that mobile-targeted phishing accounted for roughly one-third of identified threats, reinforcing the burden on smaller security teams without dedicated mobile expertise. Managed delivery models answered that gap with round-the-clock monitoring, built response playbooks, and simpler integration into wider security operations. This made services especially relevant for organizations below 1,000 seats that wanted credible mobile coverage without building a specialized internal practice from the ground up
Cloud-based deployment accounted for 74.18% of the Mobile Threat Defense (MTD) Software market in 2025, confirming that centralized delivery remained the default model for most buyers. In the Mobile Threat Defense (MTD) Software Market, cloud delivery remained attractive because it scaled easily, reduced infrastructure burden, and enabled vendors to continuously update signatures and models. It also supported pooled threat intelligence, which helped suppliers identify emerging attack patterns across customer environments faster than a single enterprise usually could on its own. These strengths kept cloud deployment well aligned with organizations that wanted speed, lighter deployment effort, and broad cross-customer visibility.
Hybrid deployment is expected to grow at a 23.69% CAGR during 2026-2031, reflecting rising data residency concerns in the Mobile Threat Defense (MTD) Software Market. Healthcare, financial services, and government buyers increasingly wanted cloud-speed analytics while still retaining tighter control over where sensitive telemetry was stored. NIST guidance tied mobile security architecture choices to the sensitivity of the data accessed on those devices, which supported a more selective deployment approach in regulated settings. On-premises deployment, therefore, remained relevant for air-gapped or classified environments, but it served a narrower group of users with stronger isolation needs. Hybrid models sit in the middle by combining centralized detection logic with more local control over telemetry and policy handling.
Complete Report Scope:
- By Solution
- Software
- Services
- By Deployment
- Cloud-Based
- Hybrid
- On-Premises
- By Operating System
- Android
- iOS
- Windows
- Others
- By Enterprise Size
- Large Enterprises
- Small and Medium Enterprises
- By End-User Industry
- IT and Telecommunication
- BFSI
- Healthcare and Life Sciences
- Retail and E-Commerce
- Industrial Manufacturing
- Education and Research Institutions
- Media and Entertainment
- Government and administration
- Energy and Utilities
- Other End-User Industries
- By Geography
- North America
- United States
- Canada
- Mexico
- South America
- Brazil
- Argentina
- Rest of South America
- Europe
- Germany
- United Kingdom
- France
- Russia
- Spain
- Rest of Europe
- Asia-Pacific
- China
- Japan
- India
- South Korea
- Southeast Asia
- Rest of Asia-Pacific
- Middle East and Africa
- Middle East
- Saudi Arabia
- United Arab Emirates
- Turkey
- Rest of Middle East
- Africa
- South Africa
- Nigeria
- Egypt
- Rest of Africa
- Middle East
- North America
Geography Analysis
North America held 36.42% of the Mobile Threat Defense (MTD) Software market in 2025, maintaining its lead. That position reflected dense enterprise mobile usage, mature security spending, and the presence of many major vendors serving the Mobile Threat Defense (MTD) Software Market. Government direction also mattered, as formal expectations around mobile threat defense and app vetting on public-sector devices helped drive enterprise buying decisions across adjacent regulated sectors. Canada and Mexico added to regional demand, with Canadian financial institutions moving more quickly after updated supervisory attention to mobile security controls.
Asia-Pacific is projected to expand at a 26.81% CAGR during 2026-2031, making it the fastest-growing region in the Mobile Threat Defense (MTD) Software Market. The region's enterprise computing model is more mobile-first in many countries, so smartphones often carry a larger share of business data and user activity than in more PC-centric environments. Zimperium reported a 67% year-over-year increase in banking trojan activity targeting mobile financial applications in the region during 2025, which supported faster adoption in banking and digital payments. The company also stated that it signed 12 banking institutions in Asia-Pacific in one fiscal year, which gave a practical signal of regional buying momentum. China remained more distinct because local compliance structures and domestic supplier positioning created a parallel competitive path that did not fully mirror the international vendor field.
Europe held the second-largest regional position in 2025, with Germany, the United Kingdom, and France serving as the main anchor markets in the Mobile Threat Defense (MTD) Software Market. NIS2 sharply widened the number of covered organizations, thereby expanding the practical relevance of mobile endpoint controls for entities now operating under stricter cyber obligations. Germany's security framework emphasized protection beyond operating system hardening, while France granted Pradeo's suite CSPN certification, creating a meaningful local compliance advantage for regulated buyers. South America, the Middle East, and Africa remained earlier-stage parts of the Mobile Threat Defense (MTD) Software Market, but Brazil's financial sector and Gulf government programs were becoming clearer demand centers as mobile banking fraud and digital government use both increased.
- Lookout, Inc.
- Zimperium, Inc.
- Check Point Software Technologies Ltd.
- Cisco Systems, Inc.
- Broadcom Inc.
- IBM Corporation
- Palo Alto Networks, Inc.
- Jamf Holding Corp.
- Ivanti, Inc.
- Trend Micro Incorporated
- Sophos Limited
- BlackBerry Limited
- Microsoft Corporation
- VMware, Inc.
- OPSWAT, Inc.
- Pradeo Security Systems SAS
- Guardsquare NV
- Matrix42 AG
- Esper.io Inc.
- F-Secure Oyj
Additional Benefits:
- The market estimate (ME) sheet in Excel format
- 3 months of analyst support
TABLE OF CONTENTS
1 INTRODUCTION
- 1.1 Study Assumptions and Market Definition
- 1.2 Scope of the Study
2 RESEARCH METHODOLOGY
3 EXECUTIVE SUMMARY
4 MARKET LANDSCAPE
- 4.1 Market Overview
- 4.2 Market Drivers
- 4.2.1 Rising Mobile-First Attack Surface Across Enterprise Devices
- 4.2.2 BYOD and COPE Adoption Expanding Unmanaged Endpoints
- 4.2.3 AI-Enhanced Smishing and QR Phishing Increasing Mobile Intrusion Risk
- 4.2.4 Zero-Trust Rollouts Pulling Mobile Devices Into Unified Policy Control
- 4.2.5 5G and SASE Convergence Increasing Demand for Mobile-Specific Telemetry
- 4.2.6 Compliance-Driven Need for Mobile Data Loss Prevention in Regulated Verticals
- 4.3 Market Restraints
- 4.3.1 Privacy Pushback in BYOD-Heavy Deployments
- 4.3.2 Overlap With MDM, UEM, and EDR Budgets Slowing Standalone Purchases
- 4.3.3 Limited Security Telemetry on Consumer-Owned Devices
- 4.3.4 Integration Friction With Legacy Identity and Mobile Fleet Tooling
- 4.4 Impact of Macroeconomic Factors on the Market
- 4.5 Industry Value Chain Analysis
- 4.6 Technology Outlook
- 4.7 Regulatory Landscape
- 4.8 Porter's Five Forces Analysis
- 4.8.1 Threat of New Entrants
- 4.8.2 Bargaining Power of Suppliers
- 4.8.3 Bargaining Power of Buyers
- 4.8.4 Threat of Substitutes
- 4.8.5 Intensity of Competitive Rivalry
5 MARKET SIZE AND GROWTH FORECASTS (VALUE)
- 5.1 By Solution
- 5.1.1 Software
- 5.1.2 Services
- 5.2 By Deployment
- 5.2.1 Cloud-Based
- 5.2.2 Hybrid
- 5.2.3 On-Premises
- 5.3 By Operating System
- 5.3.1 Android
- 5.3.2 iOS
- 5.3.3 Windows
- 5.3.4 Others
- 5.4 By Enterprise Size
- 5.4.1 Large Enterprises
- 5.4.2 Small and Medium Enterprises
- 5.5 By End-User Industry
- 5.5.1 IT and Telecommunication
- 5.5.2 BFSI
- 5.5.3 Healthcare and Life Sciences
- 5.5.4 Retail and E-Commerce
- 5.5.5 Industrial Manufacturing
- 5.5.6 Education and Research Institutions
- 5.5.7 Media and Entertainment
- 5.5.8 Government and administration
- 5.5.9 Energy and Utilities
- 5.5.10 Other End-User Industries
- 5.6 By Geography
- 5.6.1 North America
- 5.6.1.1 United States
- 5.6.1.2 Canada
- 5.6.1.3 Mexico
- 5.6.2 South America
- 5.6.2.1 Brazil
- 5.6.2.2 Argentina
- 5.6.2.3 Rest of South America
- 5.6.3 Europe
- 5.6.3.1 Germany
- 5.6.3.2 United Kingdom
- 5.6.3.3 France
- 5.6.3.4 Russia
- 5.6.3.5 Spain
- 5.6.3.6 Rest of Europe
- 5.6.4 Asia-Pacific
- 5.6.4.1 China
- 5.6.4.2 Japan
- 5.6.4.3 India
- 5.6.4.4 South Korea
- 5.6.4.5 Southeast Asia
- 5.6.4.6 Rest of Asia-Pacific
- 5.6.5 Middle East and Africa
- 5.6.5.1 Middle East
- 5.6.5.1.1 Saudi Arabia
- 5.6.5.1.2 United Arab Emirates
- 5.6.5.1.3 Turkey
- 5.6.5.1.4 Rest of Middle East
- 5.6.5.2 Africa
- 5.6.5.2.1 South Africa
- 5.6.5.2.2 Nigeria
- 5.6.5.2.3 Egypt
- 5.6.5.2.4 Rest of Africa
- 5.6.5.1 Middle East
- 5.6.1 North America
6 COMPETITIVE LANDSCAPE
- 6.1 Market Concentration
- 6.2 Strategic Moves
- 6.3 Market Share Analysis
- 6.4 Company Profiles (includes Global Level Overview, Market Level Overview, Core Segments, Financials as available, Strategic Information, Market Rank/Share, Products and Services, Recent Developments)
- 6.4.1 Lookout, Inc.
- 6.4.2 Zimperium, Inc.
- 6.4.3 Check Point Software Technologies Ltd.
- 6.4.4 Cisco Systems, Inc.
- 6.4.5 Broadcom Inc.
- 6.4.6 IBM Corporation
- 6.4.7 Palo Alto Networks, Inc.
- 6.4.8 Jamf Holding Corp.
- 6.4.9 Ivanti, Inc.
- 6.4.10 Trend Micro Incorporated
- 6.4.11 Sophos Limited
- 6.4.12 BlackBerry Limited
- 6.4.13 Microsoft Corporation
- 6.4.14 VMware, Inc.
- 6.4.15 OPSWAT, Inc.
- 6.4.16 Pradeo Security Systems SAS
- 6.4.17 Guardsquare NV
- 6.4.18 Matrix42 AG
- 6.4.19 Esper.io Inc.
- 6.4.20 F-Secure Oyj
7 MARKET OPPORTUNITIES AND FUTURE OUTLOOK
- 7.1 White-Space and Unmet-Need Assessment

 超高安全性智慧型手機市場規模、佔有率和成長分析:按安全等級、作業系統、部署模式、最終用戶、銷售管道和地區分類-2026-2033年產業預測
 行動安全市場-2026-2032年全球市場預測
 全球行動威脅防禦市場(2025-2029 年)
 超高安全性智慧型手機市場規模、佔有率、趨勢和預測:按作業系統、最終用戶和地區分類,2026-2034 年行動威脅防禦市場:按組件、作業系統、威脅類型、設備類型、部署模式、組織規模和最終用戶分類-2026-2032年全球市場預測
 2026年全球行動安全市場報告
 行動安全市場規模、佔有率和成長分析:按最終用戶、作業系統、部署類型和地區分類-2026-2033年產業預測全球移動威脅防禦市場規模、佔有率、趨勢和成長分析報告(2026-2034)全球行動安全市場規模、佔有率、趨勢和成長分析報告(2026-2034)2026年超安全智慧型手機全球市場報告