


 |
市場調查報告書
商品編碼
2098557
桌面GPU:市場佔有率分析、產業趨勢與統計、成長預測(2026-2031年)Desktop GPU - Market Share Analysis, Industry Trends & Statistics, Growth Forecasts (2026 - 2031) |
||||||

※ 本網頁內容可能與最新版本有所差異。詳細情況請與我們聯繫。
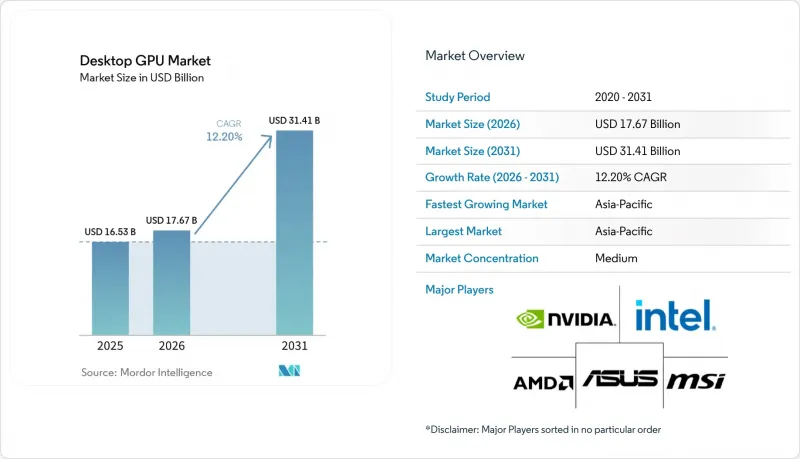
根據 Mordor Intelligence 預測,桌上型 GPU 市場規模預計將在 2025 年達到 165.3 億美元,2026 年達到 176.7 億美元,到 2031 年達到 314.1 億美元,2026 年至 2031 年的複合年成長率為 12.20%。
本報告按GPU整合類型(獨立GPU、整合GPU)、應用領域(遊戲、專業視覺化和CAD、多媒體編輯和內容創作等)、效能等級(入門級GPU、主流GPU、高效能/發燒級GPU等)、最終用戶(一般消費者、企業、政府等)以及地區進行細分。市場預測以美元計價。
全球桌面GPU市場趨勢與洞察
人工智慧(AI)工作負載遷移到桌面級GPU
桌面GPU市場最大的成長動力來自AI工作負載,這些工作負載不僅運作在雲端和資料中心環境中,也運作在消費性桌上型電腦上。據NVIDIA稱,基於Blackwell架構的GeForce RTX 50系列產品支援第五代Tensor Core和FP4,使用FLUX.1進行影像生成處理在RTX 5090上僅需5秒,而上一代FP16環境下則需要15秒。這顯著提升了消費級顯示卡在AI創意任務中的實際價值。這意味著桌上型GPU買家不再需要在遊戲GPU和AI GPU之間做出選擇,因為同一款獨立顯示卡即可滿足這兩種應用場景的需求。此外,由於生產力、渲染和本地模型效能的提升可以同時帶來效能提升,升級也縮短了顯示卡的更換週期。 NVIDIA透過將晶片技術的進步與NIM微服務和AI藍圖相結合,進一步推動了這項變革,為開發者提供了更多理由繼續使用面向RTX的工作流程。因此,桌面 GPU 市場正向更高的價格區間轉變,軟體支援、AI 吞吐量以及影格速率都被視為重要的因素。
高階遊戲和電競升級週期
儘管高階遊戲仍是桌上型GPU市場的主要驅動力,但如今的需求焦點已不再是入門級遊戲,而是更高的顯示解析度、更高的更新率以及AI驅動的渲染。 NVIDIA表示,DLSS 4憑藉其多幀生成功能,在RTX 50系列硬體上可以將影格速率提升至傳統渲染的八倍,從而提升高階顯示卡在1440p、4K和競技遊戲環境中的實際價值。 AMD也正是基於這項轉變推出了RDNA 4架構,並強調在AI加速器方面,每個運算單元的射線追蹤吞吐量加倍,INT8吞吐量更是比RDNA 3提升了八倍。電競組織、網咖和專業區域網路場地升級硬體以提升遊戲體驗和直播輸出,也帶動了桌面GPU市場的發展,從而將需求擴展到了消費者之外。與消費者用戶相比,商業用戶通常能夠更規律地更新系統,從而形成更持久的升級週期。因此,即使推動升級的因素變得更加普遍和苛刻,桌上型 GPU 市場仍繼續獲得遊戲產業的支援。
內存供應短缺和基板成本上漲
桌面GPU市場面臨一個直接限制因素:顯存供應。顯示卡生產依賴龐大的顯存生態系統,而此系統也受到AI加速器需求的驅動。核心問題在於,消費級顯存面臨供應壓力,因為供應商有強烈的獎勵將先進的產能分配給高價值的顯存產品。在桌面GPU市場,這種壓力不僅推高了零售價格,也壓縮了闆卡合作夥伴在主流產品上維持利潤空間的空間。因此,高階顯示卡銷售持續走高,因為消費者願意支付更高的價格,而價格敏感型產品在保持獲利的同時,銷售難度也越來越大。這使得競爭格局向擁有更優供應合約和更強大銷售管道管理能力的品牌傾斜。此外,桌面GPU市場正日益轉向以提升產品價值而非大幅提高銷售量為導向的成長模式。
細分市場分析
2025年,獨立顯示卡將佔據桌面GPU市場72.11%的佔有率,同時也是成長最快的整合式顯示卡類型,到2031年複合年成長率將達到13.23%。這一主導地位反映了當前桌面GPU市場依賴4K遊戲、射線追蹤、本地AI推理、影片編碼和3D模擬等工作負載——在這些領域,同價位的整合式顯示卡尚未達到實用水平。因此,桌上型GPU產業最為重視能夠在單一機器上處理多個高負載工作流程的顯示卡。 2025年1月,NVIDIA發表了售價1,999美元的GeForce RTX 5090,進一步鞏固了桌面GPU市場的這一細分領域。這款顯示卡配備32GB GDDR7記憶體和1792GB/s的頻寬,重新定義了消費級顯示卡的效能上限。此次發布產生了重大影響,不僅對單一產品而言如此,而且還提高了相鄰獨立 GPU 的價格範圍,使高階 AI 遊戲顯示卡更容易透過零售管道獲得。
到2025年,整合式顯示卡將佔據剩餘28%的銷售佔有率,而它們在桌面顯示卡市場中的作用遠比這個數字所顯示的更為重要。整合式顯示卡仍廣泛應用於辦公室系統、輕量級創新工作和休閒遊戲,在這些應用中,成本、散熱限制和系統簡易性仍然比峰值圖形處理能力更為重要。在桌面顯示卡市場,整合式顯示卡也成為了入門級成本績效的標桿,因為任何晶片級圖形性能的提升都會對利潤微薄的獨立顯示卡構成壓力。 AMD Ryzen AI 300系列桌上型電腦處理器上的RDNA 3.5整合顯示卡提升了1080p遊戲和輕量級運算任務的效能標準,使得使用者更容易延後購買一些低階獨立顯示卡。隨著AMD和英特爾的軟體框架不斷增強對整合顯示卡運算的支持,桌面顯示卡產業將迎來更多無需獨立顯示卡即可處理的輕量級AI推理和媒體相關任務,而獨立顯示卡將繼續在高價值工作負載領域保持其主導地位。
區域分析
預計到2025年,亞太地區將佔據桌面GPU市場37.44%的佔有率,並在2031年之前以13.67%的複合年成長率持續成長,成為桌面GPU市場中規模最大、成長最快的區域市場。日本憑藉創紀錄的PC更換需求,推動了這一成長動能。根據《日經新聞》報道,2025年日本國內PC出更換將達到1,805.9萬台,較去年同期成長32.6%,主要原因是Windows 10停止支援以及GIGA School的終端升級。這對桌上型GPU市場具有重大意義,因為消費級和專業級用戶的系統更換週期往往會增加遊戲和創新領域對獨立顯示卡的需求。韓國仍然是一個重要的市場,因為其遊戲文化和網咖的普及維持了對電競和直播專用系統的高更換需求。中國則以另一種方式推動桌面GPU市場的發展。國內GPU在地化程度的提高,催生了對本地硬體堆疊的需求,進而帶動了消費者、企業和軟體領域的投資成長。
由於創意、工程、遊戲開發和人工智慧軟體活動的集中,北美和歐洲仍然是桌面GPU市場最有價值的地區。這些地區的買家傾向於購買高性能、發燒級和工作站系統,顯示卡不僅用於休閒,也用於專業產出。北美桌面GPU市場擁有強大的AI開發者、視覺特效工作室和模擬密集型公司用戶基礎,即使消費者升級週期延長,需求仍然強勁。在歐洲,企業採購規則和能源效率要求進一步增加了選擇因素,使買家的選擇標準更加嚴格,但他們投資能夠應對長時間工作週期的高效能桌面系統的意願仍然很高。
南美洲和中東及非洲雖然銷量較小,但仍是桌面GPU市場的重要成長區域。在南美洲,巴西佔據了相當大的市場佔有率,這主要得益於遊戲、創意活動和本地數位媒體製作對主流獨立顯示卡的需求。在中東和非洲,對電競場館、創作空間和娛樂產業的投資正在擴大桌面級圖形系統的潛在客戶群。這兩個地區的桌面GPU市場對價格仍然十分敏感,主流和入門級產品是市場滲透的關鍵,但供應狀況和進口結構仍會影響實際零售供應。
其他好處:
- Excel格式的市場預測(ME)表
- 3個月的分析師支持
目錄
第1章:引言
- 研究假設和市場定義
- 調查範圍
第2章:調查方法
第3章執行摘要
第4章 市場狀況
- 市場概覽
- 市場促進因素
- 人工智慧(AI)工作負載正在轉移到桌面級GPU。
- 高階遊戲和電競升級週期
- 創作者和專業人士對可視化的需求
- 桌面人工智慧推理與局部模型微調
- 中國國內GPU供應鏈本地化
- 由於新一代記憶體和電源技術,平均售價不斷上漲
- 市場限制因素
- 內存供應短缺和基板成本上漲
- 整合式顯示卡和高效能筆記型電腦正在蠶食入門級市場。
- 高階機型升級電源、散熱和電源供應器所帶來的負擔。
- 中國出口限制與產品結構扭曲
- 產業價值鏈分析
- 宏觀經濟因素對市場的影響
- 監理情勢
- 技術展望
- 波特五力分析
第5章 市場規模與成長預測
- GPU整合類型
- 獨立顯示卡
- 整合顯示卡
- 透過使用
- 遊戲
- 專業人士的視覺化和CAD
- 多媒體編輯與內容創作
- 其他
- 按績效水準
- 入門級GPU
- 主流GPU
- 高效能/發燒級GPU
- 專業工作站GPU
- 按地區
- 北美洲
- 美國
- 加拿大
- 墨西哥
- 歐洲
- 德國
- 英國
- 法國
- 義大利
- 其他歐洲國家
- 亞太地區
- 中國
- 日本
- 韓國
- 印度
- 東南亞
- 其他亞太國家
- 南美洲
- 中東和非洲
- 北美洲
第6章 競爭情勢
- 市場集中度
- 策略趨勢
- Market Positioning Analysis
- 公司簡介
- NVIDIA Corporation
- Advanced Micro Devices, Inc.
- Intel Corporation
- ASUSTeK Computer Inc.
- Micro-Star International Co., Ltd.
- GIGA-BYTE TECHNOLOGY CO., LTD.
- ZOTAC Technology Limited
- SAPPHIRE Technology Limited
- TUL Corporation
- PNY Technologies, Inc.
- ASRock Inc.
- Colorful Technology Company Limited
- Palit Microsystems Ltd.
- InnoVISION Multimedia Limited
- Leadtek Research Inc.
- Sparkle Computer Co., Ltd.
- Moore Threads Intelligent Technology(Beijing)Co., Ltd.
- Biren Technology Co., Ltd.
- XFX Inc.
- GALAXY Microsystems Ltd.
第7章 市場機會與未來展望
According to Mordor Intelligence, the desktop GPU market size is projected to be USD 16.53 billion in 2025, USD 17.67 billion in 2026, and reach USD 31.41 billion by 2031, growing at a CAGR of 12.20% from 2026 to 2031.
This report is Segmented by GPU Integration Type (Discrete GPU and Integrated GPU), Application (Gaming, Professional Visualization and CAD, Multimedia Editing and Content Creation, and More), Performance Tier (Entry-Level GPUs, Mainstream GPUs, Performance / Enthusiast GPUs, and More), End User (Consumer, Enterprise, Government, and More), and Geography. The Market Forecasts are Provided in Terms of Value (USD).
Global Desktop GPU Market Trends and Insights
Artificial Intelligence Workloads Moving into Desktop-Class GPUs
The desktop GPU market is seeing its strongest push from AI workloads that now run on consumer desktops instead of staying inside cloud or data center environments. NVIDIA stated that GeForce RTX 50 series products based on Blackwell brought fifth-generation Tensor Cores and FP4 support, with FLUX.1 image generation completing in 5 seconds on the RTX 5090 versus 15 seconds on the prior generation with FP16, which materially changed the practical value of consumer cards for AI creation tasks. That change means buyers in the desktop GPU market are no longer choosing between a gaming card and an AI card because the same discrete product now supports both use cases. It also shortens the replacement cycle because buyers can justify an upgrade on productivity, rendering, and local model performance at the same time. NVIDIA reinforced that shift by pairing silicon advances with NIM microservices and AI Blueprints, which gave developers more reasons to stay inside RTX-oriented workflows. As a result, the desktop GPU market is moving toward higher price bands where software support and AI throughput matter as much as frame rates.
Premium Gaming and Esports Upgrade Cycles
Premium gaming remains a major engine of the desktop GPU market, but demand is now centered on higher display resolutions, higher refresh rates, and AI-assisted rendering rather than on entry-level play. NVIDIA said DLSS 4 with Multi Frame Generation can multiply frame rates by up to 8x over traditional rendering on RTX 50 series hardware, which raises the practical value of premium cards for 1440p, 4K, and competitive gaming setups. AMD also positioned its RDNA 4 launch around this shift, highlighting a 2x gain in ray tracing throughput per compute unit and up to 8x INT8 throughput versus RDNA 3 in its AI accelerator path. The desktop GPU market benefits because esports organizations, internet cafes, and professional LAN venues refresh hardware for both gameplay quality and streaming output, which extends demand beyond single-home buyers. That makes the upgrade cycle more durable, since commercial operators often replace systems on a more predictable schedule than retail consumers. The desktop GPU market therefore keeps drawing support from gaming even as the logic behind upgrades becomes broader and more performance intensive.
Memory Supply Tightness and Rising Board Costs
The desktop GPU market faces a direct constraint from memory supply because graphics card production depends on the same broad memory ecosystem that is also being pulled toward AI accelerator demand. The core issue is that suppliers have stronger incentives to commit advanced capacity to higher-value memory products, which leaves consumer graphics memory under pressure. In the desktop GPU market, that pressure does not only lift retail prices, it also narrows the room that board partners have to protect margins in mainstream products. The result is a market where premium cards can still clear because buyers accept higher prices, while price-sensitive tiers become harder to serve profitably. This changes the competitive balance in favor of brands with better supply agreements and stronger channel control. It also reinforces the shift of the desktop GPU market toward value growth rather than broad unit expansion.
Other drivers and restraints analyzed in the detailed report include:
- Creator and Professional Visualization Demand
- Desktop AI Inference and Local Model Fine-Tuning
- Integrated Graphics and High-Performance Notebooks Cannibalizing Entry-Level Demand
For complete list of drivers and restraints, kindly check the Table Of Contents.
Segment Analysis
Discrete GPUs accounted for 72.11% of desktop GPU market share in 2025, and they are also the fastest-growing integration type with a 13.23% CAGR through 2031. That leadership reflects the fact that the desktop GPU market now depends on workloads such as 4K gaming, ray tracing, local AI inference, video encoding, and 3D simulation that remain beyond the practical reach of integrated graphics at similar price levels. The desktop GPU industry is therefore placing its highest value on cards that can serve more than one demanding workflow in the same machine. NVIDIA reinforced this end of the desktop GPU market when it launched the GeForce RTX 5090 in January 2025 with 32 GB of GDDR7 memory, 1,792 GB/s of bandwidth, and a USD 1,999 list price that reset the performance ceiling for consumer cards. That launch mattered beyond one product because it pulled the pricing structure of adjacent discrete tiers upward and made high-end AI-ready gaming cards more acceptable in the retail channel.
Integrated GPUs made up the remaining 28% of revenue in 2025, and their role in the desktop GPU market is larger than that revenue figure alone suggests. They continue to serve office systems, light creative work, and casual gaming, where cost, thermal limits, and system simplicity still matter more than peak graphics throughput. The desktop GPU market also uses integrated graphics as a reference point for entry-level value, since every improvement in on-die graphics raises the pressure on low-margin discrete cards. AMD's RDNA 3.5 integrated graphics in Ryzen AI 300 series desktop processors moved the baseline higher for 1080p gaming and lighter compute tasks, which makes some low-end discrete purchases easier to postpone. As software frameworks from AMD and Intel improve support for integrated GPU compute, the desktop GPU industry may see more light AI inference and media tasks handled without a separate card, while the discrete tier keeps its advantage in higher-value workloads.
Complete Report Scope:
- By GPU Integration Type
- Discrete GPU
- Integrated GPU
- By Application
- Gaming
- Professional Visualization and CAD
- Multimedia Editing and Content Creation
- Other Applications
- By Performance Tier
- Entry-Level GPUs
- Mainstream GPUs
- Performance / Enthusiast GPUs
- Professional Workstation GPUs
- By Geography
- North America
- United States
- Canada
- Mexico
- Europe
- Germany
- United Kingdom
- France
- Italy
- Rest of Europe
- Asia-Pacific
- China
- Japan
- South Korea
- India
- Southeast Asia
- Rest of Asia-Pacific
- South America
- Middle East and Africa
- North America
Geography Analysis
Asia-Pacific accounted for 37.44% of desktop GPU market share in 2025, and it is projected to expand at 13.67% CAGR through 2031, making it the largest and fastest-growing regional segment in the desktop GPU market. Japan supported that momentum with record PC refresh activity, as Nikkei reported annual domestic PC shipments of 18.059 million units in fiscal 2025, up 32.6% year over year, driven by Windows 10 end-of-support replacement and GIGA School device renewal. That matters for the desktop GPU market because refresh cycles in consumer and prosumer systems tend to lift attachment opportunities for discrete graphics in gaming and creative setups. South Korea continues to matter because its gaming culture and internet cafe footprint sustain high replacement activity in systems built for esports and streaming. China adds a different kind of support to the desktop GPU market because domestic GPU localization is creating demand for local hardware stacks and reinforcing investment across consumer, enterprise, and software layers.
North America and Europe remain the highest-value regions in the desktop GPU market because they concentrate creator, engineering, game development, and AI software activity. Buyers in these regions are more likely to purchase performance, enthusiast, and workstation systems where graphics cards serve professional output as well as leisure use. The desktop GPU market in North America is supported by a deep base of AI developers, visual effects studios, and simulation-heavy enterprises that keep demand firm even when household upgrade cycles stretch out. Europe adds another layer through enterprise procurement rules and energy-efficiency requirements, which make buyers more selective but still willing to spend on capable desktop systems that serve longer work cycles.
South America and the Middle East and Africa represent a smaller revenue base, but they remain important growth spaces for the desktop GPU market. Brazil carries much of the regional weight in South America because gaming, creator activity, and local digital media production keep demand centered on mainstream discrete products. In the Middle East and Africa, esports venues, creator spaces, and entertainment investments are widening the addressable base for desktop-class graphics systems. The desktop GPU market in both regions remains price sensitive, which keeps mainstream and entry-level products central to adoption even as supply conditions and import structures continue to shape actual retail availability.
- NVIDIA Corporation
- Advanced Micro Devices, Inc.
- Intel Corporation
- ASUSTeK Computer Inc.
- Micro-Star International Co., Ltd.
- GIGA-BYTE TECHNOLOGY CO., LTD.
- ZOTAC Technology Limited
- SAPPHIRE Technology Limited
- TUL Corporation
- PNY Technologies, Inc.
- ASRock Inc.
- Colorful Technology Company Limited
- Palit Microsystems Ltd.
- InnoVISION Multimedia Limited
- Leadtek Research Inc.
- Sparkle Computer Co., Ltd.
- Moore Threads Intelligent Technology (Beijing) Co., Ltd.
- Biren Technology Co., Ltd.
- XFX Inc.
- GALAXY Microsystems Ltd.
Additional Benefits:
- The market estimate (ME) sheet in Excel format
- 3 months of analyst support
TABLE OF CONTENTS
1 INTRODUCTION
- 1.1 Study Assumptions and Market Definition
- 1.2 Scope of the Study
2 RESEARCH METHODOLOGY
3 EXECUTIVE SUMMARY
4 MARKET LANDSCAPE
- 4.1 Market Overview
- 4.2 Market Drivers
- 4.2.1 Artificial Intelligence Workloads Moving Into Desktop-Class GPUs
- 4.2.2 Premium Gaming and Esports Upgrade Cycles
- 4.2.3 Creator and Professional Visualization Demand
- 4.2.4 Desktop AI Inference and Local Model Fine-Tuning
- 4.2.5 Domestic GPU Supply Chain Localization in China
- 4.2.6 Higher Average Selling Prices From Next-Generation Memory and Power Delivery
- 4.3 Market Restraints
- 4.3.1 Memory Supply Tightness and Rising Board Costs
- 4.3.2 Integrated Graphics And High-Performance Notebooks Cannibalizing Entry-Level Demand
- 4.3.3 Power, Cooling, and PSU Upgrade Burden at the High End
- 4.3.4 Export Controls and Product Mix Distortion in China
- 4.4 Industry Value Chain Analysis
- 4.5 Impact of Macroeconomic Factors on the Market
- 4.6 Regulatory Landscape
- 4.7 Technological Outlook
- 4.8 Porter's Five Forces Analysis
- 4.8.1 Bargaining Power of Suppliers
- 4.8.2 Bargaining Power of Buyers
- 4.8.3 Threat of New Entrants
- 4.8.4 Threat of Substitutes
- 4.8.5 Intensity of Competitive Rivalry
5 MARKET SIZE AND GROWTH FORECASTS (VALUE)
- 5.1 By GPU Integration Type
- 5.1.1 Discrete GPU
- 5.1.2 Integrated GPU
- 5.2 By Application
- 5.2.1 Gaming
- 5.2.2 Professional Visualization and CAD
- 5.2.3 Multimedia Editing and Content Creation
- 5.2.4 Other Applications
- 5.3 By Performance Tier
- 5.3.1 Entry-Level GPUs
- 5.3.2 Mainstream GPUs
- 5.3.3 Performance / Enthusiast GPUs
- 5.3.4 Professional Workstation GPUs
- 5.4 By Geography
- 5.4.1 North America
- 5.4.1.1 United States
- 5.4.1.2 Canada
- 5.4.1.3 Mexico
- 5.4.2 Europe
- 5.4.2.1 Germany
- 5.4.2.2 United Kingdom
- 5.4.2.3 France
- 5.4.2.4 Italy
- 5.4.2.5 Rest of Europe
- 5.4.3 Asia-Pacific
- 5.4.3.1 China
- 5.4.3.2 Japan
- 5.4.3.3 South Korea
- 5.4.3.4 India
- 5.4.3.5 Southeast Asia
- 5.4.3.6 Rest of Asia-Pacific
- 5.4.4 South America
- 5.4.5 Middle East and Africa
- 5.4.1 North America
6 COMPETITIVE LANDSCAPE
- 6.1 Market Concentration
- 6.2 Strategic Moves
- 6.3 Market Positioning Analysis
- 6.4 Company Profiles (includes Global Level Overview, Market Level Overview, Core Segments, Financials as available, Strategic Information, Market Rank/Share, Products and Services, Recent Developments)
- 6.4.1 NVIDIA Corporation
- 6.4.2 Advanced Micro Devices, Inc.
- 6.4.3 Intel Corporation
- 6.4.4 ASUSTeK Computer Inc.
- 6.4.5 Micro-Star International Co., Ltd.
- 6.4.6 GIGA-BYTE TECHNOLOGY CO., LTD.
- 6.4.7 ZOTAC Technology Limited
- 6.4.8 SAPPHIRE Technology Limited
- 6.4.9 TUL Corporation
- 6.4.10 PNY Technologies, Inc.
- 6.4.11 ASRock Inc.
- 6.4.12 Colorful Technology Company Limited
- 6.4.13 Palit Microsystems Ltd.
- 6.4.14 InnoVISION Multimedia Limited
- 6.4.15 Leadtek Research Inc.
- 6.4.16 Sparkle Computer Co., Ltd.
- 6.4.17 Moore Threads Intelligent Technology (Beijing) Co., Ltd.
- 6.4.18 Biren Technology Co., Ltd.
- 6.4.19 XFX Inc.
- 6.4.20 GALAXY Microsystems Ltd.
7 MARKET OPPORTUNITIES AND FUTURE OUTLOOK
- 7.1 White-Space and Unmet-Need Assessment

