


 |
市場調查報告書
商品編碼
2097340
太陽能充電器:市場佔有率分析、產業趨勢與統計、成長預測(2026-2031)Solar Charger - Market Share Analysis, Industry Trends & Statistics, Growth Forecasts (2026 - 2031) |
||||||

※ 本網頁內容可能與最新版本有所差異。詳細情況請與我們聯繫。
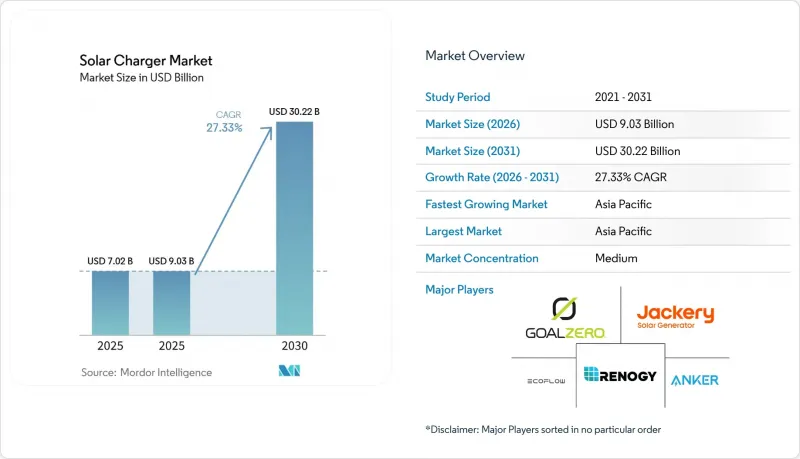
根據 Mordor Intelligence 預測,太陽能充電器市場預計將從 2025 年的 70.2 億美元成長到 2026 年的 90.3 億美元,到 2031 年達到 302.2 億美元,2026 年至 2031 年的複合年成長率預計為 27.33%。
本報告按類型(面板式、汽車電池式、折疊式/軟性、背包式、一體式)、功率輸出(小於5W、5-20W、21-50W、大於50W)、應用領域(家用電子電器、汽車、軍事、工業、離網)、最終用戶(個人、企業、政府、非政府組織)和地區(北美、歐洲、非洲、南美、中東、歐洲和非洲地區細分。市場預測以美元計價。
全球太陽能充電器市場趨勢與洞察
戶外休閒的增加和對離網電力需求的成長。
戶外休閒支出持續成長,直接影響20-50瓦折疊式太陽能板的購買模式,這些電池板能夠保障智慧型手機、無人機和筆記型電腦在多日旅行中的運作。到2025年,分散式太陽能發電將佔全球新增太陽能裝置容量的42%,凸顯了太陽能系統向小規模結構轉變的趨勢。國防領域的示範應用正在推動民用領域的需求。例如,安裝在戰術車輛上的300瓦屋頂太陽能電池陣列減少了10%的柴油消耗,這一案例引起了越野愛好者和探險裝備供應商的共鳴。災害應變也是推動太陽能市場發展的重要因素。非政府組織正在易受颶風和野火侵襲的地區部署貨櫃式微電網,進一步鞏固了太陽能充電器作為一種低成本緊急資產的地位。這些因素共同作用,正推動太陽能充電器市場從小眾的露營配件擴展到更廣泛的離網電源領域。
降低太陽能發電成本並提高效率
預計到2025年,可攜式充電器的價格將低於每瓦0.10美元,與2020年相比,組件成本將降低30-40%。軟性鈣鈦礦矽串聯電池在實驗室檢驗的原型機中已達到33.89%的效率,同時縮小了面積並減輕了重量。汽車製造商已開始受益於這種成本效益,AGC Automotive的背接觸式太陽能車頂計畫開始量產,效率超過25%。這項技術將延長車輛的續航里程,無需插電充電,並且無需捲簾機構。隨著單位經濟效益的提高,積極的零售定價策略使得太陽能移動電池的每瓦時成本低於傳統的快充電池組,預計這一趨勢將在三年內成為現實。這些因素正推動太陽能充電器市場以27.3%的複合年成長率成長。
輻射波動和太陽能資源的間歇性
一項歷時100萬公里的長期道路測試監測顯示,中歐地區車輛車頂太陽能板的年發電量僅為每平方公尺2.8千瓦時,而赤道地區則高達每平方公尺4.6千瓦時。這種差異意味著,冬季在奧斯陸為智慧型手機充電所需的時間可能是曼谷的三倍。雖然可攜式電源品牌正透過MPPT控制器和高容量電池來解決這種間歇性問題,但額外的成本和重量增加阻礙了其在多雲地區的普及,使得太陽能充電器市場本質上具有地域性。
基於細分市場的分析
預計到2031年,折疊式和軟性太陽能充電器的年複合成長率(CAGR)將達到31.8%,顯著高於整體太陽能充電器市場。此成長主要得益於鈣鈦礦矽串聯電池,其效率高達33.89%,且彎曲時不易斷裂。同時,由於房車、遊艇和度假小屋的業主仍然優先考慮耐用性而非便攜性,預計剛性面板充電器將保持37.9%的市場佔有率。
車載光伏(VIPV)正在提升性能標竿。現代汽車旗下子公司Solarstic推出了輸出功率達500瓦的射出成型成型聚合物組件,可直接整合到車輛面板中。隨著成本的降低,汽車電池售後涓流充電器的重要性可能會下降,而軟性消費級光電面板則受惠於汽車主導的規模經濟效益。這些技術的融合正在重塑整個太陽能充電器市場的價值分配格局。
到2025年,5-20瓦功率段的銷售量將佔總銷售量的39.6%,反映出其在智慧型手機充電應用領域的主導地位。 21-50瓦功率段的成長速度最快,複合年成長率達30.2%,這主要得益於其在筆記型電腦、無人機和微型行動裝置等領域應用的日益廣泛。
高功率(100瓦及以上)折疊式板的應用範圍正日益擴展,並逐漸與半永久性太陽能陣列的應用重疊。一個顯著的例子是日產的500瓦「Ao-Solar Extender」原型機,它可以將電動車的年續航里程延長3000公里。隨著消費者越來越期望100瓦級太陽能板擁有與屋頂安裝式太陽能板相同的效率,供應商正在採用高品質的電池片和增強型層壓板來確保太陽能充電器產品的可靠性。
區域分析
預計到2025年,亞太地區將佔全球銷售額的35.5%,並在2031年之前以29.1%的複合年成長率成長。這一成長得益於TISI、ICC和CR等認證體系,這些體系限制了不合格進口,增強了消費者信心。中國垂直整合的供應鏈使其處理成本比西方競爭對手低20-30%。同時,在印度,進口關稅的影響正促使組裝投資轉向國內生產。印尼和菲律賓智慧型手機的普及推動了基本單位的需求,而在颱風頻繁的島國,太陽能充電器的推廣應用正在增強能源韌性。
北美市場的前景喜憂參半。休閒休閒和房車用戶的需求支撐著50-200瓦功率段的銷售,而聯邦投資稅額扣抵抵免(ITC)的到期將住宅系統的投資回收期延長至10年,減緩了屋頂太陽能發電市場的成長勢頭。美國陸軍的多年採購計畫以及馬薩諸塞州薩默維爾的太陽能電動自行車中心表明,國防和市政項目正在抵消民營市場的波動。加拿大度假屋市場和墨西哥偏遠農村地區對中功率產品的需求仍然強勁,支撐著北美整體市場佔有率。
歐洲正受益於持續的政策支持。德國的陽台太陽能板和英國於2026年3月批准的插電式太陽能板減少了對專業安裝的需求,使居住者更容易採用太陽能。法國的上網電價補貼(FiT)計畫正在促進住宅的太陽能普及,而北歐國家則利用夏季更長的日照時間,在船舶和客艙中使用太陽能的情況日益增多。在其他地區,巴西亞馬遜地區、阿拉伯聯合大公國沙漠和南非等地規劃性停電帶來的挑戰,催生了高成長但高風險的市場,這些市場依賴綠色債券和多邊援助等資金籌措機制。這些新興地區正在擴大全球太陽能充電器市場,降低對成熟的歐美市場需求的依賴。
其他好處:
- Excel格式的市場預測(ME)表
- 3個月的分析師支持
目錄
第1章:引言
- 市場分析與定義的前提條件
- 分析範圍
第2章 分析方法
第3章執行摘要
第4章 市場狀況
- 市場概覽
- 市場促進因素
- 戶外休閒需求增加,離網電力需求增加
- 降低太陽能發電成本並提高效率
- 攜帶式家用電器擁有量增加
- 獎勵清潔能源發展和製定減少電子廢棄物的政策
- 在國防穿戴裝置中採用具有太陽能發電功能的織物。
- ESG資金用於引進微型交通工具的太陽能充電設施。
- 市場限制因素
- 太陽能資源輻射強度的變化和間歇性
- 與快速充電手機電池和適配器的競爭
- 主要市場對太陽能模組徵收進口關稅
- 加強用於整合行動電池的鋰離子電池的供應鏈管理。
- 供應鏈分析
- 監理情勢
- 技術展望
- 波特五力分析
第5章:預測市場規模與成長率
- 按類型
- 太陽能充電器
- 太陽能行動電源
- 汽車太陽能電池充電器
- 折疊式/軟性太陽能充電器
- 太陽能背包充電器
- 太陽能發電整合充電器
- 按輸出功率(瓦特)
- 小於 5 瓦
- 5~20 W
- 21~50 W
- 50瓦或以上
- 透過使用
- 家用電子電器
- 智慧型手機和平板電腦
- 筆記型電腦和穿戴式裝置
- 相機和無人機
- 汽車與出行
- 搭乘用車
- 微型交通工具(電動自行車、電動滑板車)
- 軍事/國防
- 工業和商業用途
- 偏遠地區/無電網地區
- 家用電子電器
- 最終用戶
- 個人消費者
- 公司/企業
- 政府/公共部門
- 非政府組織和緊急應變組織
- 按地區
- 北美洲
- 美國
- 加拿大
- 墨西哥
- 歐洲
- 德國
- 英國
- 法國
- 義大利
- 北歐國家
- 俄羅斯
- 其他歐洲國家
- 亞太地區
- 中國
- 印度
- 日本
- 韓國
- 東南亞國協
- 其他亞太國家
- 南美洲
- 巴西
- 阿根廷
- 其他南美國家
- 中東和非洲
- 沙烏地阿拉伯
- 阿拉伯聯合大公國
- 南非
- 埃及
- 其他中東和非洲國家
- 北美洲
第6章 競爭情勢
- 市場集中度
- 策略趨勢(企業合併、商業聯盟、購電協議)
- 市場佔有率分析(主要公司的市場排名和市場佔有率)
- 公司簡介
- ALLPOWERS Industrial International Co., Ltd.
- Anker Innovations Technology Co., Ltd.
- BigBlue Technology Co., Ltd.
- BioLite, Inc.
- EcoFlow Inc.
- ECEEN Technology Co., Ltd.
- Elecaenta Technology Co., Ltd.
- Goal Zero, LLC
- HQST(HQST Solar)
- Instapark
- Jackery Inc.
- Nekteck, Inc.
- Poweradd(Poweradd Technology Co., Ltd.)
- Powertraveller International Ltd.
- RAVPower
- Renogy
- Solio Ltd.
- SunJack
- SunKing(Greenlight Planet Inc.)
- Voltaic Systems, Inc.
- Xtorm BV
- X-Dragon Technology Co., Ltd.
第7章 市場機會與未來展望
According to Mordor Intelligence, the solar charger market size is expected to increase from USD 7.02 billion in 2025 to USD 9.03 billion in 2026 and reach USD 30.22 billion by 2031, growing at a CAGR of 27.33% over 2026-2031.
This report is Segmented by Type (Panel, Car-Battery, Foldable/Flexible, Backpack, Integrated), Power Output (Below 5W, 5-20W, 21-50W, Above 50W), Application (Consumer Electronics, Automotive, Military, Industrial, Off-Grid), End-User (Individual, Corporate, Government, Ngos), and Geography (North America, Europe, Asia-Pacific, South America, Middle East and Africa). Market Forecasts in Value (USD).
Global Solar Charger Market Trends and Insights
Rising Outdoor Recreation & Off-Grid Power Demand
Outdoor recreation spending continues to climb and now directly shapes purchasing patterns for 20-50 watt foldable panels that keep phones, drones, and laptops running for multi-day trips . Distributed photovoltaics supplied 42% of new global solar capacity in 2025, underscoring the structural shift toward small-scale systems. Defense validation reinforces the civilian narrative: 300-watt roof arrays on tactical vehicles trimmed diesel use by 10%, a proof point that resonates with overlanders and expedition outfitters . Disaster preparedness is another demand driver, as NGOs deploy containerized microgrids in cyclone- and wildfire-prone regions, positioning solar chargers as low-cost resilience assets. Together, these factors expand the solar charger market from a camping accessory niche into a broader off-grid power category.
Declining Solar-PV Cost and Efficiency Gains
Sub-USD 0.10 per-watt pricing reached the portable segment in 2025, cutting bill-of-materials costs by 30-40% compared with 2020. Flexible perovskite-silicon tandem cells achieved 33.89% efficiency in laboratory-validated prototypes, shrinking footprint and weight. Automakers are already capitalizing on cost efficiencies, with AGC Automotive's back-contact solar roof set to enter mass production at greater than 25% efficiency. This development will provide range extension without plug-in charging and eliminate the need for roller-blind mechanisms. As unit economics improve, aggressive retail pricing is making solar power banks cheaper on a per-watt-hour basis than conventional fast-charge packs, a trend expected to materialize within three years. These factors are driving a 27.3% CAGR in the solar charger market.
Variable Irradiance and Intermittency of Solar Resource
Longitudinal monitoring across 1 million km of road trials revealed that vehicle-roof panels in Central Europe harvest only 2.8 kWh per m2 annually, versus 4.6 kWh in equatorial regions. This variability means a wintertime smartphone charge in Oslo can take three times longer than in Bangkok. Portable power brands address intermittency with MPPT controllers and oversized batteries, but the added cost and weight slow adoption in cloudier geographies, making the solar charger market inherently regional.
Other drivers and restraints analyzed in the detailed report include:
- Growth in Portable Consumer-Electronics Ownership
- Clean-Energy Incentives and E-Waste Reduction Policies
- Competition from Fast-Charge Power Banks/Adapters
For complete list of drivers and restraints, kindly check the Table Of Contents.
Segment Analysis
Foldable and flexible models grew at a 31.8% CAGR through 2031, well above the overall solar charger market, driven by perovskite-silicon tandem cells with 33.89% efficiency that bend without cracking. Rigid panel chargers retained a 37.9% market share in 2025, as RV, marine, and cabin owners continue to prioritize durability over portability.
Automotive vehicle-integrated photovoltaics (VIPV) is raising performance benchmarks: Hyundai spin-off Solarstic's injection-molded polymer modules output 500 watts and integrate directly into body panels. As costs decline, aftermarket car-battery trickle chargers may lose relevance, while flexible consumer panels benefit from vehicle-driven scale effects. This technological convergence is reshaping value distribution across the solar charger market.
The 5-20 watt segment accounted for 39.6% of revenue in 2025, reflecting its dominance in smartphone charging applications. The 21-50 watt segment is growing at the fastest rate, with a CAGR of 30.2%, driven by expanding use in laptops, drones, and micromobility devices.
High-wattage (100 watt+) foldable panels increasingly overlap with semi-permanent array applications. A notable example is Nissan's 500-watt Ao-Solar Extender prototype, which can add 3,000 km of annual EV range. Growing consumer expectations for 100-watt panels to match rooftop efficiency levels are pushing suppliers to use premium cell bins and hardened laminates to maintain product reliability in the solar charger market.
Complete Report Scope:
- By Type
- Solar Panel Chargers
- Solar Power Banks
- Solar Car-Battery Chargers
- Foldable/Flexible Solar Chargers
- Solar Backpack Chargers
- Integrated Solar-Device Chargers
- By Power Output (Watts)
- Below 5 W
- 5 to 20 W
- 21 to 50 W
- Above 50 W
- By Application
- Consumer Electronics
- Smartphones and Tablets
- Laptops and Wearables
- Cameras and Drones
- Automotive and Mobility
- Passenger Vehicles
- Micromobility (e-bikes, scooters)
- Military and Defense
- Industrial and Commercial
- Remote and Off-grid Locations
- Consumer Electronics
- By End-user
- Individual Consumers
- Corporate and Commercial Enterprises
- Government and Public Sector
- NGOs and Emergency Services
- By Geography
- North America
- United States
- Canada
- Mexico
- Europe
- Germany
- United Kingdom
- France
- Italy
- NORDIC Countries
- Russia
- Rest of Europe
- Asia-Pacific
- China
- India
- Japan
- South Korea
- ASEAN Countries
- Rest of Asia-Pacific
- South America
- Brazil
- Argentina
- Rest of South America
- Middle East and Africa
- Saudi Arabia
- United Arab Emirates
- South Africa
- Egypt
- Rest of Middle East and Africa
- North America
Geography Analysis
Asia-Pacific accounted for 35.5% of global revenue in 2025 and is projected to grow at a CAGR of 29.1% through 2031. This growth is supported by certification frameworks such as TISI, ICC, and CR, which restrict sub-standard imports and strengthen consumer confidence. China's vertically integrated supply chain enables landed costs 20-30% below those of Western competitors, while import duties in India are redirecting assembly investment toward domestic production. Rising smartphone adoption in Indonesia and the Philippines sustains baseline unit demand, and typhoon-prone island nations are adopting solar chargers to improve energy resilience.
North America presents a mixed outlook. Demand from outdoor recreation and RV users supports sales in the 50-200 watt segment, while the expiry of the federal Investment Tax Credit (ITC) has extended residential payback periods to 10 years, reducing momentum in the rooftop segment. The U.S. Army's multiyear procurement pipeline and Massachusetts' solar e-bike hub in Somerville demonstrate how defense and municipal programs offset volatility in the civilian market. Canada's cabin market and Mexico's off-grid rural regions maintain steady mid-power demand, supporting North America's overall market share.
Europe benefits from consistent policy support. Germany's balcony solar installations and the UK's authorization of plug-in panels in March 2026 reduce the need for professional installation, making adoption more accessible for renters. France's feed-in tariff (FiT) schemes support residential uptake, while the Nordic countries utilize extended summer daylight for marine and cabin applications. In other regions, Brazil's Amazonia, the UAE's desert environments, and South Africa's ongoing load-shedding challenges represent high-growth but high-risk markets that depend on financing mechanisms such as green bonds and multilateral aid. These emerging regions broaden the global solar charger market and reduce reliance on demand from mature Western markets.
- ALLPOWERS Industrial International Co., Ltd.
- Anker Innovations Technology Co., Ltd.
- BigBlue Technology Co., Ltd.
- BioLite, Inc.
- EcoFlow Inc.
- ECEEN Technology Co., Ltd.
- Elecaenta Technology Co., Ltd.
- Goal Zero, LLC
- HQST (HQST Solar)
- Instapark
- Jackery Inc.
- Nekteck, Inc.
- Poweradd (Poweradd Technology Co., Ltd.)
- Powertraveller International Ltd.
- RAVPower
- Renogy
- Solio Ltd.
- SunJack
- SunKing (Greenlight Planet Inc.)
- Voltaic Systems, Inc.
- Xtorm B.V.
- X-Dragon Technology Co., Ltd.
Additional Benefits:
- The market estimate (ME) sheet in Excel format
- 3 months of analyst support
TABLE OF CONTENTS
1 Introduction
- 1.1 Study Assumptions & Market Definition
- 1.2 Scope of the Study
2 Research Methodology
3 Executive Summary
4 Market Landscape
- 4.1 Market Overview
- 4.2 Market Drivers
- 4.2.1 Rising outdoor recreation & off-grid power demand
- 4.2.2 Declining solar-PV cost and efficiency gains
- 4.2.3 Growth in portable consumer-electronics ownership
- 4.2.4 Clean-energy incentives & e-waste reduction policies
- 4.2.5 Adoption of solar-integrated fabrics in defense wearables
- 4.2.6 ESG-funded micromobility solar charging roll-outs
- 4.3 Market Restraints
- 4.3.1 Variable irradiance & intermittency of solar resource
- 4.3.2 Competition from fast-charge power banks/adapters
- 4.3.3 Import tariffs on PV components in key markets
- 4.3.4 Lithium-ion supply-chain tightness for integrated banks
- 4.4 Supply-Chain Analysis
- 4.5 Regulatory Landscape
- 4.6 Technological Outlook
- 4.7 Porter's Five Forces
- 4.7.1 Threat of New Entrants
- 4.7.2 Bargaining Power of Buyers
- 4.7.3 Bargaining Power of Suppliers
- 4.7.4 Threat of Substitutes
- 4.7.5 Competitive Rivalry
5 Market Size & Growth Forecasts
- 5.1 By Type
- 5.1.1 Solar Panel Chargers
- 5.1.2 Solar Power Banks
- 5.1.3 Solar Car-Battery Chargers
- 5.1.4 Foldable/Flexible Solar Chargers
- 5.1.5 Solar Backpack Chargers
- 5.1.6 Integrated Solar-Device Chargers
- 5.2 By Power Output (Watts)
- 5.2.1 Below 5 W
- 5.2.2 5 to 20 W
- 5.2.3 21 to 50 W
- 5.2.4 Above 50 W
- 5.3 By Application
- 5.3.1 Consumer Electronics
- 5.3.1.1 Smartphones and Tablets
- 5.3.1.2 Laptops and Wearables
- 5.3.1.3 Cameras and Drones
- 5.3.2 Automotive and Mobility
- 5.3.2.1 Passenger Vehicles
- 5.3.2.2 Micromobility (e-bikes, scooters)
- 5.3.3 Military and Defense
- 5.3.4 Industrial and Commercial
- 5.3.5 Remote and Off-grid Locations
- 5.3.1 Consumer Electronics
- 5.4 By End-user
- 5.4.1 Individual Consumers
- 5.4.2 Corporate and Commercial Enterprises
- 5.4.3 Government and Public Sector
- 5.4.4 NGOs and Emergency Services
- 5.5 By Geography
- 5.5.1 North America
- 5.5.1.1 United States
- 5.5.1.2 Canada
- 5.5.1.3 Mexico
- 5.5.2 Europe
- 5.5.2.1 Germany
- 5.5.2.2 United Kingdom
- 5.5.2.3 France
- 5.5.2.4 Italy
- 5.5.2.5 NORDIC Countries
- 5.5.2.6 Russia
- 5.5.2.7 Rest of Europe
- 5.5.3 Asia-Pacific
- 5.5.3.1 China
- 5.5.3.2 India
- 5.5.3.3 Japan
- 5.5.3.4 South Korea
- 5.5.3.5 ASEAN Countries
- 5.5.3.6 Rest of Asia-Pacific
- 5.5.4 South America
- 5.5.4.1 Brazil
- 5.5.4.2 Argentina
- 5.5.4.3 Rest of South America
- 5.5.5 Middle East and Africa
- 5.5.5.1 Saudi Arabia
- 5.5.5.2 United Arab Emirates
- 5.5.5.3 South Africa
- 5.5.5.4 Egypt
- 5.5.5.5 Rest of Middle East and Africa
- 5.5.1 North America
6 Competitive Landscape
- 6.1 Market Concentration
- 6.2 Strategic Moves (M&A, Partnerships, PPAs)
- 6.3 Market Share Analysis (Market Rank/Share for key companies)
- 6.4 Company Profiles (includes Global level Overview, Market level overview, Core Segments, Financials as available, Strategic Information, Products & Services, and Recent Developments)
- 6.4.1 ALLPOWERS Industrial International Co., Ltd.
- 6.4.2 Anker Innovations Technology Co., Ltd.
- 6.4.3 BigBlue Technology Co., Ltd.
- 6.4.4 BioLite, Inc.
- 6.4.5 EcoFlow Inc.
- 6.4.6 ECEEN Technology Co., Ltd.
- 6.4.7 Elecaenta Technology Co., Ltd.
- 6.4.8 Goal Zero, LLC
- 6.4.9 HQST (HQST Solar)
- 6.4.10 Instapark
- 6.4.11 Jackery Inc.
- 6.4.12 Nekteck, Inc.
- 6.4.13 Poweradd (Poweradd Technology Co., Ltd.)
- 6.4.14 Powertraveller International Ltd.
- 6.4.15 RAVPower
- 6.4.16 Renogy
- 6.4.17 Solio Ltd.
- 6.4.18 SunJack
- 6.4.19 SunKing (Greenlight Planet Inc.)
- 6.4.20 Voltaic Systems, Inc.
- 6.4.21 Xtorm B.V.
- 6.4.22 X-Dragon Technology Co., Ltd.
7 Market Opportunities & Future Outlook
- 7.1 White-space & Unmet-need Assessment
- 7.2 Emerging Portable & Wearable Charging
- 7.3 Solar Chargers in Disaster-Relief & Emergency Response
- 7.4 Integration with EVs, Drones & Micromobility
- 7.5 Advances in Flexible & Lightweight Materials
- 7.6 Energy-as-a-Service Models for Off-grid Charging

 升壓/降壓開關式電池充電晶片市場:全球市場預測,2026-2032年
 鎳基電池充電器市場報告:趨勢、預測和競爭分析(至2035年)電池充電器市場:2026-2032年全球市場預測(依供應、電池化學成分、充電方式、輸出電流容量、外形規格、應用及銷售管道)
 2026年全球變電站電池充電器市場報告智慧電池充電器市場:2026-2032年全球市場預測(按電池類型、充電技術、最終用戶、輸出電流、分銷管道和應用分類)太陽能電池充電器市場:按電池化學成分、控制器類型、最終用戶、應用和分銷管道分類-2026-2032年全球預測
 電池充電器市場報告:按應用、類別、產品類型和地區分類(2026-2034 年)2026年全球堆高機電池充電器市場報告
 智慧電池充電器市場 - 全球產業規模、佔有率、趨勢、機會、預測:按充電器類型、應用、功能、分銷管道、地區和競爭格局分類,2021-2031年MPPT晶片市場按類型、功率、演算法、應用、最終用戶和分銷管道分類,全球預測,2026-2032年