


 |
市場調查報告書
商品編碼
2097335
微生物燃料電池:市場佔有率分析、行業趨勢和統計數據、成長預測(2025-2030 年)Microbial Fuel Cell - Market Share Analysis, Industry Trends & Statistics, Growth Forecasts (2025 - 2030) |
||||||

※ 本網頁內容可能與最新版本有所差異。詳細情況請與我們聯繫。
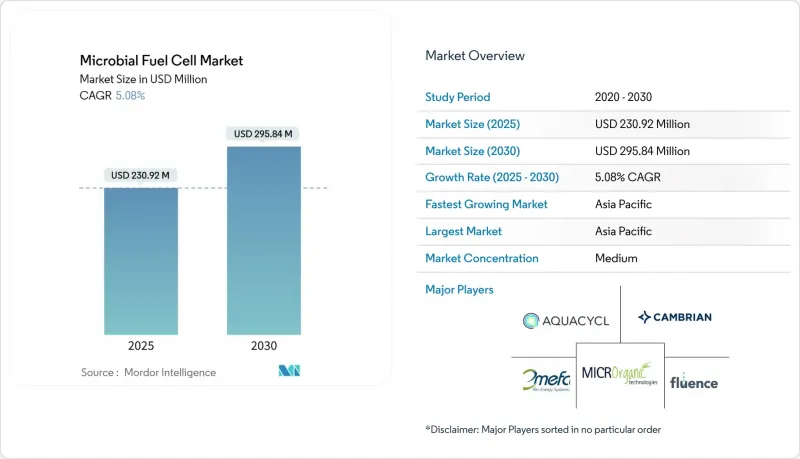
據 Mordor Intelligence 稱,微生物燃料電池市場預計在 2025 年達到 2.3092 億美元,預計在預測期(2025-2030 年)內將以 5.08% 的複合年成長率成長,到 2030 年達到 2.9584 億美元。
本報告按類型(介體型 MFC 和無介體型 MFC)、設計(單室型等)、電極材料(碳布/氈等)、基材來源(都市污水/工業污水等)、應用(污水處理和能源回收等)、最終用戶(工業、研究機構等)和地區(北美、亞太等)進行分類。
全球微生物燃料電池市場趨勢及洞察
從2025年起,研發資金將大幅成長
強而有力的聯邦和多邊津貼計畫正向微生物燃料電池市場投入大量資源,其中包括美國能源局為氫燃料電池計畫提供的4,600萬美元提案徵集資金。這些資金將加速電極材料的研發、微生物群落的設計和電堆整合檢驗,以解決長期存在的功率密度差異問題。各大學正與公共產業合作,利用真實污水驗證試點設施,從而推動實用化專案並縮短概念驗證(PoC)週期。在歐盟「地平線歐洲」計畫的推動下,資金正分配給與循環經濟相關的水資源項目,並在德國、西班牙和荷蘭建立了聯合測試基地。因此,學術專長與公共產業規模試點計畫的整合正在形成快速回饋循環,加速商業化準備。
更嚴格的全球廢水標準
歐盟指令2024/3019強制要求地方政府從污水處理設施能源回收,並明確提及生電化學解決方案。加拿大修訂後的污水處理法規中也有類似條款,允許實施先進處理系統的設施獲得過渡性批准。這些法規為選擇微生物燃料電池反應器的營運商提供了一條可預測的合規路徑,因為同時去除化學需氧量(COD)和發電可以抵消罰款負擔。法規的確定性也影響了貸款機構的風險模型,允許在企劃案融資結構中延長還款期限。這減輕了年度債務償還負擔,並擴大了在中型城市實施該計畫的可能性。
低功率密度技術與替代技術的比較
工業規模原型機的平均功率密度很少超過 200 mW/m²,這限制了它們所能處理的負載,僅限於感測和輔助能源回收。隨著反應器面積的增加,內阻和生物污染會降低性能,導致土地限制與預期輸出不匹配。研究人員正致力於開發分級多孔結構和合成菌群以提高電子轉移速率,但至少需要三倍的性能提升才能實現商業化突破。在此之前,由於發電成本高昂,其部署將僅限於無法獲得熱能、太陽能或電網電力的特定區域。
細分市場分析
由於採用了無需昂貴氧化還原化學品的直接電子轉移技術,無介體結構的微生物燃料電池在2024年佔據了60.9%的銷售額,市場規模達到1.335億美元。這些反應器對那些優先考慮維護簡單和耗材庫存量減少的業者極具吸引力。未來的成長將主要得益於庫侖效率的進一步提高,以及生物膜管理和表面功能化的改進。同時,基於介體的產品組合也具有成長空間,市場規模為8,670萬美元,預計年複合成長率將達到5.6%,因為新一代聚合物介體能夠在高電流密度下保持穩定,不會產生毒性波動。
微生物燃料電池市場正受益於這兩條發展路徑的演進。規避風險的使用者傾向於選擇成熟的無介體裝置,而追求性能的實驗室則在嘗試使用介體增強型電池堆,以突破更高的功率上限。因此,供應商正在拓展其產品組合,涵蓋這兩種類型,以確保不同領域之間的持續知識轉移,並維持收入抵禦意外性能下降的能力。
單室反應器具有即插即用安裝和極簡的墊片管理等優點,預計到2024年將佔總銷售額的59.8%,從而減少嚴苛工業環境下的停機時間。同時,目前年銷售額為2,940萬美元的模組化堆疊配置正以8.5%的複合年成長率快速成長。這是因為公共產業需要可擴展的模組,以便在無需進行大規模土木工程維修的情況下,適應波動的進水負荷。這種設計透過將故障隔離在單一模組內,降低了通道堵塞的風險,從而確保了工廠的運作。
製造商目前正在預先組裝符合ISO貨櫃尺寸的可堆疊撬裝單元,這使得現有設施能夠快速維修,並為工廠以50kW為增量擴展產能提供了過渡途徑。由於模組化已成為多個市政當局競標的標準,微生物燃料電池的市場基礎正從利基試點項目擴展到主流採購清單。
區域分析
亞太地區預計到2024年將佔全球銷售額的45.1%,並以6.9%的複合年成長率快速成長,主要得益於中國石墨烯供應鏈、印度低成本陶罐原型以及日本農業感測器先導計畫。儘管外匯波動,但該地區的工業廢水以及碳中和政策正在建立一個永續的專案儲備。因此,在這個擁有全球大部分電子組裝和食品加工能力的地區,微生物燃料電池市場正同時享受需求驅動和成本驅動的雙重成長。
在北美,美國能源局提供資金支持,國防領域的試驗計畫以及創業投資的創投生態系統為生物電化學領域的新創公司提供了扶持。環保非政府組織正日益敦促公共產業升級老舊的污水處理設施,而微生物燃料電池堆則為在遵守排放上限的同時實現可再生能源採購目標提供了一條途徑。加拿大修訂後的廢水法規放寬了過渡期內的許可要求,進一步簡化了領先採用者的採用流程。
由於第2024/3019號指令,歐洲繼續保持其技術領先地位,該指令將淨正能量處理納入法律義務。德國、法國和北歐國家的電力公司正在部署將微生物燃料電池(MFC)模組與厭氧消化器整合的預商業化試點項目,從而擴大了微生物燃料電池市場的參考案例基礎。儘管區域資本支出較高,但透過綠色債務證券和ESG相關債券,資金籌措成本正在降低,從而抵消了與亞洲建設相比的初始投資差異。
其他好處:
- Excel格式的市場預測(ME)表
- 3個月的分析師支持
目錄
第1章:引言
- 研究假設和市場定義
- 調查範圍
第2章:調查方法
第3章執行摘要
第4章 市場狀況
- 市場概覽
- 市場促進因素
- 從2025年起,研發資金將大幅成長
- 更嚴格的全球廢水標準
- 對離網式、低功耗感測器的需求
- 食品飲料廠廢水發電的能源服務公司(ESCO)合約
- 中國石墨烯負極材料價格下降
- 國防部津貼自主型遠程生物感測器
- 市場限制因素
- 低功率密度技術與替代技術的比較
- 高資本投入與傳統加工方法的比較
- 鹽水污水中陰極的生物污染
- 無鉑族金屬催化劑壽命短
- 供應鏈分析
- 監理情勢
- 技術展望
- 波特五力模型
第5章 市場規模與成長預測
- 按類型
- 基於中介者的 MFC
- 無中介體的MFC
- 有意為之
- 單室
- 雙腔體
- 可堆疊模組化
- 透過電極材料
- 碳布/氈
- 石墨烯和複合材料
- 金屬(不銹鋼、鈦)
- 新型生物衍生
- 基板原料
- 都市污水/工業污水
- 農業徑流
- 海洋沉積物
- 透過使用
- 污水處理與能源回收
- 發電(適用於偏遠地區/可攜式用途)
- 生物感測器和環境監測
- 其他
- 最終用戶
- 產業
- 地方政府
- 商業和住宅
- 研究機構
- 按地區
- 北美洲
- 美國
- 加拿大
- 墨西哥
- 歐洲
- 德國
- 英國
- 法國
- 義大利
- 北歐國家
- 俄羅斯
- 其他歐洲國家
- 亞太地區
- 中國
- 印度
- 日本
- 韓國
- 東南亞國協
- 其他亞太國家
- 南美洲
- 巴西
- 阿根廷
- 其他南美國家
- 中東和非洲
- 沙烏地阿拉伯
- 阿拉伯聯合大公國
- 南非
- 埃及
- 其他中東和非洲國家
- 北美洲
第6章 競爭情勢
- 市場集中度
- 策略趨勢(併購、聯盟、購電協議)
- 市場佔有率分析(主要公司的市場排名和佔有率)
- 公司簡介
- Cambrian Innovation
- Fluence Corporation
- Aquacycl
- MICROrganic Technologies
- Pilus Energy LLC
- Cascade Clean Energy, Inc.
- Electro-Active Technologies Inc.
- Frontis Energy
- FuturoLEAF
- Kurita Water Industries Ltd
- Sainergy Tech, Inc.
- Novozymes A/S
第7章 市場機會與未來展望
According to Mordor Intelligence, the microbial fuel cell market size is estimated at USD 230.92 million in 2025, and is expected to reach USD 295.84 million by 2030, at a CAGR of 5.08% during the forecast period (2025-2030).
This report is Segmented by Type (Mediator-Based MFC and Mediator-Free MFC), Design (Single-Chamber, and More), Electrode Material (Carbon Cloth/Felt, and More), Substrate Source (Municipal Wastewater/Industrial Effluents, and More), Application (Wastewater Treatment and Energy Recovery, and More), End-User (Industrial, Research Institutions, and More), and Geography (North America, Asia-Pacific, and More)
Global Microbial Fuel Cell Market Trends and Insights
R&D Funding Surge Post-2025
Robust federal and multilateral grant programs channel resources into the microbial fuel cell market, including the U.S. Department of Energy's USD 46 million hydrogen and fuel-cell call. These funds accelerate electrode material discovery, microbial community engineering, and stack integration trials that address lingering power density gaps. Universities coordinate translational projects with utilities to validate pilot rigs on real wastewater, compressing proof-of-concept timelines. Parallel EU initiatives under Horizon Europe earmark funds for circular-economy water projects, anchoring collaborative test beds in Germany, Spain, and the Netherlands. Therefore, the convergence of academic expertise and utility-scale pilots underwrites a rapid feedback loop that speeds commercial readiness.
Tightening Global Wastewater-Discharge Norms
The European Union's Directive 2024/3019 obliges municipal plants to recover energy from wastewater, explicitly referencing bioelectrochemical solutions. Similar provisions in revised Canadian effluent rules grant transitional approvals to facilities installing advanced treatment units. These mandates establish a predictable compliance pathway for operators that select microbial fuel cell reactors, since simultaneous COD removal and electricity output help offset penalty fees. Regulatory certainty also influences lender risk models, allowing project-finance structures to carry longer tenors that reduce annual debt service and broaden adoption potential across mid-tier municipalities.
Low Power Density Versus Alternatives
Average industrial-scale prototypes rarely exceed 200 mW/m2, which limits addressable loads to sensing and supplemental energy recovery. As reactor footprints grow, internal resistance and bio-fouling depress performance, creating a mismatch between land constraints and output expectations. Researchers target hierarchical porous structures and synthetic consortia to raise electron transfer rates, but commercial tipping points will likely require at least a 3-fold jump. Until then, power economics restricts adoption to niche zones where heat, solar, or grid power are infeasible.
Other drivers and restraints analyzed in the detailed report include:
- Demand for Off-Grid Micro-Power Sensors
- Falling Graphene-Anode Prices from China
- High Capex vs. Conventional Treatment
For complete list of drivers and restraints, kindly check the Table Of Contents.
Segment Analysis
Mediator-free architectures delivered 60.9% of 2024 revenue, equal to USD 133.5 million of the microbial fuel cell market size, thanks to direct electron transfer that eliminates costly redox chemicals. These reactors appeal to operators prioritizing simple maintenance schedules and low consumables inventory. Growth will follow improvements in biofilm management and surface functionalization that further elevate coulombic efficiencies. Simultaneously, the mediator-based cohort, valued at USD 86.7 million, offers upside because next-generation polymeric mediators withstand higher current densities without toxicity drift, supporting a 5.6% CAGR.
The microbial fuel cell market benefits from this two-track evolution because risk-averse users select proven mediator-free rigs, whereas performance-oriented labs trial mediator-enhanced stacks to breach higher power ceilings. Technology vendors, therefore, hedge portfolios across both styles, ensuring continuing knowledge transfer between segments and preserving revenue resilience against unforeseen performance setbacks.
Single-chamber reactors captured 59.8% of revenue in 2024 by offering plug-and-play installation and minimal gasket management, translating to lower downtime in harsh industrial settings. Yet the modular stack format, presently only USD 29.4 million, is accelerating at an 8.5% CAGR as utilities demand scalable blocks that match fluctuating influent loads without civil-works overhauls. This design also mitigates channel clogging risk by isolating failure to one cassette, protecting plant uptime.
Manufacturers now pre-assemble stackable skid units in ISO-container footprints, enabling rapid brownfield retrofits and providing a migration path for plants to expand capacity in 50 kW increments. With several municipal bids specifying modularity as a tender criterion, the microbial fuel cell market base broadens from niche pilots to mainstream procurement checklists.
Complete Report Scope:
- By Type
- Mediator-Based MFC
- Mediator-Free MFC
- By Design
- Single-Chamber
- Dual-Chamber
- Stackable Modular
- By Electrode Material
- Carbon Cloth/Felt
- Graphene and Composites
- Metal-Based (SS, Ti)
- Novel Bio-derived
- By Substrate Source
- Municipal Wastewater/Industrial Effluents
- Agricultural Run-off
- Marine Sediments
- By Application
- Wastewater Treatment and Energy Recovery
- Power Generation (Remote/Portable)
- Biosensors and Environmental Monitoring
- Others
- By End-User
- Industrial
- Municipal Utilities
- Commercial and Residential
- Research Institutions
- By Geography
- North America
- United States
- Canada
- Mexico
- Europe
- Germany
- United Kingdom
- France
- Italy
- NORDIC Countries
- Russia
- Rest of Europe
- Asia-Pacific
- China
- India
- Japan
- South Korea
- ASEAN Countries
- Rest of Asia-Pacific
- South America
- Brazil
- Argentina
- Rest of South America
- Middle East and Africa
- Saudi Arabia
- United Arab Emirates
- South Africa
- Egypt
- Rest of Middle East and Africa
- North America
Geography Analysis
Asia-Pacific commanded 45.1% of 2024 revenue and is advancing at a 6.9% CAGR, powered by China's graphene supply chain, India's low-cost earthen-pot prototypes, and Japan's agricultural sensor pilots. Regional industrial wastewater volume and policy mandates for carbon neutrality create sustained project pipelines despite currency fluctuations. Therefore, the microbial fuel cell market enjoys both demand-side pull and cost-side push in the zone that houses much of the world's electronics assembly and food-processing capacity.
North America follows, buoyed by Department of Energy funding streams, defense pilot programs, and a robust venture-capital ecosystem that nurtures bioelectrochemical start-ups. Environmental NGOs increasingly pressure utilities to upgrade aging plants, and microbial fuel cell stacks offer a pathway to meet renewable-energy procurement targets while complying with discharge caps. Canadian effluent-rule amendments provide transitional permit relief, further greasing deployment rails for early movers.
Thanks to Directive 2024/3019, Europe remains technology-forward, which embeds energy-positive treatment as a legal obligation. Utilities in Germany, France, and the Nordics run pre-commercial pilots integrating MFC modules with anaerobic digesters, thereby widening the microbial fuel cell market's reference base. Although regional capex is higher, green debt instruments and ESG-linked bonds lower financing costs, offsetting initial expenditure gaps relative to Asian builds.
- Cambrian Innovation
- Fluence Corporation
- Aquacycl
- MICROrganic Technologies
- Pilus Energy LLC
- Cascade Clean Energy, Inc.
- Electro-Active Technologies Inc.
- Frontis Energy
- FuturoLEAF
- Kurita Water Industries Ltd
- Sainergy Tech, Inc.
- Novozymes A/S
Additional Benefits:
- The market estimate (ME) sheet in Excel format
- 3 months of analyst support
TABLE OF CONTENTS
1 Introduction
- 1.1 Study Assumptions & Market Definition
- 1.2 Scope of the Study
2 Research Methodology
3 Executive Summary
4 Market Landscape
- 4.1 Market Overview
- 4.2 Market Drivers
- 4.2.1 R&D funding surge post-2025
- 4.2.2 Tightening global wastewater-discharge norms
- 4.2.3 Demand for off-grid micro-power sensors
- 4.2.4 ESCO contracts for effluent-to-power in F&B plants
- 4.2.5 Falling graphene-anode prices from China
- 4.2.6 Defence grants for self-powered remote biosensors
- 4.3 Market Restraints
- 4.3.1 Low power density versus alternatives
- 4.3.2 High capex vs. conventional treatment
- 4.3.3 Cathode bio-fouling in saline waste streams
- 4.3.4 Limited life of PGM-free catalysts
- 4.4 Supply-Chain Analysis
- 4.5 Regulatory Landscape
- 4.6 Technological Outlook
- 4.7 Porter's Five Forces
- 4.7.1 Threat of New Entrants
- 4.7.2 Bargaining Power of Buyers
- 4.7.3 Bargaining Power of Suppliers
- 4.7.4 Threat of Substitutes
- 4.7.5 Competitive Rivalry
5 Market Size & Growth Forecasts
- 5.1 By Type
- 5.1.1 Mediator-Based MFC
- 5.1.2 Mediator-Free MFC
- 5.2 By Design
- 5.2.1 Single-Chamber
- 5.2.2 Dual-Chamber
- 5.2.3 Stackable Modular
- 5.3 By Electrode Material
- 5.3.1 Carbon Cloth/Felt
- 5.3.2 Graphene and Composites
- 5.3.3 Metal-Based (SS, Ti)
- 5.3.4 Novel Bio-derived
- 5.4 By Substrate Source
- 5.4.1 Municipal Wastewater/Industrial Effluents
- 5.4.2 Agricultural Run-off
- 5.4.3 Marine Sediments
- 5.5 By Application
- 5.5.1 Wastewater Treatment and Energy Recovery
- 5.5.2 Power Generation (Remote/Portable)
- 5.5.3 Biosensors and Environmental Monitoring
- 5.5.4 Others
- 5.6 By End-User
- 5.6.1 Industrial
- 5.6.2 Municipal Utilities
- 5.6.3 Commercial and Residential
- 5.6.4 Research Institutions
- 5.7 By Geography
- 5.7.1 North America
- 5.7.1.1 United States
- 5.7.1.2 Canada
- 5.7.1.3 Mexico
- 5.7.2 Europe
- 5.7.2.1 Germany
- 5.7.2.2 United Kingdom
- 5.7.2.3 France
- 5.7.2.4 Italy
- 5.7.2.5 NORDIC Countries
- 5.7.2.6 Russia
- 5.7.2.7 Rest of Europe
- 5.7.3 Asia-Pacific
- 5.7.3.1 China
- 5.7.3.2 India
- 5.7.3.3 Japan
- 5.7.3.4 South Korea
- 5.7.3.5 ASEAN Countries
- 5.7.3.6 Rest of Asia-Pacific
- 5.7.4 South America
- 5.7.4.1 Brazil
- 5.7.4.2 Argentina
- 5.7.4.3 Rest of South America
- 5.7.5 Middle East and Africa
- 5.7.5.1 Saudi Arabia
- 5.7.5.2 United Arab Emirates
- 5.7.5.3 South Africa
- 5.7.5.4 Egypt
- 5.7.5.5 Rest of Middle East and Africa
- 5.7.1 North America
6 Competitive Landscape
- 6.1 Market Concentration
- 6.2 Strategic Moves (M&A, Partnerships, PPAs)
- 6.3 Market Share Analysis (Market Rank/Share for key companies)
- 6.4 Company Profiles (includes Global level Overview, Market level overview, Core Segments, Financials as available, Strategic Information, Products & Services, and Recent Developments)
- 6.4.1 Cambrian Innovation
- 6.4.2 Fluence Corporation
- 6.4.3 Aquacycl
- 6.4.4 MICROrganic Technologies
- 6.4.5 Pilus Energy LLC
- 6.4.6 Cascade Clean Energy, Inc.
- 6.4.7 Electro-Active Technologies Inc.
- 6.4.8 Frontis Energy
- 6.4.9 FuturoLEAF
- 6.4.10 Kurita Water Industries Ltd
- 6.4.11 Sainergy Tech, Inc.
- 6.4.12 Novozymes A/S
7 Market Opportunities & Future Outlook
- 7.1 White-space & Unmet-Need Assessment

 微生物燃料電池市場:按組件、所用微生物、反應類型、設計配置、應用和最終用戶分類-2026-2032年全球市場預測
 微生物燃料電池市場分析及預測(至2035年):按類型、產品類型、技術、組件、應用、材料類型、設備、製程及最終用戶分類
 微生物燃料電池市場規模、佔有率和成長分析(按電壓、安裝類型、最終用戶和地區分類)-2026年至2033年產業預測
 微生物燃料電池的全球市場(~2035年):各燃料電池類型,各用途類型,各終端用戶,各類型企業,各地區,產業趨勢,預測
 全球微生物燃料電池市場先進微生物燃料電池市場分析及預測(截至 2033 年),按類型、產品、技術、組件、應用、材料類型、製程、最終用戶和功能分類細菌燃料電池市場分析及預測至 2033 年:依類型、產品、技術、組件、應用、材料類型、最終用戶、功能及安裝類型
 微生物燃料電池市場規模、佔有率、趨勢分析報告:按類型、應用、地區、細分市場預測,2024-2030 年