


 |
市場調查報告書
商品編碼
2097329
能源相關工程服務外包 (ESO):市場佔有率分析、產業趨勢與統計、成長預測 (2026-2031)Energy Engineering Services Outsourcing (ESO) - Market Share Analysis, Industry Trends & Statistics, Growth Forecasts (2026 - 2031) |
||||||

※ 本網頁內容可能與最新版本有所差異。詳細情況請與我們聯繫。
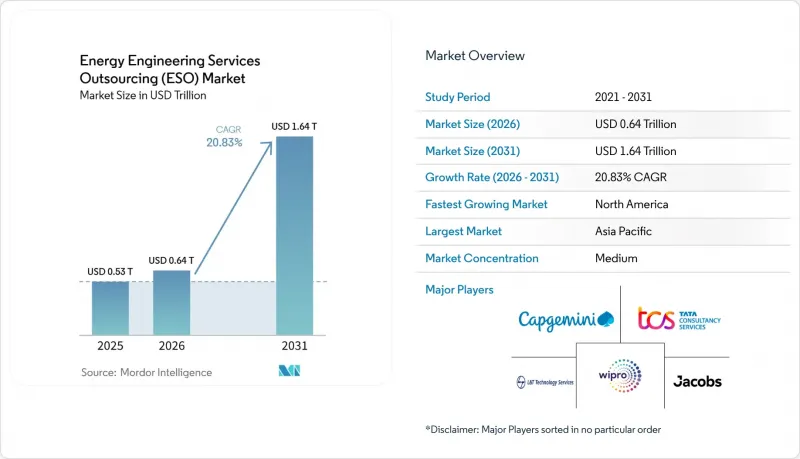
根據 Mordor Intelligence 預測,能源相關的工程服務外包 (ESO) 市場規模將從 2025 年的 5,300 億美元成長到 2026 年的 6,400 億美元,然後在 2031 年達到 1.64 兆美元,2026 年至 2031 年的複合年成長率為 20.20. 203%。
本報告按服務類型(結構/佈局、數位化等)、部署方式(境內、境外)、採購模式(專屬式外包、第三方外包)、能源來源(可再生能源等)以及地區(北美、歐洲、亞太、南美、中東和非洲)進行細分。市場預測以美元計價。
全球能源相關工程服務外包 (ESO) 市場趨勢與分析
強制性脫碳使可再生能源的整合變得更加複雜。
具有約束力的氣候變遷立法,例如歐盟的「Fit for 55」一攬子計畫和美國的《通貨膨脹削減法案》,要求電力業者在限定時間內將大量間歇性可再生能源併入電網。電網營運商缺乏電力電子建模、諧波管理和混合儲能系統設計方面的內部技能,導致越來越多的營運商將逆變器規格、動態線路額定值策略和先進能源管理演算法的協同設計外包給專業的工程合作夥伴。此外,在保持可靠性指標的同時維修老舊變電站也加劇了這種複雜性。目前,外包服務供應商提供一站式解決方案,將電網規範合規性、保護設計和試運行服務打包在一起,以加快專案核准速度並降低進度風險。在2030年淨零排放目標的推動下,數十億美元的電網加固和彈性電源的增加,使得這一成熟市場的需求最為旺盛。
成本壓力正在加速透過外包提高營運效率。
人事費用差異仍是推動能源領域工程服務外包 (ESO) 市場發展的主要因素。到 2025 年,印度將擁有 77 個專注於能源產業的全球產能中心,僱用約 5 萬名專業人員。光是雪佛龍在班加羅爾投資 10 億美元的專案就計劃額外招募 600 名工程師,專門從事上游資產的前端設計。由於休士頓同等職位的薪資是印度的三倍,營運商可以將國內員工重新部署到策略規劃任務中,而位於不同時區的海外團隊則負責管道等軸測圖、迴路圖和工程量計算。到 2025 年,殼牌在印度的員工人數將超過 1.3 萬人,為液化天然氣(LNG接收站提供工程和數位化支援服務,從而縮短週期時間並提高獲利能力。儘管離職率仍然是一個挑戰,但遠端工具、標準化設計庫和自動化品質檢查正在幫助控制單位成本,以應對不斷上漲的薪資通膨。
網路安全問題限制了關鍵基礎設施的外包。
2024 年版的 NIST SP 800-82 提高了工業控制系統的安全標準,並收緊了對第三方存取的監管。如今,公共產業正在進行更嚴格的供應商風險評估,涵蓋供應鏈可追溯性、零信任架構以及軟體材料清單(BOM) 的揭露。對於旨在最大限度減少可再生能源輸出削減和電壓穿越合規性的複雜控制演算法而言,知識產權洩漏的擔憂尤其突出。一些關鍵國家基礎設施所有者要求設立國內工程中心,即使成本增加 25% 至 30%,這也導致合約簽署延遲,並限制了供應商的選擇。遵守 NERC CIP、ISO 27001 和當地隱私法規增加了交易成本,並減緩了跨境文件共享的速度,尤其是在多重雲端託管模式下。
細分市場分析
預計2026年至2031年間,與數位化相關的訂單將以25.6%的複合年成長率成長,超過整體能源工程服務外包(ESO)市場的成長速度。 2025年,「結構設計和佈局」佔銷售額的33.3%,推動了市場成長,因為液化天然氣工廠、海上平台和公用事業規模的太陽能發電廠都需要先進的3D建模和場地規劃最佳化。數位化正在將雲端協作、衍生設計和預測分析融入這些傳統服務領域,從而縮短變更指令週期並降低安裝成本。例如,西門子的數位孿生技術在製造前避免了15%的潛在干擾。塔塔諮詢服務公司(TCS)透過將智慧電錶資料集整合到人工智慧模型中,也幫助客戶節省了數億美元的電網升級成本。因此,與數位化相關的能源工程服務外包(ESO)市場規模預計在2029年與傳統繪圖工作的收入相媲美。隨著客戶對更快迭代和更少返工的需求增加,市場佔有率指標將繼續轉移到軟體密集型工作領域。
當專案開發商需要進行可行性研究或選擇新材料時,研發和設計服務將受益匪淺。然而,這些服務仰賴資深人才的稀缺,且其成長速度略低於數位化相關業務的成長。部署和維護活動根據已安裝資產規模進行規模化,並提供穩定的收入來源,但其成長速度相對較慢。環境和退役服務是現有業務組合的補充,由於排放法規日益嚴格,需求正在不斷成長。在所有這些業務領域,面向能源的工程服務外包 (ESO) 市場動態有利於那些能夠將專業工程師和資料科學家相結合,從而縮短從概念模型到執行流程的供應商。
預計到2031年,離岸風電產業將以22.7%的複合年成長率成長,超過陸域風電產業(2025年陸上風電支出佔總支出的61.1%) 。浮動式風力發電渦輪機、海底高壓直流換流器以及水深超過200公尺的深海石油回接專案分別需要動態建模、錨碇分析和腐蝕調查,這些都足以證明其高收費的合理性。 Equinor公司的「Highwind Tampen」風電場在經過大量的定點模擬和動態電纜疲勞測試後,容量係數超過了50%。如果加州、日本和韓國宣布的租賃競標按計畫進行,到2031年,海上能源工程服務外包(ESO)市場規模可能超過6,000億美元。陸上太陽能EPC項目、燃氣聯合循環發電工程和變電站仍然是新興市場極具吸引力的項目,建設規模龐大,但軟體自動化技術的進步正在擠壓其利潤空間。因此,參與企業正在平衡其業務組合。海上專案盈利豐厚,但競標週期長,而陸上專案則能實現運轉率。
區域分析
亞太地區在印度豐富的工程人才、中國不斷擴張的離岸風力發電以及東南亞液化天然氣進口計畫的推動下,預計到2025年將佔全球銷售額的43.4%。以能源為重點的工程服務外包(ESO)市場持續受惠於薪資差距,印度工程師的平均薪資約為美國同等職位的35%。預計到2025年,中國離岸風力發電裝置容量將大幅成長,並規劃到2030年至少達到120吉瓦,這將持續推動對葉片設計和海底電纜鋪設的需求。儘管資料主權法可能會限制一些跨國合作,但馬來西亞和菲律賓的近岸服務中心正在成為西方客戶的替代方案。
受美國聯邦政府津貼推動的可再生能源稅額扣抵、液化天然氣出口終端和氫能中心等因素的驅動,預計到2031年,北美市場將以24.9%的複合年成長率成長。包括Calcasheu Pass 2、Golden Pass LNG和Alaska LNG等項目在內的總資本支出超過700億美元,用於支援多年的工程運作。紐約和加州的離岸風力發電前景極為光明,但租賃暫停和採購成本上升是潛在的風險因素。
儘管歐洲離岸風電計畫需要五到七年的授權流程,但其市場規模依然龐大。 NKT和普睿司曼的電纜訂單凸顯了持續的投資,而德國和丹麥向氫能相容管道的轉型也擴大了下游業務的範圍。資料保護條例要求資料中心必須設在歐盟境內,這促使供應商在歐盟境內建置安全的工程基礎設施。
在中東,大量資金正湧入吉瓦級綠色氫能計畫、太陽能發電與儲能結合的計畫以及新的液化天然氣樞紐。沙烏地阿拉伯的NEOM綠色氫能項目,擁有4吉瓦的可再生能源發電和每日600噸的氫氣生產能力,是目前全球規模最大的外包工程項目之一。
南美洲和非洲雖然業務量不大,但戰略意義重大。巴西石油公司(Petrobras)的鹽層下下海底系統專案和南非的可再生能源競標正在推動這一細分市場的需求,但外匯波動和在地採購義務正在擠壓國際供應商的利潤空間。
其他好處:
- Excel格式的市場預測(ME)表
- 3個月的分析師支持
目錄
第1章:引言
- 市場分析與定義的前提條件
- 分析範圍
第2章 分析方法
第3章執行摘要
第4章 市場狀況
- 市場概覽
- 市場促進因素
- 強制脫碳和引入可再生能源
- 成本壓力和營運效率的需求
- 數位化和工業4.0的引入
- 液化天然氣和天然氣基礎設施的擴建
- 離岸風力發電叢集海底電力電纜設計
- 氫能相容管道維修的需求
- 市場限制因素
- 外包中的網路安全和智慧財產權問題
- 原油價格波動抑制了資本投資。
- 可再生能源細分領域專家短缺
- 地緣政治對資料傳輸的限制
- 供應鏈分析
- 監理情勢
- 技術展望
- 波特五力分析
第5章:預測市場規模與成長率
- 按服務類型
- 結構和佈局
- 數位化
- 研發/設計
- 實施和維護
- 其他服務
- 透過部署方法
- 陸上
- 離岸
- 採購模式(僅限定性分析)
- 專屬式外包
- 第三方外包
- 按能源來源
- 可再生能源
- 不可可再生能源
- 化學處理
- 按地區
- 北美洲
- 美國
- 加拿大
- 墨西哥
- 歐洲
- 德國
- 英國
- 法國
- 義大利
- 北歐國家
- 俄羅斯
- 其他歐洲國家
- 亞太地區
- 中國
- 印度
- 日本
- 韓國
- 東南亞國協
- 其他亞太國家
- 南美洲
- 巴西
- 阿根廷
- 其他南美國家
- 中東和非洲
- 沙烏地阿拉伯
- 阿拉伯聯合大公國
- 南非
- 埃及
- 其他中東和非洲國家
- 北美洲
第6章 競爭情勢
- 市場集中度
- 策略趨勢(併購、聯盟、購電協議)
- 市場佔有率分析(主要公司的市場排名和佔有率)
- 公司簡介
- AECOM
- AFRY AB
- Alten SA
- Altran Technologies SA
- AtkinsRealis Group Inc.
- Black & Veatch Holding Company
- Capgemini SE
- Cyient Limited
- HCL Technologies Limited
- Hitachi Energy Ltd.
- Infosys Limited
- Jacobs Solutions Inc.
- Larsen & Toubro Technology Services Limited(LTTS)
- Ramboll Group A/S
- SNC-Lavalin Group Inc.
- Tata Consultancy Services Limited(TCS)
- Tech Mahindra Limited
- Wipro Limited
- Wood plc
- Worley Limited
第7章 市場機會與未來展望
According to Mordor Intelligence, the energy engineering services outsourcing market size is expected to grow from USD 0.53 trillion in 2025 to USD 0.64 trillion in 2026 and is forecast to reach USD 1.64 trillion by 2031 at 20.83% CAGR over 2026-2031.
This report is Segmented by Service Type (Structuring and Layout, Digitization, and More), Deployment Model (Onshore and Offshore), Sourcing Model (Captive Outsourcing and Third-Party Outsourcing), Energy Source (Renewable, and More), and Geography (North America, Europe, Asia-Pacific, South America, Middle East and Africa). Market Forecasts are Provided in Value (USD).
Global Energy Engineering Services Outsourcing (ESO) Market Trends and Insights
Decarbonization Mandates Drive Renewable Integration Complexity
Binding climate legislation, such as the European Union Fit for 55 package and the United States Inflation Reduction Act, requires utilities to integrate large volumes of intermittent renewables within compressed timelines. As grid operators lack in-house skills in power-electronics modeling, harmonics management, and hybrid storage design, they increasingly contract specialist engineering partners to co-design inverter specifications, dynamic line-rating strategies, and advanced energy-management algorithms. The complexity is magnified by the need to retrofit aging substations while maintaining reliability indices. Outsourcing providers now bundle grid-code compliance, protection studies, and commissioning services, creating a one-stop solution that accelerates project approval and reduces schedule risk. Demand is strongest in mature markets where 2030 net-zero targets trigger multibillion-dollar transmission reinforcements and flexible-resource additions.
Cost Pressures Accelerate Operational Efficiency Through Outsourcing
Labor arbitrage remains a key driver of the energy engineering services outsourcing market. In 2025, India hosted 77 energy-focused global capability centers employing approximately 50,000 professionals. Chevron's USD 1 billion Bengaluru hub alone plans to add 600 engineers focused on front-end design for upstream assets. Comparable roles in Houston can cost three times Indian salaries, allowing operators to redeploy domestic staff toward strategic planning while offshore teams working across time zones handle piping isometrics, loop diagrams, and quantity take-offs. Shell's India workforce exceeded 13,000 in 2025, providing LNG terminal engineering and digital support services that reduce cycle times and support margins. Attrition remains a challenge; however, remote tools, standardized design libraries, and automated quality checks help keep unit costs down even as salary inflation rises.
Cyber-security Concerns Limit Critical Infrastructure Outsourcing
The 2024 revision of NIST SP 800-82 elevated security baselines for industrial control systems and tightened third-party access provisions. Utilities now conduct more stringent vendor risk assessments covering supply chain pedigree, zero-trust architectures, and software bill-of-materials disclosure. Intellectual property leakage concerns are significant in advanced control algorithms that underpin renewable curtailment minimization and voltage-ride-through compliance. Some critical national infrastructure owners require onshore engineering centers even at 25-30% cost premiums, which delays award timelines and limits provider pools. Compliance with NERC CIP, ISO 27001, and regional privacy statutes increases transaction costs and slows cross-border file exchange, particularly for multi-cloud model hosting.
Other drivers and restraints analyzed in the detailed report include:
- Digital Transformation Enables Advanced Engineering Service Models
- LNG Infrastructure Expansion Creates Specialized Engineering Demand
- Oil Price Volatility Constrains Energy CAPEX Investment
For complete list of drivers and restraints, kindly check the Table Of Contents.
Segment Analysis
Digitization bookings are forecast to expand at a 25.6% CAGR between 2026 and 2031, outpacing the overall energy engineering services outsourcing market. In 2025, Structuring and Layout dominated with a 33.3% revenue share, as LNG trains, offshore platforms, and utility-scale solar farms required intensive three-dimensional modeling and plot-plan optimization. Digitization now incorporates cloud collaboration, generative design, and predictive analytics into these traditional scopes, reducing change-order cycles and lowering installed costs. For instance, Siemens digital twins prevented 15% of potential clashes before fabrication, while Tata Consultancy Services integrated smart-meter datasets into AI models that helped defer hundreds of millions of USD in distribution upgrades. The energy engineering services outsourcing market size tied to digitization is therefore on a trajectory to match traditional drafting revenue by 2029. Market share metrics will continue to shift toward software-heavy scopes as owners demand faster iterations and lower rework.
R&D and designing services benefit when project developers require feasibility studies and novel material selection. However, they rely on scarce senior talent, so growth remains just below that of digitization. Implementation and maintenance activities scale with the installed asset base, contributing steady fee streams but at a slower growth rate. Environmental and decommissioning services round out the portfolio and are rising in line with stricter emissions regulations. Across these workstreams, energy engineering services outsourcing market dynamics favor vendors that combine domain engineers with data scientists, shortening the path from conceptual model to execution.
Offshore scopes are projected to grow at a 22.7% CAGR through 2031, outpacing the onshore segment, which accounted for 61.1% of 2025 spending. Floating wind systems in waters deeper than 200 m, subsea HVDC converters, and deepwater oil tie-backs each require hydrodynamic modeling, mooring analysis, and corrosion studies that support rate premiums. Equinor's Hywind Tampen recorded capacity factors above 50%, but only after extensive station-keeping simulations and dynamic-cable fatigue testing. The energy engineering services outsourcing market size for offshore scopes could surpass USD 600 billion by 2031 if announced lease rounds in California, Japan, and South Korea proceed as planned. Onshore solar EPC, gas-fired combined-cycle projects, and substations remain attractive in emerging markets where build-out volumes are high, though margins face pressure from software automation. Energy engineering services outsourcing market participants therefore balance their portfolios: offshore contracts deliver higher profitability but longer bid cycles, while onshore work maintains utilization rates.
Complete Report Scope:
- By Service Type
- Structuring & Layout
- Digitization
- R&D & Designing
- Implementation & Maintenance
- Other Services
- By Deployment Model
- Onshore
- Offshore
- By Sourcing Model (Qualitative Analysis Only)
- Captive Outsourcing
- Third-party Outsourcing
- By Energy Source
- Renewable
- Non-renewable
- Chemical Processing
- By Geography
- North America
- United States
- Canada
- Mexico
- Europe
- Germany
- United Kingdom
- France
- Italy
- NORDIC Countries
- Russia
- Rest of Europe
- Asia-Pacific
- China
- India
- Japan
- South Korea
- ASEAN Countries
- Rest of Asia-Pacific
- South America
- Brazil
- Argentina
- Rest of South America
- Middle East and Africa
- Saudi Arabia
- United Arab Emirates
- South Africa
- Egypt
- Rest of Middle East and Africa
- North America
Geography Analysis
Asia-Pacific accounted for 43.4% of 2025 revenue, supported by India's large engineering talent pool, China's offshore wind expansion, and Southeast Asia's LNG import plans. The energy engineering services outsourcing market continues to benefit from wage differences, with average Indian engineering salaries at approximately 35% of U.S. equivalents. China's offshore capacity increased sharply in 2025 and targets at least 120 GW by 2030, sustaining demand for blade design and subsea cable routing. Data sovereignty laws may limit some cross-border collaboration, though near-shore service centers in Malaysia and the Philippines are emerging as alternatives for Western clients.
North America is projected to grow at a 24.9% CAGR through 2031, driven by renewables tax credits, LNG export terminals, and hydrogen hubs supported by U.S. federal grants. Projects such as Calcasieu Pass 2, Golden Pass LNG, and the Alaska LNG venture collectively exceed USD 70 billion in capital expenditure and support multi-year engineering workstreams. Offshore wind prospects in the New York Bight and California are substantial, though lease moratoriums and procurement cost inflation present risks.
Europe's offshore wind market remains a key segment despite permitting timelines of five to seven years. Cable awards to NKT and Prysmian confirm continued spending, while hydrogen-ready pipeline conversions in Germany and Denmark expand downstream scopes. Data protection regulations require in-region data centers, prompting vendors to establish EU-based secure engineering infrastructure.
The Middle East is directing capital into gigawatt-scale green hydrogen, solar-plus-storage, and new LNG hubs. Saudi Arabia's NEOM Green Hydrogen project, with 4 GW of renewable generation and 600 t/d hydrogen output, is among the largest ongoing outsourced engineering programs globally.
South America and Africa contribute smaller but strategic workloads. Petrobras' pre-salt subsea systems and South Africa's renewables auctions each drive niche demand, though currency volatility and local-content mandates narrow margins for international vendors.
- AECOM
- AFRY AB
- Alten S.A.
- Altran Technologies S.A.
- AtkinsRealis Group Inc.
- Black & Veatch Holding Company
- Capgemini SE
- Cyient Limited
- HCL Technologies Limited
- Hitachi Energy Ltd.
- Infosys Limited
- Jacobs Solutions Inc.
- Larsen & Toubro Technology Services Limited (LTTS)
- Ramboll Group A/S
- SNC-Lavalin Group Inc.
- Tata Consultancy Services Limited (TCS)
- Tech Mahindra Limited
- Wipro Limited
- Wood plc
- Worley Limited
Additional Benefits:
- The market estimate (ME) sheet in Excel format
- 3 months of analyst support
TABLE OF CONTENTS
1 Introduction
- 1.1 Study Assumptions & Market Definition
- 1.2 Scope of the Study
2 Research Methodology
3 Executive Summary
4 Market Landscape
- 4.1 Market Overview
- 4.2 Market Drivers
- 4.2.1 Decarbonization mandates & renewable integration
- 4.2.2 Cost pressure & need for operational efficiency
- 4.2.3 Digitalization & Industry 4.0 adoption
- 4.2.4 Expansion of LNG & gas infrastructure
- 4.2.5 Subsea power-cable engineering for offshore wind clusters
- 4.2.6 Hydrogen-ready pipeline retrofit demand
- 4.3 Market Restraints
- 4.3.1 Cyber-security & IP concerns in outsourcing
- 4.3.2 Oil-price volatility dampening CAPEX
- 4.3.3 Shortage of niche renewable domain experts
- 4.3.4 Geopolitical data-transfer restrictions
- 4.4 Supply-Chain Analysis
- 4.5 Regulatory Landscape
- 4.6 Technological Outlook
- 4.7 Porters Five Forces Analysis
- 4.7.1 Threat of New Entrants
- 4.7.2 Bargaining Power of Buyers
- 4.7.3 Bargaining Power of Suppliers
- 4.7.4 Threat of Substitutes
- 4.7.5 Competitive Rivalry
5 Market Size & Growth Forecasts
- 5.1 By Service Type
- 5.1.1 Structuring & Layout
- 5.1.2 Digitization
- 5.1.3 R&D & Designing
- 5.1.4 Implementation & Maintenance
- 5.1.5 Other Services
- 5.2 By Deployment Model
- 5.2.1 Onshore
- 5.2.2 Offshore
- 5.3 By Sourcing Model (Qualitative Analysis Only)
- 5.3.1 Captive Outsourcing
- 5.3.2 Third-party Outsourcing
- 5.4 By Energy Source
- 5.4.1 Renewable
- 5.4.2 Non-renewable
- 5.4.3 Chemical Processing
- 5.5 By Geography
- 5.5.1 North America
- 5.5.1.1 United States
- 5.5.1.2 Canada
- 5.5.1.3 Mexico
- 5.5.2 Europe
- 5.5.2.1 Germany
- 5.5.2.2 United Kingdom
- 5.5.2.3 France
- 5.5.2.4 Italy
- 5.5.2.5 NORDIC Countries
- 5.5.2.6 Russia
- 5.5.2.7 Rest of Europe
- 5.5.3 Asia-Pacific
- 5.5.3.1 China
- 5.5.3.2 India
- 5.5.3.3 Japan
- 5.5.3.4 South Korea
- 5.5.3.5 ASEAN Countries
- 5.5.3.6 Rest of Asia-Pacific
- 5.5.4 South America
- 5.5.4.1 Brazil
- 5.5.4.2 Argentina
- 5.5.4.3 Rest of South America
- 5.5.5 Middle East and Africa
- 5.5.5.1 Saudi Arabia
- 5.5.5.2 United Arab Emirates
- 5.5.5.3 South Africa
- 5.5.5.4 Egypt
- 5.5.5.5 Rest of Middle East and Africa
- 5.5.1 North America
6 Competitive Landscape
- 6.1 Market Concentration
- 6.2 Strategic Moves (M&A, Partnerships, PPAs)
- 6.3 Market Share Analysis (Market Rank/Share for key companies)
- 6.4 Company Profiles (includes Global level Overview, Market level overview, Core Segments, Financials as available, Strategic Information, Products & Services, and Recent Developments)
- 6.4.1 AECOM
- 6.4.2 AFRY AB
- 6.4.3 Alten S.A.
- 6.4.4 Altran Technologies S.A.
- 6.4.5 AtkinsRealis Group Inc.
- 6.4.6 Black & Veatch Holding Company
- 6.4.7 Capgemini SE
- 6.4.8 Cyient Limited
- 6.4.9 HCL Technologies Limited
- 6.4.10 Hitachi Energy Ltd.
- 6.4.11 Infosys Limited
- 6.4.12 Jacobs Solutions Inc.
- 6.4.13 Larsen & Toubro Technology Services Limited (LTTS)
- 6.4.14 Ramboll Group A/S
- 6.4.15 SNC-Lavalin Group Inc.
- 6.4.16 Tata Consultancy Services Limited (TCS)
- 6.4.17 Tech Mahindra Limited
- 6.4.18 Wipro Limited
- 6.4.19 Wood plc
- 6.4.20 Worley Limited
7 Market Opportunities & Future Outlook
- 7.1 White-Space & Unmet-Need Assessment

 遊戲原型製作服務市場:全球市場預測,2026-2032年供應鏈外包服務市場:全球市場預測,2026-2032年UI設計服務市場:全球市場預測,2026-2032年
 全球保險管理市場報告(2026 年)
 2026-2030年全球資料輸入外包服務市場
 一般行政服務外包市場報告:按類型、應用和地區分類(2026-2034 年)遊戲外包服務市場:2026年至2032年全球預測(依服務類型、外包形式、開發階段、最終用戶、遊戲類型、平台和獲利模式分類)2026年全球審核服務供應商市場報告
 全球外包服務市場規模、佔有率、趨勢和成長分析報告(2026-2034)全球技術支援外包市場規模、佔有率、趨勢和成長分析報告(2026-2034)