


 |
市場調查報告書
商品編碼
2097315
第二代生質燃料:市場佔有率分析、產業趨勢與統計及成長預測(2025-2030 年)Second Generation Biofuels - Market Share Analysis, Industry Trends & Statistics, Growth Forecasts (2025 - 2030) |
||||||

※ 本網頁內容可能與最新版本有所差異。詳細情況請與我們聯繫。
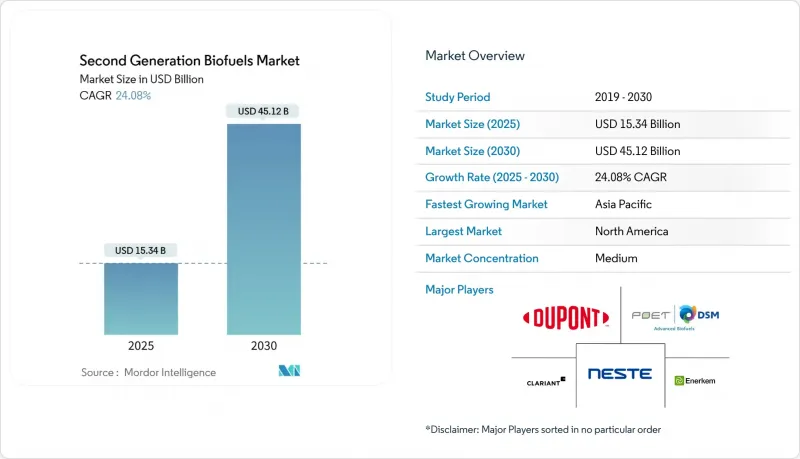
據 Mordor Intelligence 稱,2025 年第二代生質燃料的市場規模估計為 153.4 億美元,預計在預測期(2025-2030 年)內將以 24.08% 的複合年成長率成長,到 2030 年達到 451.2 億美元。
本報告按原料(木質纖維素生質能、農業殘餘物、林業殘餘物等)、燃料類型(纖維素乙醇、生物柴油、可再生柴油、生物丁醇、永續航空燃料等)、最終用途(道路運輸、航空、航運、工業/電力)和地區(北美、歐洲、亞太、南美、中東和非洲)進行分類。
全球第二代生質燃料市場趨勢及洞察
政府指令和混合比例目標
歐盟、英國、日本和新加坡的法規設定了嚴格的摻混門檻,排除了間接土地利用變化(ILUC)高的原料,從而消除了需求的不確定性。對先進分子進行雙重累計提高了價格實現率,並鼓勵了資本投資。這些強制措施加起來將超過每年1500萬噸,幾乎相當於2024年全球產量的一半。這些機制也有助於在碳市場累積碳權額度,擴大專案的內部收益率(IRR)空間。生產商優先考慮那些貸款機構為合規時間表明確的市場提供較低風險溢價的司法管轄區。隨著亞洲和西方政策的協調一致,第二代生質燃料市場首次實現了全球統一標準。
促進航空業脫碳(永續航空燃料需求)
到2030年,航空公司已簽署超過600億加侖的具有約束力的起飛協議。儘管目前永續航空燃料(SAF)的成本是化石噴射機燃料的兩到四倍,但航空公司為了優先確保在強制要求綠色燃料配額的機場獲得起降時刻,願意接受更高的價格。歐盟再生能源組織ReFuelEU已將綠色燃料配額要求提高到2050年的63%,確立了長期發展前景。光是美國聯合航空公司就簽署了一份15億加侖的契約,推動了一系列項目的資金籌措投入。這些承諾正在將SAF從一項單純的ESG(環境、社會和治理)計劃轉變為一項合規要求,從根本上改變了資本流向第二代生質燃料市場的格局。
纖維素生物煉製廠的高資本支出(CAPEX)和規模化風險。
新建工廠的成本在2億至3億美元之間,而像美國生物能源公司位於待開發區德克薩斯州的大型企劃(耗資28億美元)這樣的項目在資金籌措方面面臨著重重障礙。貸款方要求預留20%至30%的資金,以應對酵素的差異性和原料的不均勻性。因此,投資往往局限於大型石油公司,從而削弱了競爭的多樣性。
細分市場分析
預計到2024年,第二代木質纖維素生質燃料的市場規模將達到60.4億美元,佔總營收的39.4%。由於殘渣供應充足、預處理技術成熟以及接近性位置產區,該領域仍保持強勁勢頭。然而,玉米秸稈和麥秸的季節性集中供應需要大規模儲料倉,從而推高了資本投資。林業廢棄物提供了全年可用的替代方案,但需要木片物流解決方案,這將增加每噸5-7美元的成本。在歐盟,都市固體廢棄物正逐漸成為一種可靠的原料來源,政策的放寬使得4,400萬噸都市固態廢棄物可用於燃料生產。
儘管藻類的供應基礎遠小於其他殘渣,但其複合年成長率仍高達33.4%,並預計在2025年後超越所有其他殘渣類別。合成生物學的進步使脂質產量提高了兩倍,而閉迴路光反應器的引入則將所需土地面積減少到開迴路池塘的十分之一。在新加坡和阿拉伯聯合大公國,政府已推出國家獎勵,為海水藻類養殖場提供高達30%的資本投資補貼,縮小了與殘渣處理路線的成本差距。因此,能夠靈活利用多種原料的系統正受到廣泛關注,成為煉油商規避採購風險、應對未來碳排放評分差異和認證審核的有效途徑。
區域分析
北美以40.2%的市佔率位居榜首,這主要得益於美國的可再生燃料標準(RFS)和每加侖1.01美元的纖維素燃料補貼。該地區的農業核心地帶遍布密集的殘渣收集點,最大限度地縮短了運輸距離。加拿大的無污染燃料法規進一步刺激了需求,而墨西哥正在推行的強制性措施則開闢了一條從曼尼托巴省到韋拉克魯斯州的連續物流走廊。然而,過去規模化的失敗抑制了投資者的興趣,迫使像Gevo和LanzaTech這樣的創新公司在做出最終投資決定之前,必須先獲得政府擔保貸款。
亞太地區複合年成長率最高,達29.8%,預計到2030年,其銷量將與北美地區基本持平。日本10%的永續航空燃料(SAF)強制使用率、新加坡1%的生質燃料強制使用率以及中國5萬噸的年產量目標,都為此政策框架提供了支撐。從印尼的空棕櫚油果串到印度的稻草,原料的多樣性降低了供應風險。韓國和馬來西亞的主要煉油廠正積極將加氫裂解裝置改造為氫化植物油(HVO)生產裝置,這項措施得益於較低的人事費用和建設成本,與歐美相比,資本支出可減少15%至20%。
歐洲雖然已有相關法規,但不確定性依然存在。儘管「RED III」指令已將先進生質燃料的配額提高至5.5%,但針對亞洲進口產品的反傾銷調查可能會扭曲價格訊號,並促使國內廢棄物利用途徑推廣。碳價超過每噸80歐元正在提升計畫的經濟可行性,瑞典的生物能源碳捕獲與封存(BECCS)試點計畫已展現出90%的回收效率以及穩定的製程收率。然而,由於本地原料來源有限,除非都市固體廢棄物回收的轉型速度加快,否則歐洲仍將繼續依賴跨國供應。
其他好處:
- Excel格式的市場預測(ME)表
- 3個月的分析師支持
目錄
第1章:引言
- 研究假設和市場定義
- 調查範圍
第2章:調查方法
第3章執行摘要
第4章 市場狀況
- 市場概覽
- 市場促進因素
- 政府指令和混合目標
- 推動航空業脫碳(對永續航空燃料的需求)
- 透過酵素和預處理技術的進步降低成本
- 豐富的木質纖維素殘渣
- 與生物能源碳捕獲和利用系統相關的信貸收入的出現
- 合成生物學顯著提高了脂質生產率
- 市場限制因素
- 纖維素基生物煉製廠存在高額資本投資和規模風險。
- 原料供應物流的去中心化
- 商業化進展緩慢正在削弱投資者信心。
- 歐盟亞洲氫化植物油進口的貿易調查
- 供應鏈分析
- 監理情勢
- 技術展望
- 波特五力分析
- 價格趨勢分析
第5章 市場規模與成長預測
- 按原料
- 木質纖維素生質能
- 農業殘餘物
- 林業剩餘物
- 藻類
- 都市固態廢棄物
- 按燃料類型
- 纖維素基乙醇
- 生質柴油(FAME)
- 可再生柴油(HVO)
- 生質柴油
- 生物丁醇
- 永續航空燃料(ATJ、HEFA)
- 按最終用途
- 道路運輸
- 航空
- 海上
- 工業與電力
- 按地區
- 北美洲
- 美國
- 加拿大
- 墨西哥
- 歐洲
- 英國
- 德國
- 法國
- 西班牙
- 北歐國家
- 俄羅斯
- 其他歐洲國家
- 亞太地區
- 中國
- 印度
- 日本
- 韓國
- 東南亞國協
- 澳洲和紐西蘭
- 其他亞太國家
- 南美洲
- 巴西
- 阿根廷
- 哥倫比亞
- 其他南美國家
- 中東和非洲
- 阿拉伯聯合大公國
- 沙烏地阿拉伯
- 南非
- 埃及
- 其他中東和非洲國家
- 北美洲
第6章 競爭情勢
- 市場集中度
- 策略趨勢(併購、聯盟、購電協議)
- 市場佔有率分析(主要公司的市場排名和市場佔有率)
- 公司簡介
- Neste Oyj
- POET-DSM Advanced Biofuels
- Abengoa Bioenergy
- Clariant AG
- GranBio
- DuPont Industrial Biosciences
- Enerkem
- Beta Renewables
- INEOS Bio
- Valero/Green Diesel JV
- TotalEnergies
- Gevo Inc.
- Algenol Biofuels
- LanzaTech
- Verbio Vereinigte BioEnergie
- Cosan-Raizen
- Aemetis
- REG-Chevron(Renewable Energy Group)
- Fulcrum BioEnergy
- BP Bunge Bioenergia
第7章 市場機會與未來展望
According to Mordor Intelligence, the second generation biofuels market size is estimated at USD 15.34 billion in 2025, and is expected to reach USD 45.12 billion by 2030, at a CAGR of 24.08% during the forecast period (2025-2030).
This report is Segmented by Feedstock (Lignocellulosic Biomass, Agricultural Residues, Forestry Residues, and More), Fuel Type (Cellulosic Ethanol, Biodiesel, Renewable Diesel, Bio-Butanol, Sustainable Aviation Fuel, and More), End-Use (Road Transportation, Aviation, Marine, and Industrial and Power), and Geography (North America, Europe, Asia-Pacific, South America, and Middle East and Africa).
Global Second Generation Biofuels Market Trends and Insights
Government Mandates & Blending Targets
Regulations in the EU, UK, Japan, and Singapore have removed demand uncertainty by establishing hard blending floors that exclude high-ILUC feedstocks. Doubled counting for advanced molecules lifts price realizations, encouraging capital deployment. Combined mandates exceed 15 million tonnes annually, equivalent to nearly half the 2024 global output. The mechanisms also enable credit stacking with carbon markets, widening project IRR cushions. Producers prioritize jurisdictions with clear compliance timelines because lenders assign lower risk premiums to such markets. The alignment of Asian and Western policies gives the second-generation biofuels market a globally harmonized baseline for the first time.
Decarbonization Push in Aviation (SAF Demand)
Airlines have signed binding offtake deals surpassing 60 billion gallons through 2030. SAF currently commands 2-4x the price of fossil jet fuel, but airlines accept the premium to safeguard slot access at airports imposing green-fuel quotas. ReFuelEU ratchets requirements to 63% by 2050, creating a long visibility window. United Airlines alone has contracted 1.5 billion gallons, catalyzing bankable project pipelines. These commitments redefine SAF from an ESG gesture to a compliance imperative, fundamentally shifting capital flows into the second-generation biofuels market.
High CAPEX & Scale-Up Risk of Cellulosic Biorefineries
Greenfield plants cost USD 200-300 million, with mega projects such as USA BioEnergy's USD 2.8 billion Texas complex raising financing barriers. Lenders demand 20-30% contingency buffers to cover enzyme variability and feedstock heterogeneity. Thus, equity tickets are often restricted to oil majors, reducing competitive diversity.
Other drivers and restraints analyzed in the detailed report include:
- Cost Reductions via Enzyme & Pretreatment Advances
- Abundant Lignocellulosic Residue Availability
- Fragmented Feedstock Supply Logistics
For complete list of drivers and restraints, kindly check the Table Of Contents.
Segment Analysis
The second-generation biofuels market size for lignocellulosic routes is USD 6.04 billion in 2024, equal to 39.4% of overall revenue. Residue accessibility, mature pretreatment know-how, and co-location with grain belts keep the segment resilient, though seasonal bunching of corn stover and wheat straw necessitates large storage silos that push capex upward. Forestry offcuts supply a year-round alternative but require chipped-wood logistics solutions, adding 5-7 USD per ton. Municipal solid waste is becoming a credible EU feedstock after policy relaxation frees 44 million tons for fuel applications.
Algae contributes a much smaller base yet records a 33.4% CAGR, poised to outpace all residue classes from 2025 onward. Synthetic-biology improvements triple lipid productivity, while closed-loop photobioreactors cut land demand to one-tenth of open ponds. Country incentives in Singapore and the UAE now reimburse up to 30% of capex for seawater-based algae farms, narrowing the cost gap with residue routes. Multifeedstock flexibility is therefore emerging as a procurement hedge for refiners that aim to withstand future carbon score differentials and certification audits.
Complete Report Scope:
- By Feedstock
- Lignocellulosic Biomass
- Agricultural Residues
- Forestry Residues
- Algae
- Municipal Solid Waste
- By Fuel Type
- Cellulosic Ethanol
- Biodiesel (FAME)
- Renewable Diesel (HVO)
- Bio-DME
- Bio-Butanol
- Sustainable Aviation Fuel (ATJ, HEFA)
- By End-Use
- Road Transportation
- Aviation
- Marine
- Industrial and Power
- By Geography
- North America
- United States
- Canada
- Mexico
- Europe
- United Kingdom
- Germany
- France
- Spain
- Nordic Countries
- Russia
- Rest of Europe
- Asia-Pacific
- China
- India
- Japan
- South Korea
- ASEAN Countries
- Australia and New Zealand
- Rest of Asia-Pacific
- South America
- Brazil
- Argentina
- Colombia
- Rest of South America
- Middle East and Africa
- United Arab Emirates
- Saudi Arabia
- South Africa
- Egypt
- Rest of Middle East and Africa
- North America
Geography Analysis
North America leads with 40.2% share, strengthened by the U.S. Renewable Fuel Standard and USD 1.01 per gallon cellulosic credit. The region's agricultural heartland provides dense residue catchments that minimize haulage. Clean Fuel Regulations in Canada add incremental pull, while Mexico's nascent mandates open a contiguous logistics corridor from Manitoba to Veracruz. Yet prior scale-up misses temper investor appetites, compelling innovators like Gevo and LanzaTech to lock in sovereign-backed loan guarantees before final investment decisions.
Asia-Pacific exhibits the highest 29.8% CAGR and is expected to almost match North America in revenue by 2030. Japan's 10% SAF rule, Singapore's 1% biofuel obligation, and China's 50,000-ton output target underpin the policy framework. Feedstock diversity, from Indonesian palm empty fruit bunches to Indian rice straw, reduces supply risk. Refining giants in South Korea and Malaysia are aggressively converting hydrocrackers to HVO, a move supported by lower labor and construction costs that trim capex 15-20% relative to Western builds.
Europe maintains a regulated though uncertain setting. RED III boosts the advanced quota to 5.5%, but anti-dumping screens on Asian imports distort price signals, potentially uplifting domestic residue routes. Carbon prices north of EUR 80 per ton improve project economics, and BECCS pilots in Sweden show 90% capture efficiencies with stable process yields. Nevertheless, limited regional feedstock pools keep Europe reliant on cross-border supply unless municipal waste conversion scales faster.
- Neste Oyj
- POET-DSM Advanced Biofuels
- Abengoa Bioenergy
- Clariant AG
- GranBio
- DuPont Industrial Biosciences
- Enerkem
- Beta Renewables
- INEOS Bio
- Valero/Green Diesel JV
- TotalEnergies
- Gevo Inc.
- Algenol Biofuels
- LanzaTech
- Verbio Vereinigte BioEnergie
- Cosan-Raizen
- Aemetis
- REG-Chevron (Renewable Energy Group)
- Fulcrum BioEnergy
- BP Bunge Bioenergia
Additional Benefits:
- The market estimate (ME) sheet in Excel format
- 3 months of analyst support
TABLE OF CONTENTS
1 Introduction
- 1.1 Study Assumptions & Market Definition
- 1.2 Scope of the Study
2 Research Methodology
3 Executive Summary
4 Market Landscape
- 4.1 Market Overview
- 4.2 Market Drivers
- 4.2.1 Government mandates & blending targets
- 4.2.2 Decarbonization push in aviation (SAF demand)
- 4.2.3 Cost reductions via enzyme & pretreatment advances
- 4.2.4 Abundant lignocellulosic residue availability
- 4.2.5 Emergence of BECCS-linked credit revenues
- 4.2.6 Synthetic-biology-driven lipid productivity leaps
- 4.3 Market Restraints
- 4.3.1 High CAPEX & scale-up risk of cellulosic biorefineries
- 4.3.2 Fragmented feedstock supply logistics
- 4.3.3 Slow commercialization track-record dampening investor confidence
- 4.3.4 EU trade probes on Asian HVO imports
- 4.4 Supply-Chain Analysis
- 4.5 Regulatory Landscape
- 4.6 Technological Outlook
- 4.7 Porter's Five Forces Analysis
- 4.7.1 Threat of New Entrants
- 4.7.2 Bargaining Power of Suppliers
- 4.7.3 Bargaining Power of Buyers
- 4.7.4 Threat of Substitutes
- 4.7.5 Competitive Rivalry
- 4.8 Price Trends Analysis
5 Market Size & Growth Forecasts
- 5.1 By Feedstock
- 5.1.1 Lignocellulosic Biomass
- 5.1.2 Agricultural Residues
- 5.1.3 Forestry Residues
- 5.1.4 Algae
- 5.1.5 Municipal Solid Waste
- 5.2 By Fuel Type
- 5.2.1 Cellulosic Ethanol
- 5.2.2 Biodiesel (FAME)
- 5.2.3 Renewable Diesel (HVO)
- 5.2.4 Bio-DME
- 5.2.5 Bio-Butanol
- 5.2.6 Sustainable Aviation Fuel (ATJ, HEFA)
- 5.3 By End-Use
- 5.3.1 Road Transportation
- 5.3.2 Aviation
- 5.3.3 Marine
- 5.3.4 Industrial and Power
- 5.4 By Geography
- 5.4.1 North America
- 5.4.1.1 United States
- 5.4.1.2 Canada
- 5.4.1.3 Mexico
- 5.4.2 Europe
- 5.4.2.1 United Kingdom
- 5.4.2.2 Germany
- 5.4.2.3 France
- 5.4.2.4 Spain
- 5.4.2.5 Nordic Countries
- 5.4.2.6 Russia
- 5.4.2.7 Rest of Europe
- 5.4.3 Asia-Pacific
- 5.4.3.1 China
- 5.4.3.2 India
- 5.4.3.3 Japan
- 5.4.3.4 South Korea
- 5.4.3.5 ASEAN Countries
- 5.4.3.6 Australia and New Zealand
- 5.4.3.7 Rest of Asia-Pacific
- 5.4.4 South America
- 5.4.4.1 Brazil
- 5.4.4.2 Argentina
- 5.4.4.3 Colombia
- 5.4.4.4 Rest of South America
- 5.4.5 Middle East and Africa
- 5.4.5.1 United Arab Emirates
- 5.4.5.2 Saudi Arabia
- 5.4.5.3 South Africa
- 5.4.5.4 Egypt
- 5.4.5.5 Rest of Middle East and Africa
- 5.4.1 North America
6 Competitive Landscape
- 6.1 Market Concentration
- 6.2 Strategic Moves (M&A, Partnerships, PPAs)
- 6.3 Market Share Analysis (Market Rank/Share for key companies)
- 6.4 Company Profiles (includes Global level Overview, Market level overview, Core Segments, Financials as available, Strategic Information, Products & Services, and Recent Developments)
- 6.4.1 Neste Oyj
- 6.4.2 POET-DSM Advanced Biofuels
- 6.4.3 Abengoa Bioenergy
- 6.4.4 Clariant AG
- 6.4.5 GranBio
- 6.4.6 DuPont Industrial Biosciences
- 6.4.7 Enerkem
- 6.4.8 Beta Renewables
- 6.4.9 INEOS Bio
- 6.4.10 Valero/Green Diesel JV
- 6.4.11 TotalEnergies
- 6.4.12 Gevo Inc.
- 6.4.13 Algenol Biofuels
- 6.4.14 LanzaTech
- 6.4.15 Verbio Vereinigte BioEnergie
- 6.4.16 Cosan-Raizen
- 6.4.17 Aemetis
- 6.4.18 REG-Chevron (Renewable Energy Group)
- 6.4.19 Fulcrum BioEnergy
- 6.4.20 BP Bunge Bioenergia
7 Market Opportunities & Future Outlook
- 7.1 White-space & Unmet-Need Assessment


