


 |
市場調查報告書
商品編碼
2097288
人工智慧驅動的儲存:市場佔有率分析、行業趨勢與統計數據以及成長預測(2025-2030 年)AI-powered Storage - Market Share Analysis, Industry Trends & Statistics, Growth Forecasts (2025 - 2030) |
||||||

※ 本網頁內容可能與最新版本有所差異。詳細情況請與我們聯繫。
根據 Mordor Intelligence 預測,人工智慧驅動的儲存市場預計將在 2025 年達到 270.6 億美元,並在 2030 年擴展到 766 億美元,複合年成長率高達 23.13%。
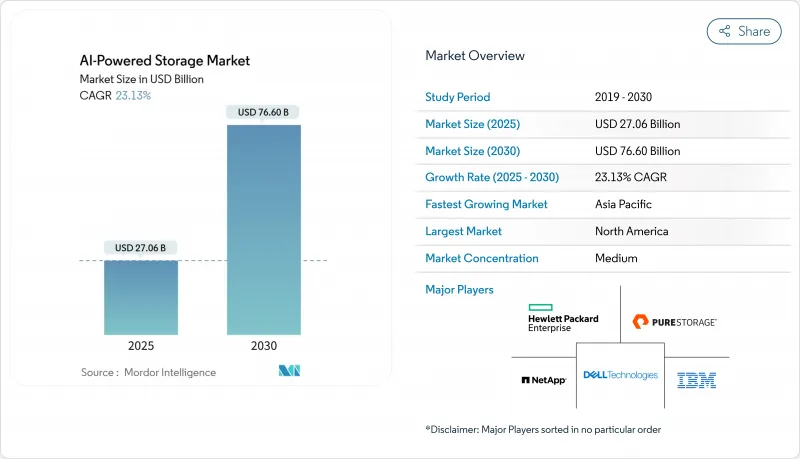
本報告按部署類型(本地部署、雲端部署、混合部署)、儲存架構(全Flash陣列、混合陣列等)、元件(硬體、軟體、服務)、最終用戶產業(IT與電信、銀行、金融服務和保險、醫療保健與生命科學等)以及地區(北美、南美、歐洲、亞太、中東和非洲)進行細分。市場預測以美元計價。
全球人工智慧驅動儲存市場趨勢及洞察
GenAI工作負載的爆炸性成長
隨著Petabyte級訓練資料集和微秒推理服務等級協定(SLA)的出現,儲存I/O已成為人工智慧瓶頸清單中的首要瓶頸。大規模語言模型需要持續的多太Terabit吞吐量,即使未能達到任何一項效能目標,都可能導致訓練週期從幾天延長至幾週。西北大學醫學院在部署戴爾-英偉達GenAI技術堆疊後,放射科工作流程效率提升了40%,技術堆疊將GPU叢集與高速快閃陣列結合。如今,企業將儲存延遲和頻寬視為競爭優勢,並正在為能夠確保GPU持續滿載運作而非閒置的架構進行預算。因此,人工智慧驅動的儲存市場正在蓬勃發展。
企業向本地部署人工智慧的遷移
金融服務、醫療保健和公共部門的機構正在重新啟用本地資料處理,以滿足有關資料主權的監管要求並降低延遲風險。紐約梅隆銀行在其資料中心部署 NVIDIA DGX SuperPOD,顯示受嚴格監管的行業正在將本地運算與高效能 NVMe 架構融合,從而在保持管治的同時實現即時詐欺分析。將敏感資料本地分區並將開發工作負載遷移到雲端的混合策略正在擴大企業級儲存設備的潛在基本客群,進一步推動人工智慧驅動的儲存市場成長。
資料中心的電力和冷卻限制
目前,GPU機架的功耗為40-140千瓦,而傳統伺服器的功耗不到15千瓦。如此高的熱負荷需要對液冷系統維修,並升級電源鏈,導致資本投資成本增加和部署時間延長。儲存陣列必須在這種高密度、高熱負荷的環境中穩定運行,不能出現降頻,這迫使設計人員採用節能的控制器和驅動技術。
細分市場分析
預計到2030年,混合部署的複合年成長率將達到25.70%,凸顯了企業對雲端敏捷性和本地自主性的雙重需求。儘管到2024年,雲端仍將佔據47.60%的收入佔有率,但混合部署正憑藉其「策略預設」的優勢脫穎而出,它允許將對延遲敏感的推理任務部署在更靠近用戶的位置,同時將模型訓練卸載到超大規模資料中心業者。長庚紀念醫院的AIRI部署案例展示瞭如何透過將醫學影像推理處理保留在本地,同時將模型重新訓練卸載到雲端,從而保持合規性和成本效益。人工智慧儲存市場也受益於這種雙站點策略,因為每個站點仍然需要Petabyte級快閃記憶體儲存和GPU最佳化的吞吐量。
管理域的分離也推動了服務需求。企業正在尋求不同環境的統一視覺性、資料複製工作流程和 AI 維運遙測。利用跨站點重複資料刪除和自動分層技術的供應商,透過將傳統上脆弱的資料孤島轉變為策略驅動的資料架構,正在擴大其在 AI 驅動型儲存市場的佔有率。
2024年,全Flash陣列的支出比例將達到40.90%,鞏固了其作為生產級AI叢集基礎架構的地位。同時,隨著企業在分散式網路上追求接近直附件的延遲,NVMe-oF預計將以27.80%的年成長率成長。早期採用者報告稱,從基於TCP的陣列遷移到客製化設計的NVMe-oF架構,使GPU利用率提高了70-80%,並將GenAI訓練週期縮短了數天。與NVMe-oF架構相關的AI儲存市場預計將隨著GPU叢集的日益普及而相應擴張,進一步鞏固其在高階企業預算中的地位。
儘管混合層級和物件層級結構在歸檔和預處理階段仍然發揮作用,但人工智慧批次處理流程正擴大將熱點資料集整合到持久記憶體和 PCIe Gen 5 NVMe 層中。軟體定義方法正受到尋求廠商中立性和快速功能迭代的負責人的青睞。
區域分析
預計到2024年,CoreWeave在北美市場將佔據38.70%的佔有率,這主要歸功於集中在阿什本、聖克拉拉和達拉斯的超大規模資料中心,以及大學和國家實驗室的研究叢集。 CoreWeave斥資90億美元收購Core Scientific,新增1.3吉瓦的GPU加速容量,凸顯了其在該地區佔據主導地位的雄厚資本實力。儘管競爭格局依然激烈但已趨於成熟,各公司都在推行檢驗參考堆棧,並將支出重點從設備本身轉向生命週期管理服務。
亞太地區25.10%的複合年成長率主要得益於中國工業和資訊化部的國家人工智慧戰略、印度的「數位印度2.0」政策以及新加坡的「AI Verify」計畫。國內半導體產業的舉措,例如三星的CXL 2.0 DRAM及其與NAVER的合作,正強化本土主導的供應鏈。各國政府支持在雅加達、胡志明市和海得拉巴等地建設超大規模資料中心,從而迅速催生了對符合資料本地化法規的AI最佳化儲存架構的需求。
歐洲、中東和非洲以及南美洲的人工智慧成熟度因地區而異。在歐洲,發展趨勢主要集中在遵守「人工智慧法律」和強制實施節能資料中心。在中東,政府支持的基金正在資助百億億級項目,其中阿拉伯聯合大公國的目標是投資300億至500億歐元用於人工智慧資料中心資產。在南美洲,通訊業者正在邊緣交換機部署人工智慧推理技術,以改善頻寬分配,這需要緊湊且強大的NVMe陣列。
其他好處:
- Excel格式的市場預測(ME)表
- 3個月的分析師支持
目錄
第1章:引言
- 調查範圍
- 研究假設和市場定義
第2章:調查方法
第3章執行摘要
第4章 市場狀況
- 市場概覽
- 市場促進因素
- GenAI工作負載的爆炸性成長
- 企業向本地部署人工智慧的遷移
- 快閃記憶體/NVMe 的每 GB 價格已經大幅下降。
- 以GPU為中心的伺服器設計
- 主權雲端資料居住規則
- 新興人工智慧資料生命週期平台
- 市場限制因素
- 資料中心的電力和冷卻限制
- AI維運中儲存調優方面的技能差距
- ASIC/加速器廠商鎖定
- 由於快閃記憶體供應波動,資本投資激增。
- 價值鏈分析
- 監理情勢
- 技術展望
- 波特五力分析
第5章 市場規模與成長預測
- 部署模式
- 現場
- 雲
- 混合
- 儲存架構
- 全快閃陣列
- 混合陣列
- 物件儲存
- 軟體定義儲存
- NVMe-oF系統
- 按組件
- 硬體
- 軟體
- 服務
- 按最終用戶行業分類
- 資訊科技/通訊
- BFSI
- 醫療保健和生命科學
- 媒體與娛樂
- 政府/國防
- 其他
- 按地區
- 北美洲
- 美國
- 加拿大
- 墨西哥
- 歐洲
- 英國
- 德國
- 法國
- 義大利
- 其他歐洲國家
- 亞太地區
- 中國
- 日本
- 印度
- 韓國
- 其他亞太國家
- 中東
- 以色列
- 沙烏地阿拉伯
- 阿拉伯聯合大公國
- 土耳其
- 其他中東國家
- 非洲
- 南非
- 埃及
- 其他非洲國家
- 南美洲
- 巴西
- 阿根廷
- 其他南美國家
- 北美洲
第6章 競爭情勢
- 市場集中度
- 策略趨勢
- 市佔率分析
- 公司簡介
- Dell Technologies Inc.
- NetApp, Inc.
- Pure Storage, Inc.
- International Business Machines Corporation
- Hewlett Packard Enterprise Company
- Huawei Technologies Co., Ltd.
- Hitachi Vantara Corporation
- Lenovo Group Limited
- Super Micro Computer, Inc.
- NVIDIA Corporation
- Western Digital Corporation
- Seagate Technology Holdings plc
- Micron Technology, Inc.
- Samsung Electronics Co., Ltd.
- Intel Corporation
- Amazon Web Services, Inc.
- Microsoft Corporation
- Google LLC
- Nutanix, Inc.
- VAST Data, Inc.
- Solidigm Technology LLC
第7章 市場機會與未來展望
According to Mordor Intelligence, the AI-powered storage market size reached USD 27.06 billion in 2025 and is forecast to climb to USD 76.6 billion by 2030, reflecting a strong 23.13% CAGR.
This report is Segmented by Deployment Mode (On-Premises, Cloud, Hybrid), Storage Architecture (All-Flash Arrays, Hybrid Arrays, and More), Component (Hardware, Software, Services), End-User Industry (IT and Telecom, BFSI, Healthcare and Life Sciences, and More), and Geography (North America, South America, Europe, APAC, Middle East and Africa). The Market Forecasts are Provided in Terms of Value (USD).
Global AI-powered Storage Market Trends and Insights
GenAI Workload Explosion
Petabyte-scale training sets and microsecond inference service-level agreements have vaulted storage I/O to the top of the AI bottleneck list. Large language models require sustained multi-terabit throughput, and even a single missed performance target can stretch training cycles from days to weeks. Northwestern Medicine recorded a 40% radiology-workflow uplift after deploying Dell-NVIDIA GenAI stacks that pair GPU clusters with flash-first arrays. Enterprises now treat storage latency and bandwidth as competitive differentiators, dedicating budget to architectures that keep GPUs fully fed rather than idling. As a result, the AI-powered Storage Market is gaining significant momentum.
Enterprise Shift to On-Prem AI
Financial-services, healthcare, and public-sector organizations are reinstating local data processing to satisfy sovereignty mandates and mitigate latency risk. BNY Mellon's adoption of an NVIDIA DGX SuperPOD in its own data center illustrates how regulated industries marry on-prem compute with high-performance NVMe fabrics to enable real-time fraud analytics while preserving governance. Hybrid strategies that shard sensitive data locally and push development workloads to cloud are expanding the addressable base for enterprise-grade storage appliances, further fueling the growth of the AI-powered Storage Market.
Power and Cooling Limits in DCs
GPU racks now draw 40-140 kW versus sub-15 kW for legacy servers. The thermal envelope forces liquid cooling retrofits and power-chain upgrades that inflate capital cost and elongate deployment windows. Storage arrays must coexist in these dense thermodynamic pockets without throttling, compelling designers to embrace energy-efficient controllers and drive technologies.
Other drivers and restraints analyzed in the detailed report include:
- Flash/NVMe USD/GB Free-Fall
- GPU-Centric Server Designs
- Skills Gap in AI-Ops Storage Tuning
For complete list of drivers and restraints, kindly check the Table Of Contents.
Segment Analysis
Hybrid deployments are forecast to post a 25.70% CAGR to 2030, underscoring enterprises' desire to straddle cloud agility and on-prem sovereignty. Although cloud retains 47.60% of 2024 revenue, the ability to pin latency-sensitive inference close to users while off-loading model training to hyperscalers differentiates hybrid as the strategic default. Chang Gung Memorial Hospital's AIRI rollout shows how medical imaging inference remains local while model retraining bursts to cloud, sustaining compliance and cost efficiency. The AI-powered Storage Market benefits from this dual-site strategy because each location still demands petabyte-class flash and GPU-optimized throughput.
Separate management domains also elevate services demand: enterprises seek unified visibility, data-replication workflows, and AI-Ops telemetry across distinct estates. Vendors capitalizing on cross-site deduplication and automated tiering earn share within the AI-powered Storage Market by turning previously brittle silos into policy-driven data fabrics.
All-flash arrays controlled 40.90% of 2024 spending, cementing their role as the baseline for AI production clusters. NVMe-oF, however, is charted to grow 27.80% annually as organizations pursue direct-attached-class latency across distributed networks. Early adopters report 70-80% GPU-utilization gains after migrating from TCP-based arrays to purpose-built NVMe-oF fabrics, shaving days from GenAI training cycles. The AI-powered Storage Market size linked to NVMe-oF architectures is expected to rise proportionally with GPU cluster rollouts, reinforcing its position in premium enterprise budgets.
Hybrid and object tiers retain roles in archival and pre-processing stages, but AI batch pipelines increasingly funnel hot datasets onto persistent-memory or PCIe Gen 5 NVMe layers. Software-defined approaches gain mindshare among operators wanting vendor neutrality and rapid feature iteration.
Complete Report Scope:
- By Deployment Mode
- On-premises
- Cloud
- Hybrid
- By Storage Architecture
- All-flash Arrays
- Hybrid Arrays
- Object Storage
- Software-defined Storage
- NVMe-oF Systems
- By Component
- Hardware
- Software
- Services
- By End-user Industry
- IT and Telecom
- BFSI
- Healthcare and Life Sciences
- Media and Entertainment
- Government and Defense
- Others
- By Geography
- North America
- United States
- Canada
- Mexico
- Europe
- United Kingdom
- Germany
- France
- Italy
- Rest of Europe
- Asia-Pacific
- China
- Japan
- India
- South Korea
- Rest of Asia-Pacific
- Middle East
- Israel
- Saudi Arabia
- United Arab Emirates
- Turkey
- Rest of Middle East
- Africa
- South Africa
- Egypt
- Rest of Africa
- South America
- Brazil
- Argentina
- Rest of South America
- North America
Geography Analysis
North America's 38.70% share in 2024 stems from hyperscale estates concentrated in Ashburn, Santa Clara, and Dallas, alongside research clusters at universities and national labs. CoreWeave's USD 9 billion acquisition of Core Scientific added 1.3 GW of GPU-ready capacity, illustrating the capital scale underpinning regional dominance. Competitive dynamics remain intense but mature, with enterprises standardizing on validated reference stacks and pivoting spend toward lifecycle-management services rather than raw devices.
Asia-Pacific's 25.10% CAGR arises from sovereign-AI strategies declared by China's Ministry of Industry and IT, India's Digital India 2.0 policy, and Singapore's AI Verify programme. Domestic silicon initiatives, such as Samsung's CXL 2.0 DRAM and NAVER collaboration, reinforce the indigenous supply chain. Governments underwrite hyperscale builds in Jakarta, Ho Chi Minh City, and Hyderabad, creating rapid follow-on demand for AI-tuned storage fabrics that respect data-locality statutes.
Europe, the Middle East and Africa, and South America combine heterogeneous maturity profiles. Europe's trajectory revolves around AI Act compliance and energy-efficient data-center mandates. The Middle East bankrolls petascale projects via sovereign wealth funds, with the UAE targeting EUR 30-50 billion in AI data-center assets. South American telecoms deploy AI inference at edge exchanges to improve spectrum allocation, requiring compact, ruggedized NVMe arrays.
- Dell Technologies Inc.
- NetApp, Inc.
- Pure Storage, Inc.
- International Business Machines Corporation
- Hewlett Packard Enterprise Company
- Huawei Technologies Co., Ltd.
- Hitachi Vantara Corporation
- Lenovo Group Limited
- Super Micro Computer, Inc.
- NVIDIA Corporation
- Western Digital Corporation
- Seagate Technology Holdings plc
- Micron Technology, Inc.
- Samsung Electronics Co., Ltd.
- Intel Corporation
- Amazon Web Services, Inc.
- Microsoft Corporation
- Google LLC
- Nutanix, Inc.
- VAST Data, Inc.
- Solidigm Technology LLC
Additional Benefits:
- The market estimate (ME) sheet in Excel format
- 3 months of analyst support
TABLE OF CONTENTS
1 INTRODUCTION
- 1.1 Scope of the Study
- 1.2 Study Assumptions and Market Definition
2 RESEARCH METHODOLOGY
3 EXECUTIVE SUMMARY
4 MARKET LANDSCAPE
- 4.1 Market Overview
- 4.2 Market Drivers
- 4.2.1 GenAI workload explosion
- 4.2.2 Enterprise shift to on-prem AI
- 4.2.3 Flash/NVMe USD/GB free-fall
- 4.2.4 GPU-centric server designs
- 4.2.5 Sovereign-cloud data-residency rules
- 4.2.6 Emerging AI data-lifecycle platforms
- 4.3 Market Restraints
- 4.3.1 Power and cooling limits in DCs
- 4.3.2 Skills gap in AI-Ops storage tuning
- 4.3.3 ASIC/accelerator vendor lock-in
- 4.3.4 Capex spikes from flash supply swings
- 4.4 Value Chain Analysis
- 4.5 Regulatory Landscape
- 4.6 Technological Outlook
- 4.7 Porter's Five Forces Analysis
- 4.7.1 Threat of New Entrants
- 4.7.2 Bargaining Power of Suppliers
- 4.7.3 Bargaining Power of Buyers
- 4.7.4 Threat of Substitutes
- 4.7.5 Competitive Rivalry
5 MARKET SIZE AND GROWTH FORECASTS (VALUE)
- 5.1 By Deployment Mode
- 5.1.1 On-premises
- 5.1.2 Cloud
- 5.1.3 Hybrid
- 5.2 By Storage Architecture
- 5.2.1 All-flash Arrays
- 5.2.2 Hybrid Arrays
- 5.2.3 Object Storage
- 5.2.4 Software-defined Storage
- 5.2.5 NVMe-oF Systems
- 5.3 By Component
- 5.3.1 Hardware
- 5.3.2 Software
- 5.3.3 Services
- 5.4 By End-user Industry
- 5.4.1 IT and Telecom
- 5.4.2 BFSI
- 5.4.3 Healthcare and Life Sciences
- 5.4.4 Media and Entertainment
- 5.4.5 Government and Defense
- 5.4.6 Others
- 5.5 By Geography
- 5.5.1 North America
- 5.5.1.1 United States
- 5.5.1.2 Canada
- 5.5.1.3 Mexico
- 5.5.2 Europe
- 5.5.2.1 United Kingdom
- 5.5.2.2 Germany
- 5.5.2.3 France
- 5.5.2.4 Italy
- 5.5.2.5 Rest of Europe
- 5.5.3 Asia-Pacific
- 5.5.3.1 China
- 5.5.3.2 Japan
- 5.5.3.3 India
- 5.5.3.4 South Korea
- 5.5.3.5 Rest of Asia-Pacific
- 5.5.4 Middle East
- 5.5.4.1 Israel
- 5.5.4.2 Saudi Arabia
- 5.5.4.3 United Arab Emirates
- 5.5.4.4 Turkey
- 5.5.4.5 Rest of Middle East
- 5.5.5 Africa
- 5.5.5.1 South Africa
- 5.5.5.2 Egypt
- 5.5.5.3 Rest of Africa
- 5.5.6 South America
- 5.5.6.1 Brazil
- 5.5.6.2 Argentina
- 5.5.6.3 Rest of South America
- 5.5.1 North America
6 COMPETITIVE LANDSCAPE
- 6.1 Market Concentration
- 6.2 Strategic Moves
- 6.3 Market Share Analysis
- 6.4 Company Profiles (includes Global level Overview, Market level overview, Core Segments, Financials as available, Strategic Information, Market Rank/Share for key companies, Products and Services, and Recent Developments)
- 6.4.1 Dell Technologies Inc.
- 6.4.2 NetApp, Inc.
- 6.4.3 Pure Storage, Inc.
- 6.4.4 International Business Machines Corporation
- 6.4.5 Hewlett Packard Enterprise Company
- 6.4.6 Huawei Technologies Co., Ltd.
- 6.4.7 Hitachi Vantara Corporation
- 6.4.8 Lenovo Group Limited
- 6.4.9 Super Micro Computer, Inc.
- 6.4.10 NVIDIA Corporation
- 6.4.11 Western Digital Corporation
- 6.4.12 Seagate Technology Holdings plc
- 6.4.13 Micron Technology, Inc.
- 6.4.14 Samsung Electronics Co., Ltd.
- 6.4.15 Intel Corporation
- 6.4.16 Amazon Web Services, Inc.
- 6.4.17 Microsoft Corporation
- 6.4.18 Google LLC
- 6.4.19 Nutanix, Inc.
- 6.4.20 VAST Data, Inc.
- 6.4.21 Solidigm Technology LLC
7 MARKET OPPORTUNITIES AND FUTURE OUTLOOK
- 7.1 White-space and Unmet-Need Assessment

 人工智慧驅動的儲存市場:按組件、部署類型、組織規模、應用和最終用戶產業分類-2026-2032年全球市場預測
 人工智慧驅動的儲存系統市場預測——全球分析(按產品、儲存系統、儲存媒體、儲存架構、最終用戶和地區分類)——2034年
 全球直連式人工智慧儲存系統市場:按容量、類型、應用和最終用戶分類-市場規模、產業動態、機會分析和預測(2026-2035 年)
 智慧型手機儲存:人工智慧驅動成長(2026 年)
 全球人工智慧驅動儲存市場規模、佔有率、趨勢和成長分析報告(2026-2034)
 2026年人工智慧賦能儲存全球市場報告
 人工智慧賦能儲存市場-全球產業規模、佔有率、趨勢、機會及預測(按產品、儲存系統、儲存架構、儲存媒體、最終用戶、地區和競爭格局分類),2021-2031年AI伺服器電源市場:按功率範圍、效率等級、外形規格、散熱類型、應用和供應商類型分類,全球預測,2026-2032年
 人工智慧驅動儲存市場規模、佔有率和成長分析(按組件、儲存系統、儲存架構、儲存媒體、最終用戶和地區分類)—2026-2033年產業預測
 全球人工智慧伺服器電源市場:市場佔有率和排名、總收入和需求預測(2025-2031)