


 |
市場調查報告書
商品編碼
2097258
物聯網虛擬業者:市場佔有率分析、產業趨勢與統計、成長預測(2025-2030 年)IoT MVNO - Market Share Analysis, Industry Trends & Statistics, Growth Forecasts (2025 - 2030) |
||||||

※ 本網頁內容可能與最新版本有所差異。詳細情況請與我們聯繫。
根據 Mordor Intelligence 預測,物聯網 MVNO 市場規模預計將在 2025 年達到 124.5 億美元,到 2030 年將擴大到 286.2 億美元,複合年成長率為 18.11%。
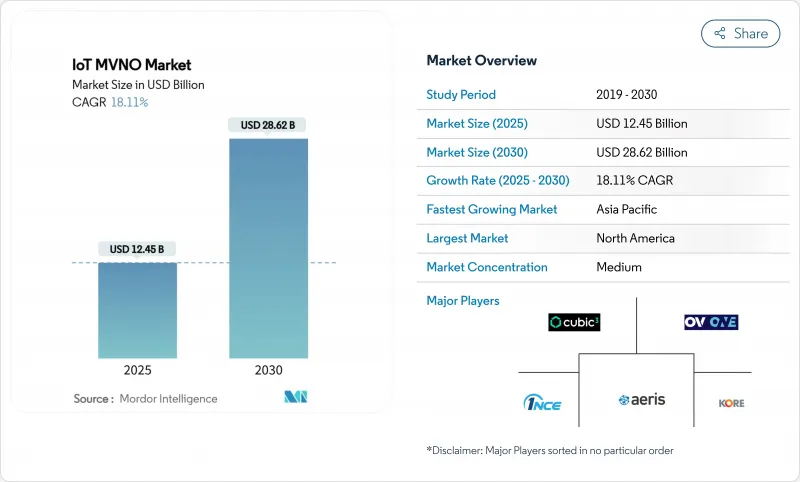
本報告依營運模式(全功能MVNO、服務供應商MVNO、轉售MVNO)、應用領域(汽車與運輸、能源與公共產業等)、連接技術(2G/3G、4G/LTE、5G等)、SIM卡解決方案(實體SIM卡、eSIM、iSIM)、企業規模(大型企業、中小企業)及地區進行分類。市場預測以美元計價。
全球物聯網虛擬營運商市場趨勢與洞察
LPWA(NB-IoT 和 LTE-M)的普及
低功耗廣域網路 (LPWA) 技術可讓電池供電設備在保持連線的同時運作長達 10 年,而商用 NB-IoT/LTE-M 網路現已覆蓋 100 多個國家。行動虛擬網路營運商 (MVNO) 可將此容量聚合到多個通訊業者的網路資源中,與傳統蜂巢式網路相比,可將裝置級連接成本降低高達 70%。成本效益的提升正在加速環境監測和資產追蹤等領域的應用,而進入門檻的降低也加劇了競爭,競爭對手正將重點轉向服務品質指標和全球覆蓋範圍。
eSIM/iSIM 採用率的擴大
GSMA SGP.32 規範標準化了物聯網裝置的遠端 SIM 卡配置,無需處理實體 SIM 卡,並支援從多個通訊業者下載設定檔。產業預測,到 2030 年,eSIM 連線將佔蜂巢式物聯網終端的 37%,iSIM 將佔 34%。行動虛擬網路營運商 (MVNO) 將能夠柔軟性按需切換網路,最佳化成本與效能之間的平衡,並真正支援無需人工干預的全球部署,從而使其能夠為軟體定義連接套餐設定更高的價格。
連網服務的平均每用戶收入下降
正如KORE Wireless擁有1900萬連線的用戶群所表明的那樣,每用戶平均收入(ARPU)正在下降至每月1美元。隨著低功耗廣域網路(LPWA)標準的普及,技術能力趨於標準化,以及大型企業透過談判獲得大幅批量折扣,商品化壓力正在加劇。行動虛擬網路營運商(MVNO)透過將設備管理、安全性和分析功能整合到分級服務中來規避利潤率風險,並將價格競爭從「每兆位元組價格」轉向「價值體現」。
細分市場分析
2024年,全功能虛擬網路營運商(MVNO)將佔據物聯網(IoT)MVNO市佔率的40.54%。這反映了客戶對精細化流量控制、私有存取點網路(APN)和客製化收費結構的需求。採用這種模式的營運商透過跨多個網路協商直接批發價格,提高了利潤率並實現了差異化的服務等級協定(SLA)。由於關鍵任務部署傾向於使用自有基礎設施以確保長期穩定性和合規性,預計到2030年,全功能MVNO所佔的物聯網MVNO市場規模將以16.2%的複合年成長率成長。
以快速服務上線和零基礎設施投入為優先的轉售型虛擬網路營運商 (MVNO) 正以 20.15% 的複合年成長率 (CAGR) 實現最高成長。採用雲端優先採購策略的公司會選擇轉售型服務以避免資本支出,即使這些服務的功能較少。因此,競爭優勢取決於客戶優先考慮的是上市時間和便利性,還是客製化功能和利潤率管理。
2024年,汽車和交通運輸業維持了28.54%的收入佔有率,這主要得益於強制使用eCall、基於使用量的保險遙測技術以及無線軟體交付。聯網汽車的生命週期遠遠超越消費性電子產品的更換週期,從而保證了多年訂閱收入,為行動虛擬網路營運商(MVNO)的現金流提供了保障。同時,由於智慧電錶的部署、電網邊緣感測器的應用以及平衡可再生能源的需求,公共產業行業的設備數量激增,複合年成長率(CAGR)達到22.32%,為物聯網MVNO市場帶來了新的成長機會。
隨著工業自動化、醫療遠端監控和智慧城市專案的日益成熟,拓展多元化的垂直市場對於增強收入韌性至關重要。擁有產業專屬應用程式介面 (API)、合規認證和生態系統夥伴關係關係的行動虛擬網路營運商 (MVNO) 即使在頻寬頻寬的環境下,也能提高客戶留存率並維持高階定價能力。
區域分析
2024年,北美仍是最大的區域貢獻來源地,佔物聯網行動虛擬網路營運商(MVNO)市場佔有率的38.54%,這主要得益於先進的4G/5G部署、強制性批發接入以及聯網汽車和醫療保健監測服務的早期應用。製造地的私人5G試點計畫和聯邦政府關於物聯網網路安全標籤的指南,確保了安全性並維持了對網路切片感知連接的需求。
亞太地區是成長最快的地區,預計到2030年,其授權的蜂巢式物聯網連接數將達到2.7億,這主要得益於政府主導的智慧城市項目、對數位化製造業的獎勵以及5G網路覆蓋範圍的擴大。儘管印度、中國和東南亞各國監管環境的差異需要區域合規和多運營商漫遊策略,但規模經濟和都市化趨勢帶來的收益超過了這種複雜性所帶來的成本。
在歐洲,嚴格的網路安全法規和積極主動的網路切片指南維護著大規模的網路安全框架,這些指南有利於能夠提供垂直最佳化服務層的行動虛擬網路營運商 (MVNO)。歐盟新的網路安全義務將於 2024 年 12 月生效,這將推動對安全元件模組和託管連接包的需求。在其他地區,中東和非洲正透過智慧城市和能源數位化計畫獲得發展動力;而在南美洲,需要衛星和行動電話網路雙重覆蓋以彌合農村連接差距的精密農業應用案例正日益普及。
其他好處:
- Excel格式的市場預測(ME)表
- 3個月的分析師支持
目錄
第1章:引言
- 研究假設和市場定義
- 調查範圍
第2章:調查方法
第3章執行摘要
第4章 市場狀況
- 市場概覽
- 市場促進因素
- LPWA(NB-IoT 和 LTE-M)的普及
- eSIM/iSIM 採用率的擴大
- 人工智慧驅動的網路最佳化平台
- 原始設備製造商 (OEM) 對碳排放報告的合規要求
- 強制MVNO進行5G網路切片
- 擴展聯網汽車計劃
- 市場限制因素
- 通訊ARPU下降
- 漫遊的永久性監管障礙
- 行動虛擬網路業者(MVNO)接取私有5G頻段的限制
- 物聯網安全認證成本飆升
- 供應鏈分析
- 技術展望
- 監理情勢
- 波特五力分析
第5章 市場規模與成長預測
- 按營運模式
- 完整的虛擬營運商
- 服務供應商類型:虛擬營運商
- 轉售型虛擬營運商
- 按字段
- 汽車和運輸設備
- 能源公用事業
- 工業和製造業
- 衛生保健
- 智慧城市和公共部門
- 農業
- 透過連接技術
- 2G/3G
- 4G/LTE
- 5G
- NB-IoT
- LTE-M
- 衛星物聯網
- 按類別分類的SIM卡解決方案
- 實體SIM卡
- eSIM
- iSIM
- 按公司規模
- 大公司
- 小型企業
- 按地區
- 北美洲
- 美國
- 加拿大
- 墨西哥
- 歐洲
- 德國
- 英國
- 法國
- 義大利
- 西班牙
- 俄羅斯
- 其他歐洲國家
- 亞太地區
- 中國
- 日本
- 印度
- 韓國
- 東南亞
- 其他亞太國家
- 中東和非洲
- 中東
- 海灣合作理事會國家
- 土耳其
- 以色列
- 其他中東國家
- 非洲
- 南非
- 奈及利亞
- 肯亞
- 其他非洲國家
- 中東
- 南美洲
- 巴西
- 阿根廷
- 其他南美國家
- 北美洲
第6章 競爭情勢
- 市場集中度
- 策略趨勢
- 市佔率分析
- 公司簡介
- KORE Wireless Group Holdings Inc.
- Aeris Communications Inc.
- 1NCE GmbH & Co. KG
- Wireless Logic Ltd.
- Cubic Telecom Ltd.
- Soracom Inc.
- BICS SA/NV
- Eseye Ltd.
- Transatel SA
- Twilio Inc.
- Truphone Ltd.
- Things Mobile Srl
- Hologram Inc.
- Onomondo ApS
- iBASIS Inc.
- Com4 AS
- Telit Cinterion SpA
- Skylo Technologies Inc.
- Monogoto Ltd.
- Tata Communications Transformation Services Ltd.
第7章 市場機會與未來展望
According to Mordor Intelligence, the ioT MVNO market size reached USD 12.45 billion in 2025 and is projected to climb to USD 28.62 billion by 2030, translating into an 18.11% CAGR.
This report is Segmented by Operational Model (Full MVNO, Service-Provider MVNO, Reseller MVNO), Application Vertical (Automotive and Transport, Energy and Utilities, and More ), Connectivity Technology (2G/3G, 4G/LTE, 5G, and More), SIM Solution (Physical SIM, ESIM, ISIM), Enterprise Size (Large Enterprises, Small and Medium Enterprises), and Geography. The Market Forecasts are Provided in Terms of Value (USD).
Global IoT MVNO Market Trends and Insights
Proliferation of LPWA (NB-IoT and LTE-M)
LPWA technologies enable battery-powered devices to operate for up to 10 years while remaining connected, and commercial NB-IoT/LTE-M networks now span over 100 countries. MVNOs aggregate this capacity across multiple operators, cutting device-level connectivity costs by up to 70% compared with traditional cellular alternatives. Cost efficiency accelerates adoption in environmental monitoring and asset-tracking, but lower entry barriers intensify rivalry, shifting competition toward service-quality metrics and global coverage breadth.
Expansion of eSIM/iSIM Deployments
The GSMA SGP.32 specification standardizes remote-SIM provisioning for IoT devices, eliminating physical-SIM handling and enabling multi-operator profile downloads. Industry forecasts show eSIM connections capturing 37% of cellular IoT endpoints by 2030, followed closely by iSIM at 34%. MVNOs gain the flexibility to switch networks on demand, optimize cost-performance trade-offs, and support truly global deployments without manual intervention, thereby commanding premium pricing for software-defined connectivity bundles.
Connectivity ARPU Erosion
Average revenue per IoT connection is slipping toward USD 1 per month, as illustrated by KORE Wireless' 19 million-connection portfolio. Commoditization pressures intensify where LPWA standards equalize technical capabilities and large enterprises negotiate steep volume discounts. MVNOs hedge margin risk by bundling device management, security, and analytics into tiered offerings that shift price competition toward value recognition rather than megabyte rates.
Other drivers and restraints analyzed in the detailed report include:
- AI-Driven Network-Optimization Platforms
- OEM Carbon-Reporting Compliance Needs
- Permanent-Roaming Regulatory Barriers
For complete list of drivers and restraints, kindly check the Table Of Contents.
Segment Analysis
Full MVNOs captured 40.54% IoT MVNO market share in 2024, reflecting customer demand for granular traffic control, private APNs, and bespoke billing. Operators adopting this model negotiate direct wholesale rates across multiple networks, improving margin leverage and enabling differentiated service-level agreements. The IoT MVNO market size attributable to full MVNOs is projected to expand at 16.2% CAGR through 2030 as mission-critical deployments favor infrastructure ownership for long-term stability and regulatory compliance.
Reseller MVNOs record the fastest 20.15% CAGR by emphasizing quick service activation and zero infrastructure overhead. Enterprises adopting a cloud-first procurement mindset select reseller offers to avoid capital commitments, even though feature depth remains thinner. Competitive positioning therefore hinges on whether customers prioritize time-to-market and simplicity or bespoke functionality and margin control.
Automotive and transport maintained a 28.54% revenue lead in 2024, driven by mandatory eCall, usage-based-insurance telemetry, and over-the-air software delivery. Connected-car lifecycles exceed consumer device refresh rates, guaranteeing multi-year subscription revenues that anchor MVNO cash flows. Utilities, however, post a 22.32% CAGR as smart-meter rollouts, grid-edge sensor adoption, and renewable-energy balancing requirements multiply device counts, signaling new scale opportunities for the IoT MVNO market.
As industrial automation, healthcare remote monitoring, and smart-city projects mature, diversified vertical exposure becomes critical for revenue resilience. MVNOs with vertical-specific application programming interfaces, compliance credentials, and ecosystem partnerships deepen customer stickiness, protecting premium-pricing capacity even in commoditized bandwidth scenarios.
Complete Report Scope:
- By Operational Model
- Full MVNO
- Service-Provider MVNO
- Reseller MVNO
- By Application Vertical
- Automotive and Transport
- Energy and Utilities
- Industrial and Manufacturing
- Healthcare
- Smart Cities and Public Sector
- Agriculture
- By Connectivity Technology
- 2G / 3G
- 4G / LTE
- 5G
- NB-IoT
- LTE-M
- Satellite IoT
- By SIM Solution
- Physical SIM
- eSIM
- iSIM
- By Enterprise Size
- Large Enterprises
- Small and Medium Enterprises
- By Geography
- North America
- United States
- Canada
- Mexico
- Europe
- Germany
- United Kingdom
- France
- Italy
- Spain
- Russia
- Rest of Europe
- Asia-Pacific
- China
- Japan
- India
- South Korea
- South-East Asia
- Rest of Asia-Pacific
- Middle East and Africa
- Middle East
- GCC Countries
- Turkey
- Israel
- Rest of Middle East
- Africa
- South Africa
- Nigeria
- Kenya
- Rest of Africa
- Middle East
- South America
- Brazil
- Argentina
- Rest of South America
- North America
Geography Analysis
North America remained the largest regional contributor in 2024, claiming 38.54% IoT MVNO market share on the back of advanced 4G/5G rollouts, mandated wholesale access, and early adoption of connected-vehicle and healthcare-monitoring services. Private-5G pilots in manufacturing hubs and federal guidance on IoT cyber-labeling sustain demand for secure, slice-enabled connectivity.
Asia-Pacific is the fastest-growing region, set to contribute 270 million licensed cellular IoT connections by 2030, fuelled by government-backed smart-city projects, digital-manufacturing incentives, and accelerating 5G coverage. Regulatory diversity across India, China, and Southeast Asian nations necessitates localized compliance and multi-operator roaming strategies, but scale economics and urbanization trends outweigh complexity costs.
Europe sustains a sizeable installed base through stringent cybersecurity legislation and proactive network-slicing guidelines that reward MVNOs able to deliver vertically tuned service tiers. New EU cybersecurity obligations applicable from December 2024 elevate demand for secure-element-enabled modules and managed-connectivity bundles. Elsewhere, the Middle East and Africa gain momentum via smart-city and energy-digitization projects, while South America increasingly embraces precision-agriculture use cases requiring dual satellite-cellular coverage to overcome rural connectivity gaps.
- KORE Wireless Group Holdings Inc.
- Aeris Communications Inc.
- 1NCE GmbH & Co. KG
- Wireless Logic Ltd.
- Cubic Telecom Ltd.
- Soracom Inc.
- BICS SA/NV
- Eseye Ltd.
- Transatel SA
- Twilio Inc.
- Truphone Ltd.
- Things Mobile S.r.l.
- Hologram Inc.
- Onomondo ApS
- iBASIS Inc.
- Com4 AS
- Telit Cinterion SpA
- Skylo Technologies Inc.
- Monogoto Ltd.
- Tata Communications Transformation Services Ltd.
Additional Benefits:
- The market estimate (ME) sheet in Excel format
- 3 months of analyst support
TABLE OF CONTENTS
1 INTRODUCTION
- 1.1 Study Assumptions and Market Definition
- 1.2 Scope of the Study
2 RESEARCH METHODOLOGY
3 EXECUTIVE SUMMARY
4 MARKET LANDSCAPE
- 4.1 Market Overview
- 4.2 Market Drivers
- 4.2.1 Proliferation of LPWA (NB-IoT and LTE-M)
- 4.2.2 Expansion of eSIM/iSIM deployments
- 4.2.3 AI-driven network optimisation platforms
- 4.2.4 OEM carbon-reporting compliance needs
- 4.2.5 5G network-slicing mandates for MVNOs
- 4.2.6 Connected-vehicle programme expansion
- 4.3 Market Restraints
- 4.3.1 Connectivity ARPU erosion
- 4.3.2 Permanent-roaming regulatory barriers
- 4.3.3 Limited MVNO access to private-5G spectrum
- 4.3.4 Escalating IoT-SAFE / security-certification costs
- 4.4 Supply-Chain Analysis
- 4.5 Technological Outlook
- 4.6 Regulatory Landscape
- 4.7 Porter's Five Forces Analysis
- 4.7.1 Threat of New Entrants
- 4.7.2 Bargaining Power of Suppliers
- 4.7.3 Bargaining Power of Buyers
- 4.7.4 Threat of Substitutes
- 4.7.5 Intra-Industry Rivalry
5 MARKET SIZE AND GROWTH FORECASTS (VALUE)
- 5.1 By Operational Model
- 5.1.1 Full MVNO
- 5.1.2 Service-Provider MVNO
- 5.1.3 Reseller MVNO
- 5.2 By Application Vertical
- 5.2.1 Automotive and Transport
- 5.2.2 Energy and Utilities
- 5.2.3 Industrial and Manufacturing
- 5.2.4 Healthcare
- 5.2.5 Smart Cities and Public Sector
- 5.2.6 Agriculture
- 5.3 By Connectivity Technology
- 5.3.1 2G / 3G
- 5.3.2 4G / LTE
- 5.3.3 5G
- 5.3.4 NB-IoT
- 5.3.5 LTE-M
- 5.3.6 Satellite IoT
- 5.4 By SIM Solution
- 5.4.1 Physical SIM
- 5.4.2 eSIM
- 5.4.3 iSIM
- 5.5 By Enterprise Size
- 5.5.1 Large Enterprises
- 5.5.2 Small and Medium Enterprises
- 5.6 By Geography
- 5.6.1 North America
- 5.6.1.1 United States
- 5.6.1.2 Canada
- 5.6.1.3 Mexico
- 5.6.2 Europe
- 5.6.2.1 Germany
- 5.6.2.2 United Kingdom
- 5.6.2.3 France
- 5.6.2.4 Italy
- 5.6.2.5 Spain
- 5.6.2.6 Russia
- 5.6.2.7 Rest of Europe
- 5.6.3 Asia-Pacific
- 5.6.3.1 China
- 5.6.3.2 Japan
- 5.6.3.3 India
- 5.6.3.4 South Korea
- 5.6.3.5 South-East Asia
- 5.6.3.6 Rest of Asia-Pacific
- 5.6.4 Middle East and Africa
- 5.6.4.1 Middle East
- 5.6.4.1.1 GCC Countries
- 5.6.4.1.2 Turkey
- 5.6.4.1.3 Israel
- 5.6.4.1.4 Rest of Middle East
- 5.6.4.2 Africa
- 5.6.4.2.1 South Africa
- 5.6.4.2.2 Nigeria
- 5.6.4.2.3 Kenya
- 5.6.4.2.4 Rest of Africa
- 5.6.4.1 Middle East
- 5.6.5 South America
- 5.6.5.1 Brazil
- 5.6.5.2 Argentina
- 5.6.5.3 Rest of South America
- 5.6.1 North America
6 COMPETITIVE LANDSCAPE
- 6.1 Market Concentration
- 6.2 Strategic Moves
- 6.3 Market Share Analysis
- 6.4 Company Profiles {(includes Global level Overview, Market level overview, Core Segments, Financials as available, Strategic Information, Market Rank/Share for key companies, Products and Services, and Recent Developments)}
- 6.4.1 KORE Wireless Group Holdings Inc.
- 6.4.2 Aeris Communications Inc.
- 6.4.3 1NCE GmbH & Co. KG
- 6.4.4 Wireless Logic Ltd.
- 6.4.5 Cubic Telecom Ltd.
- 6.4.6 Soracom Inc.
- 6.4.7 BICS SA/NV
- 6.4.8 Eseye Ltd.
- 6.4.9 Transatel SA
- 6.4.10 Twilio Inc.
- 6.4.11 Truphone Ltd.
- 6.4.12 Things Mobile S.r.l.
- 6.4.13 Hologram Inc.
- 6.4.14 Onomondo ApS
- 6.4.15 iBASIS Inc.
- 6.4.16 Com4 AS
- 6.4.17 Telit Cinterion SpA
- 6.4.18 Skylo Technologies Inc.
- 6.4.19 Monogoto Ltd.
- 6.4.20 Tata Communications Transformation Services Ltd.
7 MARKET OPPORTUNITIES AND FUTURE OUTLOOK
- 7.1 White-space and Unmet-Need Assessment

 智慧作物監測市場:全球市場預測,2026-2032年
 2026-2030年全球物聯網(IoT)市場物聯網網路管理市場:全球市場預測,2026-2032年
 鐵路電腦市場規模、佔有率和成長分析:按產品類型、應用、外形規格、最終用戶、銷售管道、部署方式和地區分類-2026-2033年產業預測
 充電管理系統市場規模、佔有率和成長分析:按組件、部署類型、應用、最終用戶和地區分類-2026-2033年產業預測工業系統整合商和工業IoT技術市場 - 全球預測,2026-2032年物聯網解決方案和服務市場:全球預測,2026-2032年物聯網市場-2026-2032年全球市場預測
 物聯網 (IoT) 市場預測 2034 年—按組件、部署模式、連接技術、平台、企業規模、最終用戶和地區分類的全球分析
 物聯網服務:研究訂閱