


 |
市場調查報告書
商品編碼
2097144
電動山地自行車:市場佔有率分析、產業趨勢與統計及成長預測(2026-2031)E-Mountain Bike - Market Share Analysis, Industry Trends & Statistics, Growth Forecasts (2026 - 2031) |
||||||

※ 本網頁內容可能與最新版本有所差異。詳細情況請與我們聯繫。
根據 Mordor Intelligence 估計,2026 年電動山地自行車市場價值將達到 94.1 億美元,高於 2025 年的 86 億美元,預計到 2031 年將達到 147.5 億美元。
預計從 2026 年到 2031 年,其複合年成長率將達到 9.4%。
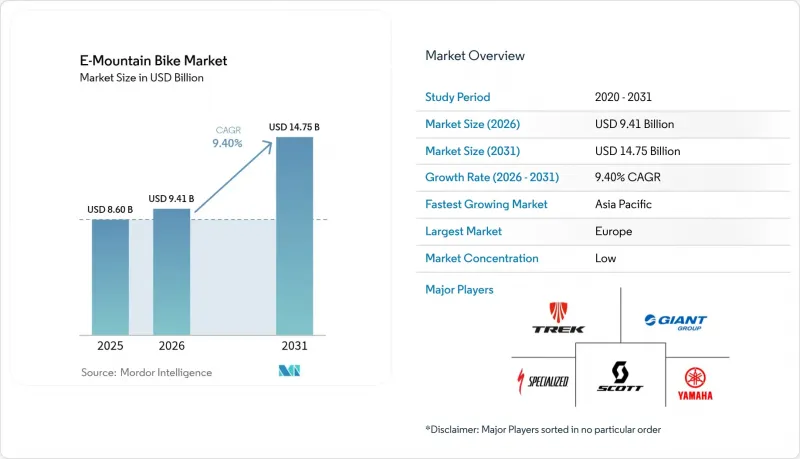
本報告按動力類型(腳踏輔助、油門輔助等)、應用領域(休閒、探險等)、電池類型(鋰離子電池、鋰聚合物電池等)、功率輸出(250瓦及以下等)、車架材質(鋁合金、碳纖維等)、分銷管道和地區進行細分。市場預測以價值(美元)和銷售(台)兩種形式呈現。
全球電動山地自行車市場趨勢與洞察
輕量化、高容量鋰離子電池的進展
能量密度現已超過 300 Wh/kg,電池組重量也得以減輕,使騎乘者能夠在不影響操控性的前提下爬升更遠的距離。快速充電功能可在 90 分鐘內充電至 75%,這對於優先考慮快速周轉率的租賃企業至關重要。預測性電池管理軟體會考慮坡度和踏頻,與之前的型號相比,續航里程可提升 15-20%。這項技術已將行銷指標從瓦時 (Wh) 轉變為“每次充電的垂直爬升米數”,這對於初學者來說是一個更易於理解的指標。容量的提升使得曾經只有精英運動員才能實現的多日山間小屋騎乘成為可能。這項化學技術的進步使其高價位物有所值,並正在拓展其應用範圍。
探險運動和生態旅遊日益普及
探險旅遊將永續性目標與刺激體驗相結合,使電動山地自行車(E-MTB)成為以往對陡峭山路望而卻步的消費者的「入門級產品」。引入電動山地自行車租賃服務的阿爾卑斯山度假村,夏季遊客數量顯著增加,並在滑雪季之外開闢了新的收入來源。對於老齡化人口而言,電動輔助功能讓他們能夠在不影響欣賞美景的前提下節省體力,因此備受歡迎。世界各地的旅遊局如今都在大力推廣電動山地自行車環線,將其與徒步和滑雪線路並列,重新定位自行車,不再僅僅將其視為一種配件,而是將其視為一項核心基礎設施。包含裝備、住宿和纜車票的導覽套裝旅遊,正在提升人均消費水準。這些協同效應增強了市場需求的韌性,並支持遊客數量的長期成長。
與傳統山地自行車相比,初始成本更高
由於電動登山車的價格高於傳統登山車,其普及受到阻礙,尤其是在消費信貸滲透率較低的經濟體。配備碳纖維車架的旗艦車型價格通常較高,儘管融資方案日益增多,但擁有電動登山車仍然僅限於富裕的愛好者。製造商現在提供模組化升級方案,將成本分攤到整個使用週期內。總擁有成本 (TCO) 計算器突出顯示了節省的班車燃油費和纜車票費用,這些計算器正受到關注,但尚未說服對價格敏感的買家。補貼正在縮小差距,但「高價衝擊」仍然是阻礙電動山地自行車市場在可預見的未來成長的因素。
細分市場分析
2025年,輔助騎乘系統將佔據電動山地自行車市場71.62%的佔有率,鞏固其市場基石地位。踏頻感應控制器能夠保持模擬騎乘的節奏感,在登山車愛好者群體中廣受歡迎,同時也滿足了相關法規對馬達啟動的監管要求。許多高階車型現在將多感測器扭力測量與預測演算法相結合,能夠無縫調節輸出,消除了早期車型中常見的「開/關」式動力輸出。該細分市場的優勢在於其與單車道使用規則的兼容性,這些規則通常禁止使用油門,從而確保了其廣泛的合法適用性。
相較之下,結合了腳踏助力和油門的雙模式系統正以10.05%的複合年成長率成長,尤其受到需要應對各種地形並攜帶行李上坡的騎行者的青睞,特別是在自行車公園接駁服務和自我調整騎行項目中。各品牌正巧妙地分類價格區間,為主流探險愛好者提供入門級腳踏助力自行車,為追求刺激的騎行者提供雙模式旗艦車型,以及為實用型用戶提供純油門車型。隨著韌體的進步,製造商正在設想透過空中下載(OTA)解鎖功能,使用戶能夠根據所在位置切換輔助模式。這項策略可望加深用戶對電動山地自行車市場的參與度,並延長升級週期。
到2025年,休閒和探險騎乘者將佔電動登山車市場佔有率的46.78%,這表明該細分市場對那些優先考慮續航里程和減輕體力消耗的首次購車者俱有「情感吸引力」。典型的車主群傾向於經驗豐富的騎乘者,他們希望在無需過度訓練的情況下,在高海拔路線上進行長途騎行。同時,在以社群媒體用戶為主的年輕一代中,使用電動登山車拍攝陡峭下坡的動態影像的趨勢日益成長。旅遊租賃市場起步推出較小,但隨著旅遊目的地營運商提供包含導遊服務、接駁車票和住宿設施的“承包體驗”,該市場正以10.92%的複合年成長率快速成長。
與傳統自行車租賃相比,度假村的租賃車輛每日收入更高,淡季期間的運轉率也更高,這印證了庫存商業模式的合理性,儘管該模式需要大量資本投入。競爭模式也日趨成熟,相關機構紛紛推出專門的電動耐力賽系列,認可了這一細分市場的合法性,並促使零件製造商發布用於比賽的電機程式。雖然通勤仍然是一個小眾市場,但在越野路線起點與郊區交通網路交匯的地區,預計該市場將逐步成長,因為多功能自行車既可用於工作日通勤,也可用於週末越野探險。
區域分析
到2025年,歐洲將引領電動山地自行車市場,佔42.87%的市場。這得歸功於密集的山地車道網路、完善的保險體係以及各個年齡層對電動出行的廣泛接受。德國仍是歐洲電動登山車市場的核心參與者,預計2024年將售出205萬輛電動自行車,這得益於其擁有技術精湛的經銷商網路,這些經銷商擅長診斷和零件供應。法國和義大利緊隨其後,利用其旅遊經濟優勢,在阿爾卑斯山脈和沿海地區推廣電動山地自行車(E-MTB)導覽服務。將於2025年生效的歐盟電池採購法規將逐步重組供應鏈,使電池採購轉向區域電池製造商,並進一步鞏固歐洲在電動山地自行車市場的主導地位。
亞太地區是成長最快的地區,預計到2031年複合年成長率將達到10.32%。中國製造業的規模優勢和快速成長的中產階級的需求,為其成長提供了強勁動力。本土品牌正利用其透過廣泛的電子商務發展而建立的直銷物流基礎設施,在不犧牲連結性的前提下,以價格優勢擊敗全球知名品牌。日本企業正在研發專為限速嚴格的狹窄山路系統最佳化的250W緊湊型電機,而韓國供應商則正在投資建設一條固態電池試點生產線,計劃於2027年推出。在印度的高海拔度假勝地,引入度假車輛運送遊客攀登陡坡,表明該地區有潛力跳過傳統的自行車普及階段,直接進入電動山地自行車市場。
北美地區的銷售佔比很高,但由於聯邦政府管轄土地的分配不均,單車道的普及速度停滯不前。 2024年,美國進口了大量電動自行車,實現了穩健的同比成長,但由於政策的不確定性,其中只有一小部分是電動山地自行車。加州和科羅拉多的補貼計畫(目前最高可達1500美元)推動了零售商預訂量的激增。在加拿大,不列顛哥倫比亞省和魁北克省也出現了類似的趨勢,省級政府的獎勵加上維護良好的步道網路,使得單車道的普及率高於平均水平。
其他好處:
- Excel格式的市場預測(ME)表
- 3個月的分析師支持
目錄
第1章:引言
- 研究假設和市場定義
- 調查範圍
第2章:調查方法
第3章執行摘要
第4章 市場狀況
- 市場概覽
- 市場促進因素
- 輕量化、高容量鋰離子電池的進展
- 探險運動和生態旅遊日益普及
- 政府對電動車的激勵與補貼
- 訂閱式所有權模式可降低初始成本。
- 將物聯網和智慧連接技術融入越野騎行
- 一家度假村的自行車共享車隊引入了電動山地車。
- 市場限制因素
- 與傳統登山車相比,初始成本較高
- 土地使用法規限制電動自行車進入步道。
- 對陡峭地形上的射程感到擔憂
- 低溫高空運轉期間電池性能下降
- 價值供應鏈分析
- 監理情勢
- 技術展望
- 波特五力模型
第5章 市場規模與成長預測
- 依推進類型
- 腳踏輔助型
- 油門輔助類型
- 雙模式(腳踏+油門)
- 透過使用
- 休閒探險
- 通勤
- 運動/賽車
- 旅遊租賃
- 依電池類型
- 鋰離子
- 鋰聚合物
- 其他(鉛酸電池、固態固態電池)
- 依輸出類型
- 250瓦或以下
- 250~500 W
- 500瓦或以上
- 框架材質
- 鋁
- 碳纖維
- 鋼鐵材料及其他
- 透過分銷管道
- OEM經銷商
- 自行車專賣店
- 線上零售
- 訂閱和租賃平台
- 按地區
- 北美洲
- 美國
- 加拿大
- 其他北美國家
- 南美洲
- 巴西
- 阿根廷
- 其他南美國家
- 歐洲
- 德國
- 英國
- 義大利
- 瑞士
- 法國
- 西班牙
- 其他歐洲國家
- 亞太地區
- 中國
- 日本
- 韓國
- 印度
- 澳洲
- 其他亞太國家
- 中東和非洲
- 阿拉伯聯合大公國
- 沙烏地阿拉伯
- 土耳其
- 埃及
- 南非
- 其他中東和非洲國家
- 北美洲
第6章 競爭情勢
- 市場集中度
- 策略趨勢
- 市佔率分析
- 公司簡介
- Giant Manufacturing Co. Ltd
- Pivot Cycles
- Scott Sports SA
- Trek Bicycle Corporation
- CUBE GmbH & Co. KG
- Yamaha Motor Co. Ltd
- Pedego Electric Bikes
- BH Bikes
- Specialized Bicycle Components, Inc.
- Haibike
- Merida Industry Co. Ltd
- Santa Cruz Bicycles
- Rocky Mountain Bicycles
- Cannondale(Dorel Sports)
- Bulls Bikes
- Commencal
- Kona Bicycle Company
- Orbea S. Coop.
第7章 市場機會與未來展望
According to Mordor Intelligence, e-Mountain bike market size in 2026 is estimated at USD 9.41 billion, growing from 2025 value of USD 8.60 billion with 2031 projections showing USD 14.75 billion, growing at 9.4% CAGR over 2026-2031.
This report is Segmented by Propulsion Type (Pedal-Assisted, Throttle-Assisted, and More), Application (Leisure and Adventure, and More), Battery Type (Lithium-Ion, Lithium-Polymer, and More), Power Output (Less Than/Equals 250 W, and More), Frame Material (Aluminum, Carbon Fiber, and More), Distribution Channel, and Geography. The Market Forecasts are Provided in Terms of Value (USD) and Volume (Units).
Global E-Mountain Bike Market Trends and Insights
Advancements in Lightweight High-Capacity Li-ion Batteries
Energy densities now exceed 300 Wh/kg while pack mass falls, letting riders climb farther without handling compromises. Fast-charge routines reach 75% in 90 minutes, critical for rental fleets that rely on quick turnover. Predictive battery-management software factors gradient and cadence to stretch range by 15-20% versus prior models. The technology reshapes marketing from watt-hours to "vertical meters per charge," a user-friendly metric that resonates with newcomers. Higher capacities unlock multi-day hut trips once reserved for elite athletes. This chemistry evolution underpins premium pricing and broadens use cases.
Rising Popularity of Adventure Sports and Eco-Tourism
Adventure tourism blends sustainability goals with adrenaline appeal, turning e-MTBs into gateway products for consumers who once avoided steep alpine trails. Alpine resorts that added e-MTB rentals recorded summer visitation rises, creating new revenue streams outside ski season . Aging populations welcome pedal assistance that preserves stamina without sacrificing scenery. National tourism boards now highlight e-MTB loops alongside hiking and skiing, repositioning the bike as core infrastructure rather than an accessory. Guided package deals that bundle equipment, lodging, and lift transport lift the average guest's spend. These synergies elevate demand elasticity and reinforce long-run volume growth.
High Upfront Cost vs. Conventional MTBs
High premiums over analog bikes deter mass adoption, especially in economies where consumer credit penetration is low. Carbon-framed flagships often come with a cost, restricting ownership to affluent enthusiasts despite rising financing options. Manufacturers now offer modular upgrade paths that defer part of the spend across ownership's life cycle. Total cost-of-ownership calculators highlighting savings on shuttle fuel and lift passes are gaining traction but have yet to sway price-first buyers. Subsidies ease the gap, yet sticker shock remains a near-term brake on the E-Mountain Bike market.
Other drivers and restraints analyzed in the detailed report include:
- Government Incentives and Subsidies for E-Mobility
- Subscription-Based Ownership Models Lowering Upfront Cost
- Land-Access Rules Limiting E-Bike Trail Entry
For complete list of drivers and restraints, kindly check the Table Of Contents.
Segment Analysis
Pedal-assisted configurations secured 71.62% of the E-Mountain Bike market share in 2025, entrenching them as the cornerstone of the E-Mountain Bike market. Their cadence-sensing controllers preserve the rhythmic feel of analog riding, earning social acceptance in trail communities and satisfying regulators that demand rider input for motor activation. Many premium models now blend multi-sensor torque readings with predictive algorithms that taper power seamlessly, eliminating the "on-off" sensation earlier units displayed. The segment's strength stems from compatibility with single-track access rules that often bar throttle use, ensuring broad legal applicability.
By contrast, dual-mode systems offering pedal assist and throttle are moving at a 10.05% CAGR by appealing to riders who traverse mixed terrain or transport cargo uphill, particularly in bike-park shuttling and adaptive cycling programs. Brands are segmenting price tiers cleverly: entry-level pedal-assist bikes for mainstream adventurers, dual-mode flagships for thrill seekers, and throttle-only variants for utility scenarios. As firmware sophistication advances, manufacturers envision over-the-air unlocks that let owners switch assistance modes for specific venues, a tactic expected to deepen engagement and extend upgrade cycles within the E-Mountain Bike market.
Leisure and adventure riders accounted for 46.78% of the E-Mountain Bike market share in 2025, evidencing the segment's role as the emotional magnet for first-time buyers who value expanded range and reduced physical strain. Typical owner profiles skew toward experienced cyclists wanting longer mileage on alpine routes without exhaustive conditioning. Yet, younger social-media-driven cohorts increasingly use e-MTBs to film dynamic content on gnarly descents. Though smaller at inception, tourism rentals are expanding at 10.92% CAGR as destination operators bundle guided tours, shuttle passes, and accommodations into turnkey experiences.
Resort fleets report higher daily earnings versus analog bike rentals while stretching shoulder-season occupancy, validating the business case for high-capex inventory. Sports-racing formats are solidifying with sanctioning bodies introducing dedicated e-enduro series, legitimizing the segment, and inspiring component makers to release race-oriented motor maps. Commuter usage remains niche but is predicted to climb modestly where trailheads intersect suburban transport grids, leveraging mixed-purpose bikes that toggle between weekday commuting and weekend off-road exploration.
Complete Report Scope:
- By Propulsion Type
- Pedal-Assisted
- Throttle-Assisted
- Dual-Mode (Pedal + Throttle)
- By Application
- Leisure and Adventure
- Commuting
- Sports / Racing
- Tourism Rental
- By Battery Type
- Lithium-ion
- Lithium-Polymer
- Others (Lead-acid, Solid-state)
- By Power Output
- Less than/Equals 250 W
- 250-500 W
- Above 500 W
- By Frame Material
- Aluminum
- Carbon Fiber
- Steel and Others
- By Distribution Channel
- OEM Dealerships
- Specialty Bike Stores
- Online Retail
- Subscription and Leasing Platforms
- By Geography
- North America
- United States
- Canada
- Rest of North America
- South America
- Brazil
- Argentina
- Rest of South America
- Europe
- Germany
- United Kingdom
- Italy
- Switzerland
- France
- Spain
- Rest of Europe
- Asia-Pacific
- China
- Japan
- South Korea
- India
- Australia
- Rest of Asia-Pacific
- Middle East and Africa
- United Arab Emirates
- Saudi Arabia
- Turkey
- Egypt
- South Africa
- Rest of Middle East and Africa
- North America
Geography Analysis
Europe led the E-Mountain Bike market with 42.87% of the E-Mountain Bike market share in 2025, powered by dense trail networks, supportive insurance regimes, and cultural acceptance of e-mobility across all age brackets. Germany remains the continent's anchor with 2.05 million e-bike sales in 2024, buttressed by a dealer network skilled in diagnostics and spares. France and Italy follow, leveraging tourism economies that promote e-MTB guiding services in Alpine and coastal regions. EU battery sourcing mandates enacted in 2025 skew procurement toward regional cell makers, subtly recentering supply chains and reinforcing Europe's leadership position in the E-Mountain Bike market.
Asia-Pacific is the fastest-growing territory at a 10.32% CAGR through 2031, a trajectory fueled by China's manufacturing scale and a burgeoning aspirational middle class. Domestic brands capitalize on direct-to-consumer logistics infrastructure honed in broader e-commerce, undercutting global incumbents on price without sacrificing connectivity features. Japanese firms refine compact 250 W motors optimized for tight trail systems with stricter speed caps, while Korean suppliers invest in solid-state battery pilot lines slated for 2027 release. India's hill-station tourism districts begin adopting resort fleets to move visitors up steep gradients, illustrating the region's potential to leapfrog legacy cycling adoption and move directly into the E-Mountain Bike market.
North America contributes significant volume yet contends with federal land-access fragmentation that stalls wider single-track penetration. The United States imported a significant number of e-bikes in 2024, reflecting a positive year-on-year growth, though only a fraction were e-MTBs owing to policy uncertainty. California and Colorado rebate programs now reimburse up to USD 1,500, triggering spikes in retailer preorders. Canada mirrors trends in British Columbia and Quebec, where provincial incentives dovetail with well-maintained trail networks to foster above-average adoption.
- Giant Manufacturing Co. Ltd
- Pivot Cycles
- Scott Sports SA
- Trek Bicycle Corporation
- CUBE GmbH & Co. KG
- Yamaha Motor Co. Ltd
- Pedego Electric Bikes
- BH Bikes
- Specialized Bicycle Components, Inc.
- Haibike
- Merida Industry Co. Ltd
- Santa Cruz Bicycles
- Rocky Mountain Bicycles
- Cannondale (Dorel Sports)
- Bulls Bikes
- Commencal
- Kona Bicycle Company
- Orbea S. Coop.
Additional Benefits:
- The market estimate (ME) sheet in Excel format
- 3 months of analyst support
TABLE OF CONTENTS
1 Introduction
- 1.1 Study Assumptions & Market Definition
- 1.2 Scope of the Study
2 Research Methodology
3 Executive Summary
4 Market Landscape
- 4.1 Market Overview
- 4.2 Market Drivers
- 4.2.1 Advancements in Lightweight High-Capacity Li-ion Batteries
- 4.2.2 Rising Popularity of Adventure Sports and Eco-Tourism
- 4.2.3 Government Incentives and Subsidies for E-Mobility
- 4.2.4 Subscription-Based Ownership Models Lowering Upfront Cost
- 4.2.5 Integration of IoT and Smart Connectivity for Trail Riding
- 4.2.6 Resort Bike-Share Fleets Deploying E-MTBs
- 4.3 Market Restraints
- 4.3.1 High Upfront Cost vs. Conventional MTBs
- 4.3.2 Land-Access Rules Limiting E-Bike Trail Entry
- 4.3.3 Range Anxiety on Steep Terrain
- 4.3.4 Battery Derating in Cold, High-Altitude Rides
- 4.4 Value / Supply-Chain Analysis
- 4.5 Regulatory Landscape
- 4.6 Technological Outlook
- 4.7 Porter's Five Forces
- 4.7.1 Threat of New Entrants
- 4.7.2 Bargaining Power of Buyers
- 4.7.3 Bargaining Power of Suppliers
- 4.7.4 Threat of Substitutes
- 4.7.5 Competitive Rivalry
5 Market Size & Growth Forecasts (Value (USD) and Volume (Units))
- 5.1 By Propulsion Type
- 5.1.1 Pedal-Assisted
- 5.1.2 Throttle-Assisted
- 5.1.3 Dual-Mode (Pedal + Throttle)
- 5.2 By Application
- 5.2.1 Leisure and Adventure
- 5.2.2 Commuting
- 5.2.3 Sports / Racing
- 5.2.4 Tourism Rental
- 5.3 By Battery Type
- 5.3.1 Lithium-ion
- 5.3.2 Lithium-Polymer
- 5.3.3 Others (Lead-acid, Solid-state)
- 5.4 By Power Output
- 5.4.1 Less than/Equals 250 W
- 5.4.2 250-500 W
- 5.4.3 Above 500 W
- 5.5 By Frame Material
- 5.5.1 Aluminum
- 5.5.2 Carbon Fiber
- 5.5.3 Steel and Others
- 5.6 By Distribution Channel
- 5.6.1 OEM Dealerships
- 5.6.2 Specialty Bike Stores
- 5.6.3 Online Retail
- 5.6.4 Subscription and Leasing Platforms
- 5.7 By Geography
- 5.7.1 North America
- 5.7.1.1 United States
- 5.7.1.2 Canada
- 5.7.1.3 Rest of North America
- 5.7.2 South America
- 5.7.2.1 Brazil
- 5.7.2.2 Argentina
- 5.7.2.3 Rest of South America
- 5.7.3 Europe
- 5.7.3.1 Germany
- 5.7.3.2 United Kingdom
- 5.7.3.3 Italy
- 5.7.3.4 Switzerland
- 5.7.3.5 France
- 5.7.3.6 Spain
- 5.7.3.7 Rest of Europe
- 5.7.4 Asia-Pacific
- 5.7.4.1 China
- 5.7.4.2 Japan
- 5.7.4.3 South Korea
- 5.7.4.4 India
- 5.7.4.5 Australia
- 5.7.4.6 Rest of Asia-Pacific
- 5.7.5 Middle East and Africa
- 5.7.5.1 United Arab Emirates
- 5.7.5.2 Saudi Arabia
- 5.7.5.3 Turkey
- 5.7.5.4 Egypt
- 5.7.5.5 South Africa
- 5.7.5.6 Rest of Middle East and Africa
- 5.7.1 North America
6 Competitive Landscape
- 6.1 Market Concentration
- 6.2 Strategic Moves
- 6.3 Market Share Analysis
- 6.4 Company Profiles (Includes Global Level Overview, Market Level Overview, Core Segments, Financials as Available, Strategic Information, Market Rank/Share for Key Companies, Products and Services, SWOT Analysis, and Recent Developments)
- 6.4.1 Giant Manufacturing Co. Ltd
- 6.4.2 Pivot Cycles
- 6.4.3 Scott Sports SA
- 6.4.4 Trek Bicycle Corporation
- 6.4.5 CUBE GmbH & Co. KG
- 6.4.6 Yamaha Motor Co. Ltd
- 6.4.7 Pedego Electric Bikes
- 6.4.8 BH Bikes
- 6.4.9 Specialized Bicycle Components, Inc.
- 6.4.10 Haibike
- 6.4.11 Merida Industry Co. Ltd
- 6.4.12 Santa Cruz Bicycles
- 6.4.13 Rocky Mountain Bicycles
- 6.4.14 Cannondale (Dorel Sports)
- 6.4.15 Bulls Bikes
- 6.4.16 Commencal
- 6.4.17 Kona Bicycle Company
- 6.4.18 Orbea S. Coop.
7 Market Opportunities & Future Outlook
- 7.1 White-space & Unmet-Need Assessment

 賽車自行車市場:全球產業分析、市場規模、市場佔有率以及 2026 年到 2033 年的預測(按自行車類型、車架材料、價格範圍、應用、分銷管道、國家和地區分類)。
 電動山地自行車市場規模、佔有率和成長分析:按驅動系統、電池容量、懸吊設計、分銷網路和地區分類-2026-2033年產業預測
 全球山地自行車市場
 2026-2030年全球登山車市場
 2026年全球山地自行車市場報告2026年全球山地電動自行車市場報告
 賽車自行車市場機會、成長要素、產業趨勢分析及 2026-2035 年預測。
 電動山地自行車市場:按自行車類型和地區分類
 電動山地自行車市場規模、佔有率、成長率及全球產業分析:按類型、應用和地區的洞察,2026-2034年預測山地自行車懸吊市場按產品類型、應用和地區分類