


 |
市場調查報告書
商品編碼
2097101
製造業物聯網:市場佔有率分析、產業趨勢與統計及成長預測(2026-2031 年)Internet-of-Things in Manufacturing - Market Share Analysis, Industry Trends & Statistics, Growth Forecasts (2026 - 2031) |
||||||

※ 本網頁內容可能與最新版本有所差異。詳細情況請與我們聯繫。
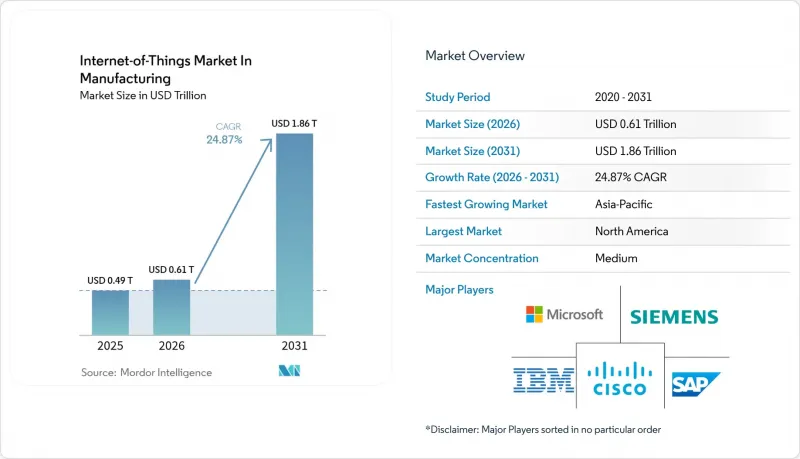
根據 Mordor Intelligence 預測,製造業物聯網市場規模將從 2025 年的 4,900 億美元成長到 2026 年的 6,100 億美元,然後在 2031 年達到 1.86 兆美元,2026 年至 2031 年的複合年成長率為 24.87%。
本報告按組件(硬體、軟體和服務)、連接技術(有線和無線)、部署模式(本地、雲端等)、應用(預測性維護、資產性能和 OEE 最佳化等)、最終用戶行業(汽車和電動汽車製造、電子和半導體等)以及地區進行細分。
全球物聯網市場趨勢及製造業洞察
在德國和日本的各個生產工廠部署私有5G和LPWAN
在德國和日本,私有 5G 和 LPWAN 網路的部署正在改變生產現場的格局。 99.99% 的資料包延遲低於 10 毫秒,為時間敏感型機器人單元提供了支援;同時,網路切片技術確保了品質偵測攝影機的確定性效能。已部署 5G 測試平台的汽車製造商報告稱,由於預測性維護和自動化返工流程,生產效率提高了高達 245%,營運成本降低了高達 90%。連接到私有網路的邊緣伺服器支援現場分析,無需往返雲端,從而保障了資料主權。
歐盟和美國的數位溯源法規正在加速感測器的應用。
歐盟的「數位產品護照」和美國類似的法規要求所有工業產品提供序號生命週期資料。製造商正在整合物聯網感測器,以自動記錄產品的來源、成分和程式參數。領先採用者透過即時了解不同地點之間的物料流動情況,實現了意外停機時間減少25%,庫存減少30%。除了滿足合規要求外,該基礎設施還被用於建立持續改進儀表板,從而能夠可視化瓶頸並立即採取糾正措施。
印度傳統工廠的 IPv4 位址耗盡
棕地設施依賴的控制系統陳舊,無法跟上新設備激增的步伐。 IPv4 位址區塊已接近枯竭,而升級到 IPv6 的成本平均每個大型企業高達 240 萬美元,其中包括韌體、培訓和停機補償。這些成本和整合障礙正在阻礙感測器在印度快速發展的製造業走廊中的廣泛應用。
細分市場分析
到2025年,軟體將佔據製造業物聯網市場佔有率的50-60%,繼續扮演智慧層的角色,將原始感測器資料流轉化為可執行的建議。在工廠中,由於需要對數千個異質節點進行安全存取、韌體更新和策略執行,設備管理平台佔據主導地位。分析引擎是成長最快的細分市場,反映了對故障預測、資產性能洞察和自適應過程控制的需求。從2026年到2031年,業務收益預計將超過硬體和軟體,以22.95%的複合年成長率成長,因為整合商統籌複雜的維修專案和培訓計畫。閘道器和工業用電腦仍然是邊緣層的基礎,但感測器的單位成本持續下降,促使新的測量點不斷出現。硬體對於物理感測和執行至關重要,但投資重點正在轉向靈活的基於訂閱的軟體堆疊。
系統整合商現在不再採用單一的整體套件,而是從廣泛的生態系統中建立可組合的模組。這種轉變提高了互通性,並加速了概念驗證(PoC) 專案的部署。隨著設備數量的增加,攻擊面也隨之擴大,因此網路安全模組被捆綁在每個新軟體版本中。製造商越來越依賴託管服務合作夥伴提供全天候監控和零日漏洞修補,軟體使用費與網路可用性保障之間的聯繫也日益緊密。
預計到2025年,無線通訊將佔連接業務收入的63.40%。其中,5G預計將以37.8%的複合年成長率快速成長。這是因為5G結合了1 Gb/s的吞吐量、低於10毫秒的延遲以及網路切片技術,能夠支援機器視覺、移動機器人和擴增實境(AR)驅動的維護應用。諸如NB-IoT和LoRaWAN等低功耗廣域網路(LPWAN)技術滿足了能量受限感測器在公里級範圍內傳輸小型資料包的需求。在電磁干擾較強或確定性運作至關重要的區域,有線骨幹網路仍發揮關鍵作用,而升級到TSN則可實現標準乙太網路的微秒同步。 5G和確定性乙太網路在同一工廠內共存,無需冗餘佈線即可實現分級服務。
短距離低功耗藍牙模組成本極低,主要用於工具識別標籤和操作員定位服務等特定用途。新興的5G-TSN融合協議可望透過單一網路同時涵蓋運動控制迴路和雲回程傳輸,從而簡化交換機櫃。然而,半導體短缺和認證的等待延緩了這些先進晶片的普及,凸顯了多路徑架構的重要性,該架構可在供應緊張時回退到傳統協議。
區域分析
預計到2025年,北美將佔製造業物聯網市場收入的32.95%。早期採用、強大的工業IT生態系統以及自動化稅收優惠政策是推動物聯網普及的主要因素。美國工廠正在部署物聯網技術,以彌補技術純熟勞工短缺的問題,並恢復已遷回國內的產品線。原始設備製造商(OEM)擴大整合測量硬體,以支援基於使用量的租賃模式,這不僅加強了供應商與客戶之間的聯繫,也促進了現金流。
預計2026年至2031年,亞太地區的複合年成長率將達25.18%,成長率位居全球之首。中國正在投資建造一個覆蓋全國的智慧製造園區,而日本則在人口下降的情況下,透過整合5G和機器人技術來維持生產水準。印度的數位化工廠計畫正在穩步推進,但現有設施(棕地)中IPv4網路的枯竭正在減緩超大規模部署的步伐,直到價格合理的IPv6閘道器普及為止。韓國正利用其國內電信基礎設施,在其高階電子產品生產線上試行應用5G協作機器人和人工智慧驅動的品管。歐洲憑藉德國的「工業4.0」、法國的「未來工業聯盟」和義大利的「轉型4.0」等獎勵計劃,仍然佔據著相當大的市場佔有率,這些計劃共同資金籌措設備升級。歐盟的「數位產品護照」要求透過感測器網路追蹤材料的來源資訊。本地供應商正在推廣開放式架構平台,以保護數位主權並減少對歐盟以外雲端服務的依賴。北歐國家優先考慮節能運營,而南歐國家則利用重建資金實現自動化現代化。在中東,沙烏地阿拉伯和阿拉伯聯合大公國正主導多元化發展計劃,打造配備私人5G網路的先進製造園區。在非洲,南非正在通訊基礎設施穩定的地區試行智慧工廠維修,為鄰國樹立榜樣。
其他好處:
- Excel格式的市場預測(ME)表
- 3個月的分析師支持
目錄
第1章:引言
- 研究假設和市場定義
- 調查範圍
第2章:調查方法
第3章執行摘要
第4章 市場狀況
- 市場概覽
- 市場促進因素
- 德國和日本製造業領域5G和LPWAN私有化部署現狀
- 歐盟和美國的數位溯源法規正在推動感測器的應用。
- 需要嵌入式物聯網測量的設備即服務模式(北美)
- 澳洲和加拿大強制要求在工作場所穿戴穿戴式安全設備
- 面向即時決策的邊緣雲混合分析
- 用於流程最佳化的數位孿生整合
- 市場限制因素
- 印度老舊工廠的IPv4位址耗盡
- 用於改裝乙太網路應用的TSN認證晶片組供不應求
- 與老舊控制系統整合的複雜性
- 高階產業分析技能差距
- 價值鏈分析
- 監管和技術展望
- 波特五力分析
第5章 市場規模與成長預測
- 按組件
- 硬體
- 感測器和執行器
- RFID和BLE標籤
- 工業閘道器和邊緣設備
- PLC和工業用電腦
- 軟體
- 設備和網路管理
- 數據管理與分析
- 應用程式安全
- 服務
- 專業諮詢
- 系統整合與部署
- 託管服務
- 硬體
- 透過連接技術
- 有線
- 工業乙太網(Profinet、EtherCAT、Modbus-TCP)
- 時間敏感網路(TSN)
- 無線的
- Wi-Fi 6/6E
- 蜂窩網路(4G/LTE、5G)
- LPWAN(NB-IoT、Cat-M、LoRa)
- 短程通訊(藍牙低功耗、Zigbee)
- 衛星和高空平台
- 有線
- 按部署模式
- 現場
- 雲
- 混合/邊緣雲
- 透過使用
- 預測性保護
- 最佳化資產性能和設備綜合效率
- 製程和能源最佳化
- 勞動力和安全管理
- 供應鍊和物流可視性
- 品質與合規性分析
- 按最終用戶行業分類
- 汽車和電動汽車製造
- 電子和半導體
- 食品/飲料/快速消費品
- 化學與材料
- 重型機械和工業設備
- 製藥和生命科學
- 金屬和採礦
- 其他(紡織、紙漿和造紙等)
- 按地區
- 北美洲
- 美國
- 加拿大
- 南美洲
- 巴西
- 阿根廷
- 其他南美國家
- 歐洲
- 德國
- 英國
- 法國
- 義大利
- 西班牙
- 其他歐洲國家
- 中東
- UAE
- 沙烏地阿拉伯
- 南非
- 亞太地區
- 中國
- 日本
- 印度
- 韓國
- 其他亞太國家
- 北美洲
第6章 競爭情勢
- 市場集中度
- 策略性舉措和併購
- 市佔率分析
- 公司簡介
- Cisco Systems Inc.
- Siemens AG
- IBM Corporation
- Microsoft Corporation
- SAP SE
- PTC Inc.
- Schneider Electric SE
- Honeywell International Inc.
- Rockwell Automation Inc.
- Bosch Rexroth AG
- ABB Ltd.
- GE Digital(General Electric)
- Emerson Electric Co.
- Mitsubishi Electric Corp.
- Hitachi Vantara LLC
- Huawei Technologies Co. Ltd.
- Advantech Co. Ltd.
- Fanuc Corp.
- Hexagon AB
- Dassault Systemes SE
- Oracle Corp.
- Fujitsu Ltd.
- Yokogawa Electric Corp.
- Zebra Technologies Corp.
第7章 市場機會與未來展望
According to Mordor Intelligence, the internet of Things in the manufacturing market size is expected to grow from USD 0.49 trillion in 2025 to USD 0.61 trillion in 2026 and is forecast to reach USD 1.86 trillion by 2031 at 24.87% CAGR over 2026-2031.
This report is Segmented by Component (Hardware, Software, and Services), Connectivity Technology (Wires and Wireless), Deployment Model (On-Premise, Cloud, and More), Application (Predictive Maintenance, Asset Performance and OEE Optimisation, and More), End-User Vertical (Automotive and EV Manufacturing, Electronics and Semiconductors, and More), and Geography
Global Internet-of-Things in Manufacturing Market Trends and Insights
Private 5G and LPWAN roll-outs in German and Japanese discrete factories
The introduction of private 5G and LPWAN networks is transforming production floors in Germany and Japan. Latency below 10 ms for 99.99% of packets supports time-critical robotic cells, while network slicing guarantees deterministic performance for quality-inspection cameras. Automotive manufacturers adopting 5G testbeds report productivity jumps of up to 245% and operating-cost cuts of as much as 90% thanks to predictive maintenance and automated re-work loops. Edge servers attached to the private networks enable on-site analytics, removing cloud round-trips and maintaining data sovereignty.
EU/US digital-traceability mandates driving sensor adoption
The EU Digital Product Passport and comparable US rules require serialised, life-cycle data for every industrial good. Manufacturers are embedding IoT sensors to log provenance, composition, and process parameters automatically. Early movers achieve 25% fewer unplanned stoppages and 30% leaner inventory because live material flow is visible across sites.Beyond compliance, the same infrastructure feeds continuous-improvement dashboards that expose bottlenecks for immediate remediation.
IPv4 address exhaustion in legacy Indian plants
Brownfield facilities rely on outdated control systems that cannot accommodate the flood of new devices. IPv4 blocks are depleted, and IPv6 upgrades cost on average USD 2.4 million per large enterprise, including firmware, training, and downtime allowances. These expenses and integration hurdles delay broad-scale sensor roll-outs in India's fast-growing manufacturing corridor.
Other drivers and restraints analyzed in the detailed report include:
- Equipment-as-a-Service models requiring embedded IoT metering
- Workforce-safety wearables mandated in Australia and Canada
- Shortage of TSN-certified chipsets for retrofit Ethernet
For complete list of drivers and restraints, kindly check the Table Of Contents.
Segment Analysis
Software held 50.60% of the Internet of Things in manufacturing market share in 2025 and remains the intelligence layer that converts raw sensor streams into actionable recommendations. Device-management platforms dominate because factories need secure onboarding, firmware updates, and policy enforcement for thousands of heterogeneous nodes. Analytics engines form the fastest-growing niche, reflecting demand for failure prediction, asset performance insights, and adaptive process controls. Services revenue is set to outpace both hardware and software with a 22.95% CAGR from 2026-2031, as integrators orchestrate complex retrofits and training programs. Gateways and industrial PCs still underpin the edge tier, while sensor unit prices continue to decline and unlock new measurement points.Hardware remains indispensable for physical sensing and actuation, yet the investment focus is shifting toward flexible subscription-based software stacks.
System integrators now assemble composable building blocks sourced from broad ecosystems rather than monolithic suites. That shift improves interoperability and accelerates proof-of-concept deployments. Cybersecurity modules are bundled with every new software drop because attack surfaces grow with device counts. Manufacturers increasingly rely on managed-service partners for 24/7 monitoring and zero-day patching, tightening the link between recurring software fees and guaranteed line availability.
Wireless links captured 63.40% of connectivity revenue in 2025. Within the basket, 5G is forecast to surge at a 37.8% CAGR because its blend of 1 Gb/s throughput, sub-10 ms latency, and network slicing supports machine vision, mobile robots, and AR-assisted maintenance. LPWAN variants such as NB-IoT and LoRaWAN address energy-constrained sensors that transmit small packets at kilometre-scale range. The wired backbone keeps a firm role where electromagnetic interference is high or deterministic behaviour is mandatory; TSN upgrades extend standard Ethernet to micro-second synchronisation.The coexistence of 5G and deterministic Ethernet inside the same plant enables tiered service levels without duplicated cabling.
Short-range Bluetooth LE modules cost pennies and fill specialised roles like tool-identification tags or operator location services. Emerging 5G-TSN convergence profiles promise single-network coverage for both motion-control loops and cloud back-haul, simplifying switch cabinets. Yet silicon shortages and certification queues slow adoption of these advanced chips, highlighting the importance of multi-path architectures that can fall back to legacy protocols during supply crunches.
Complete Report Scope:
- By Component
- Hardware
- Sensors and Actuators
- RFID and BLE Tags
- Industrial Gateways and Edge Devices
- PLCs and Industrial PCs
- Software
- Device and Network Management
- Data Management and Analytics
- Application Security
- Services
- Professional Consulting
- System Integration and Deployment
- Managed Services
- Hardware
- By Connectivity Technology
- Wired
- Industrial Ethernet (Profinet, EtherCAT, Modbus-TCP)
- Time-Sensitive Networking (TSN)
- Wireless
- Wi-Fi 6/6E
- Cellular (4G/LTE, 5G)
- LPWAN (NB-IoT, Cat-M, LoRa)
- Short-Range (Bluetooth LE, Zigbee)
- Satellite and High-Altitude Platforms
- Wired
- By Deployment Model
- On-Premise
- Cloud
- Hybrid / Edge-Cloud
- By Application
- Predictive Maintenance
- Asset Performance and OEE Optimisation
- Process and Energy Optimisation
- Workforce and Safety Management
- Supply-Chain and Logistics Visibility
- Quality and Compliance Analytics
- By End-User Vertical
- Automotive and EV Manufacturing
- Electronics and Semiconductors
- Food, Beverage and FMCG
- Chemicals and Materials
- Heavy Machinery and Industrial Equipment
- Pharmaceuticals and Life-Sciences
- Metals and Mining
- Others (Textiles, Pulp and Paper, etc.)
- By Geography
- North America
- United States
- Canada
- South America
- Brazil
- Argentina
- Rest of South America
- Europe
- Germany
- United Kingdom
- France
- Italy
- Spain
- Rest of Europe
- Middle East
- UAE
- Saudi Arabia
- South Africa
- Asia Pacific
- China
- Japan
- India
- South Korea
- Rest of Asia Pacific
- North America
Geography Analysis
North America generated 32.95% of 2025 revenue for the Internet of Things in manufacturing market. Early adoption, strong industrial IT ecosystems, and tax incentives for automation propel deployments. US factories deploy IoT to offset skilled-labor shortages and to reclaim reshored product lines. OEMs increasingly integrate metering hardware to support usage-based rental models, deepening supplier-customer ties while smoothing cash-flow.
Asia Pacific is projected to grow at a 25.18% CAGR from 2026-2031, the fastest worldwide. China funds nationwide smart-manufacturing parks, while Japan blends 5G with robotics to maintain output despite demographic decline. India's digital-factory programs advance, yet IPv4 exhaustion in brownfield sites slows hyperscale roll-outs until affordable IPv6 gateways arrive. South Korea leverages its telecom infrastructure to pilot 5G-enabled cobots and AI-powered quality control on high-end electronics lines.Europe maintains a sizable share as Germany's Industrie 4.0, France's Alliance Industrie du Futur, and Italy's Transition 4.0 incentives co-finance upgrades. The EU Digital Product Passport requirement compels sensor networks to capture materials genealogy. Local vendors champion open-architecture platforms that protect digital sovereignty and reduce dependence on non-EU clouds. Nordics prioritize energy-efficient operations, while Southern Europe channels recovery funds into automation modernisation. The Middle East, led by Saudi Arabia and the UAE, channels diversification plans into advanced manufacturing zones equipped with campus-wide private 5G. In Africa, South Africa pilots smart-plant retrofits where connectivity is stable, setting precedents for neighbouring economies.
- Cisco Systems Inc.
- Siemens AG
- IBM Corporation
- Microsoft Corporation
- SAP SE
- PTC Inc.
- Schneider Electric SE
- Honeywell International Inc.
- Rockwell Automation Inc.
- Bosch Rexroth AG
- ABB Ltd.
- GE Digital (General Electric)
- Emerson Electric Co.
- Mitsubishi Electric Corp.
- Hitachi Vantara LLC
- Huawei Technologies Co. Ltd.
- Advantech Co. Ltd.
- Fanuc Corp.
- Hexagon AB
- Dassault Systemes SE
- Oracle Corp.
- Fujitsu Ltd.
- Yokogawa Electric Corp.
- Zebra Technologies Corp.
Additional Benefits:
- The market estimate (ME) sheet in Excel format
- 3 months of analyst support
TABLE OF CONTENTS
1 INTRODUCTION
- 1.1 Study Assumptions and Market Definition
- 1.2 Scope of the Study
2 RESEARCH METHODOLOGY
3 EXECUTIVE SUMMARY
4 MARKET LANDSCAPE
- 4.1 Market Overview
- 4.2 Market Drivers
- 4.2.1 Private 5G and LPWAN Roll-outs in German and Japanese Discrete Factories
- 4.2.2 EU/US Digital-Traceability Mandates Driving Sensor Adoption
- 4.2.3 Equipment-as-a-Service Models Requiring Embedded IoT Metering (N. America)
- 4.2.4 Workforce-Safety Wearables Mandated in Australia and Canada
- 4.2.5 Edge-cloud Hybrid Analytics for Real-time Decision-making
- 4.2.6 Digital-twin Integration for Process Optimization
- 4.3 Market Restraints
- 4.3.1 IPv4 Address Exhaustion in Legacy Indian Plants
- 4.3.2 Shortage of TSN-Certified Chipsets for Retrofit Ethernet
- 4.3.3 Integration Complexity with Aging Control Systems
- 4.3.4 Skills Gap in Advanced Industrial Analytics
- 4.4 Value Chain Analysis
- 4.5 Regulatory and Technological Outlook
- 4.6 Porter's Five Forces Analysis
- 4.6.1 Bargaining Power of Suppliers
- 4.6.2 Bargaining Power of Buyers
- 4.6.3 Threat of New Entrants
- 4.6.4 Threat of Substitutes
- 4.6.5 Intensity of Competitive Rivalry
5 MARKET SIZE AND GROWTH FORECASTS (VALUE)
- 5.1 By Component
- 5.1.1 Hardware
- 5.1.1.1 Sensors and Actuators
- 5.1.1.2 RFID and BLE Tags
- 5.1.1.3 Industrial Gateways and Edge Devices
- 5.1.1.4 PLCs and Industrial PCs
- 5.1.2 Software
- 5.1.2.1 Device and Network Management
- 5.1.2.2 Data Management and Analytics
- 5.1.2.3 Application Security
- 5.1.3 Services
- 5.1.3.1 Professional Consulting
- 5.1.3.2 System Integration and Deployment
- 5.1.3.3 Managed Services
- 5.1.1 Hardware
- 5.2 By Connectivity Technology
- 5.2.1 Wired
- 5.2.1.1 Industrial Ethernet (Profinet, EtherCAT, Modbus-TCP)
- 5.2.1.2 Time-Sensitive Networking (TSN)
- 5.2.2 Wireless
- 5.2.2.1 Wi-Fi 6/6E
- 5.2.2.2 Cellular (4G/LTE, 5G)
- 5.2.2.3 LPWAN (NB-IoT, Cat-M, LoRa)
- 5.2.2.4 Short-Range (Bluetooth LE, Zigbee)
- 5.2.3 Satellite and High-Altitude Platforms
- 5.2.1 Wired
- 5.3 By Deployment Model
- 5.3.1 On-Premise
- 5.3.2 Cloud
- 5.3.3 Hybrid / Edge-Cloud
- 5.4 By Application
- 5.4.1 Predictive Maintenance
- 5.4.2 Asset Performance and OEE Optimisation
- 5.4.3 Process and Energy Optimisation
- 5.4.4 Workforce and Safety Management
- 5.4.5 Supply-Chain and Logistics Visibility
- 5.4.6 Quality and Compliance Analytics
- 5.5 By End-User Vertical
- 5.5.1 Automotive and EV Manufacturing
- 5.5.2 Electronics and Semiconductors
- 5.5.3 Food, Beverage and FMCG
- 5.5.4 Chemicals and Materials
- 5.5.5 Heavy Machinery and Industrial Equipment
- 5.5.6 Pharmaceuticals and Life-Sciences
- 5.5.7 Metals and Mining
- 5.5.8 Others (Textiles, Pulp and Paper, etc.)
- 5.6 By Geography
- 5.6.1 North America
- 5.6.1.1 United States
- 5.6.1.2 Canada
- 5.6.2 South America
- 5.6.2.1 Brazil
- 5.6.2.2 Argentina
- 5.6.2.3 Rest of South America
- 5.6.3 Europe
- 5.6.3.1 Germany
- 5.6.3.2 United Kingdom
- 5.6.3.3 France
- 5.6.3.4 Italy
- 5.6.3.5 Spain
- 5.6.3.6 Rest of Europe
- 5.6.4 Middle East
- 5.6.4.1 UAE
- 5.6.4.2 Saudi Arabia
- 5.6.4.3 South Africa
- 5.6.5 Asia Pacific
- 5.6.5.1 China
- 5.6.5.2 Japan
- 5.6.5.3 India
- 5.6.5.4 South Korea
- 5.6.5.5 Rest of Asia Pacific
- 5.6.1 North America
6 COMPETITIVE LANDSCAPE
- 6.1 Market Concentration
- 6.2 Strategic Moves and MandA
- 6.3 Market Share Analysis
- 6.4 Company Profiles (includes Global level Overview, Market level overview, Core Segments, Financials, Strategic Info, Market Rank/Share, Products and Services, Recent Developments)
- 6.4.1 Cisco Systems Inc.
- 6.4.2 Siemens AG
- 6.4.3 IBM Corporation
- 6.4.4 Microsoft Corporation
- 6.4.5 SAP SE
- 6.4.6 PTC Inc.
- 6.4.7 Schneider Electric SE
- 6.4.8 Honeywell International Inc.
- 6.4.9 Rockwell Automation Inc.
- 6.4.10 Bosch Rexroth AG
- 6.4.11 ABB Ltd.
- 6.4.12 GE Digital (General Electric)
- 6.4.13 Emerson Electric Co.
- 6.4.14 Mitsubishi Electric Corp.
- 6.4.15 Hitachi Vantara LLC
- 6.4.16 Huawei Technologies Co. Ltd.
- 6.4.17 Advantech Co. Ltd.
- 6.4.18 Fanuc Corp.
- 6.4.19 Hexagon AB
- 6.4.20 Dassault Systemes SE
- 6.4.21 Oracle Corp.
- 6.4.22 Fujitsu Ltd.
- 6.4.23 Yokogawa Electric Corp.
- 6.4.24 Zebra Technologies Corp.
7 MARKET OPPORTUNITIES AND FUTURE OUTLOOK
- 7.1 White-space and Unmet-need Assessment

 人工智慧驅動的工業流程最佳化市場預測至2034年:全球解決方案類型、組件、人工智慧技術、流程類型、應用、最終用戶和區域分析
 製造業物聯網市場-2026-2032年全球市場預測智慧流程最佳化市場預測至2034年-按組件、技術、產業、應用、最終用戶和地區分類的全球分析基於人工智慧的流程最佳化市場預測至2034年—按組件、部署模式、企業規模、應用、最終用戶和地區分類的全球分析
 製造業物聯網市場-全球產業規模、佔有率、趨勢、機會與預測:按組件、應用領域、最終用戶、地區和競爭格局分類,2021-2031年
 物聯網市場追蹤調查:製造業
 製造業物聯網市場:依軟體、連接方式、服務、應用、最終用戶產業和地區分類
 2026年全球製造業物聯網市場報告
 物聯網市場分析及預測(至2035年),涵蓋製造業領域,依類型、產品類型、服務、技術、組件、應用、部署類型、最終用戶及解決方案進行分類。
 全球流程最佳化人工智慧市場(2025-2029)