


 |
市場調查報告書
商品編碼
2073605
磷肥:市佔率分析、產業趨勢與統計、成長預測(2026-2031)Phosphatic Fertilizer - Market Share Analysis, Industry Trends & Statistics, Growth Forecasts (2026 - 2031) |
||||||

※ 本網頁內容可能與最新版本有所差異。詳細情況請與我們聯繫。
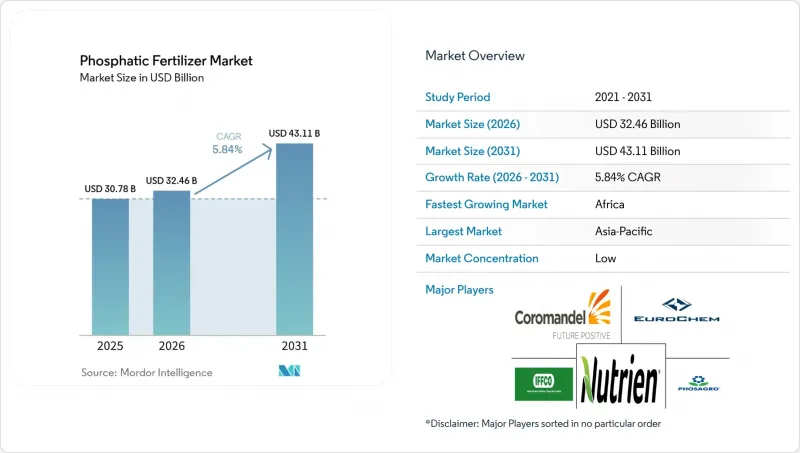
根據 Mordor Intelligence 預測,磷酸鹽肥料市場規模將從 2025 年的 307.8 億美元成長到 2026 年的 324.6 億美元,然後在 2031 年達到 431.1 億美元,2026 年至 2031 年的複合年成長率為 5.8%。
本報告按類型(單一肥料)、施用方法(施肥/灌溉、葉面噴布等)、作物類型(田間作物、園藝作物等)和地區(亞太地區、歐洲、南美洲、北美洲等)進行細分。市場預測以價值(美元)和數量(公噸)表示。
全球磷肥市場趨勢與洞察
高濃度肥料(磷酸二銨/磷酸一銨)的使用正在迅速增加。
目前,運輸成本佔偏遠地區化肥總成本的20%之多,迫使生產商轉向使用磷酸二銨(DAP)和磷酸一銨(MAP),這兩種肥料的每噸五氧化二磷(P₂O₅)含量是過磷酸鈣的1.7至2倍。這種轉變在巴西大豆種植帶尤其明顯,當地的合作社正在整合倉儲設施,主要用於儲存高濃度肥料,以降低運輸成本。柴油價格上漲進一步提升了物流成本的節省效果,而高濃度肥料還能減少包裝廢棄物。這一優勢與許多地區日益嚴格的環境法規相契合。貿易商擴大簽訂DAP期貨合約,以對沖運費市場的波動,而經銷商則表示,由於轉向高濃度產品,庫存持有成本降低了兩位數。在全球範圍內,垂直整合磷酸鹽資產的生產商能夠快速切換產品線以滿足高階市場需求,從而享受成本優勢。因此,在磷酸鹽肥料市場,DAP/MAP 的銷售量成長比總噸位的成長更為強勁,這不僅表明消費量增加,而且表明產品組合也在不斷變化。
對亞太地區政府補助的審查
在印度,直接補貼計畫(DBT)每年將144億美元的資金從特定產品補貼轉移到以農民為中心的獎勵金上,以促進平衡型氮磷鉀複合肥(NPK)的推廣應用,這類肥料通常磷含量較高。中國的「十四五」規劃將激勵措施與磷肥利用效率目標掛鉤,獎勵精密設備和低鎘原料的生產商。這些政策正在影響全球供需趨勢,因為國際供應商必須調整產能,以滿足亞太地區對磷酸二銨(DAP)和三聚磷酸鈉(TSP)等肥料的需求。每次補貼發放都會帶來短期銷售量激增,迫使進口商在周期早期就建立庫存。從長遠來看,隨著農民因永續農業實踐而獲得直接現金補貼,而非統一的價格支持,添加緩釋劑和生物添加劑的高級產品將獲得更大的定價權。對生產者而言,對亞太地區政策進行根本性檢討將擴大其技術優勢產品線的獲利能力提升潛力,進而加速整個磷肥市場的研發投入。
磷礦石價格波動
摩洛哥和中國這兩個控制全球大部分磷礦石貿易的國家實施的出口限制,導致2024年磷礦石價格季度波動幅度高達40%至60%。摩洛哥OCP集團控制著75%的已探明蘊藏量,並正在調整其自主運輸速度以平衡國內煉油管。同時,中國為保障國內糧食安全,實施了配額制度。在巴西和印度等依賴進口的地區,不斷飆升的進口成本正在擠壓農民的利潤,並導致需求在最後一刻被不確定性阻礙了期貨合約的簽訂,限制了庫存融資,並在短期內使磷肥市場的複合年成長率下降了1.4個百分點。
細分市場分析
預計到2025年,磷酸二銨(DAP)將繼續保持在磷肥市場的主導地位,市佔率將達到39.4%。這一主導地位歸功於其氮磷比例均衡、對多種作物適用性廣以及在主要農業市場建立的完善分銷網路。由於其養分濃度高且養分輸送經濟高效,磷酸二銨被廣泛應用於穀物、油籽和經濟作物。此外,磷酸一銨和其他磷肥產品的需求持續成長,尤其是在集約化農業系統中,高效的磷肥管理對於作物生長和產量最佳化至關重要。
預計2026年至2031年間,三聚磷酸鈣(TSP)的複合年成長率將達到8.2%,成為成長最快的細分市場。其成長主要得益於其高磷濃度、與精準營養管理方案的兼容性以及在缺磷土壤地區日益普及。在環境法規日益嚴格的背景下,由於三聚磷酸鈣適用於高效肥料配方和特殊作物,因此越來越受歡迎。此外,銨聚磷酸鹽溶液、微量元素強化磷酸鹽和包膜磷肥等新興產品正在拓展種植者可選擇的磷肥供應範圍。在預測期內,製造商預計將專注於高分析值和高附加價值的磷酸鹽產品,透過提高養分利用效率、降低施用量和提高作物產量來推動市場成長。
區域分析
受中國和印度等主要農業國家強勁需求的推動,亞太地區預計到2025年將佔據磷肥市場最大佔有率,達到46.5%。政府支持的營養管理計劃、平衡施肥技術的廣泛應用以及對作物增產日益成長的需求,持續推動全部區域磷肥消費的成長。東南亞國家也對磷肥需求做出了顯著貢獻,因為水稻、棕櫚油和園藝作物種植者擴大採用高效磷肥產品來提高產量和養分利用率。因此,亞太地區仍是磷肥最大的區域市場。
預計非洲將成為成長最快的區域市場,2026年至2031年的複合年成長率將達到7.4%。這一成長主要得益於商業農業的擴張、對糧食安全投資的增加、化肥用量的增加以及穀物、園藝作物和出口導向經濟作物種植面積的擴大。中東地區在化肥產能、農業現代化計畫和灌溉農業系統的持續投資支持下,仍然是區域需求的關鍵驅動力。預計這些因素將在預測期內推動全部區域磷肥消費量的成長。
在北美,磷肥市場預計將保持穩定成長,這得益於精密農業技術的廣泛應用以及大規模玉米和大豆生產系統的持續需求。在歐洲,受農業市場日趨成熟、環境法規日益嚴格以及養分利用最佳化等因素的推動,磷肥市場預計將以相對溫和的速度擴張。同時,在南美洲,隨著大豆、玉米和甘蔗種植面積的擴大,尤其是在巴西和阿根廷,磷肥市場仍蘊藏著巨大的成長潛力,這將推動全部區域對磷肥的長期需求。
其他好處:
- Excel格式的市場預測(ME)表
- 3個月的分析師支持
目錄
第1章:引言
- 研究假設和市場定義
- 調查範圍
- 調查方法
第2章:本報告的內容
第3章:執行摘要和主要發現
第4章:主要產業趨勢
- 主要農作物種植面積
- 大田作物
- 園藝作物
- 平均施肥量
- 主要營養素
- 田間作物
- 園藝作物
- 主要營養素
- 配備灌溉設施的農田
- 法律規範
- 價值鍊和通路分析
- 市場促進因素
- 高營養肥料(磷酸二銨/磷酸一銨)的使用正在迅速增加。
- 對亞太地區政府補助的審查
- 特種作物對食品級磷酸鹽的需求增加
- 透過精密農業提高磷利用效率
- 採用緩釋磷酸鹽包衣
- 來自非洲的低鎘磷酸鹽岩供應增加
- 市場限制因素
- 磷礦石價格波動
- 歐盟嚴格的鎘含量管制措施導致成本上升。
- 向生物肥料和磷溶性微生物過渡
- 北美和歐盟因富營養化而實施的使用限制
第5章 市場規模與成長預測
- 類型
- 直的
- 磷酸鹽基
- DAP
- MAP
- SSP
- TSP
- 其他
- 磷酸鹽基
- 直的
- 使用方法
- 施肥和灌溉
- 葉面噴布
- 土壤
- 作物類型
- 田間作物
- 園藝作物
- 草坪和觀賞植物
- 地區
- 亞太地區
- 澳洲
- 孟加拉
- 中國
- 印度
- 印尼
- 日本
- 巴基斯坦
- 菲律賓
- 泰國
- 越南
- 其他亞太國家
- 歐洲
- 法國
- 德國
- 義大利
- 荷蘭
- 俄羅斯
- 西班牙
- 烏克蘭
- 英國
- 其他歐洲國家
- 北美洲
- 加拿大
- 墨西哥
- 美國
- 其他北美國家
- 南美洲
- 阿根廷
- 巴西
- 其他南美國家
- 中東
- 沙烏地阿拉伯
- 土耳其
- 阿拉伯聯合大公國
- 其他中東國家
- 非洲
- 埃及
- 奈及利亞
- 南非
- 其他非洲國家
- 亞太地區
第6章 競爭情勢
- 關鍵策略趨勢
- 市佔率分析
- 企業狀況
- 公司簡介
- PhosAgro PJSC
- EuroChem Group AG
- Nutrien Ltd.
- Coromandel International Limited
- CF Industries Holdings Inc.
- Indian Farmers Fertilizer Cooperative Limited(IFFCO)
- K+S Aktiengesellschaft
- Koch Fertilizer LLC
- SABIC Agri-Nutrients Company
- OCP Group
- The Mosaic Company
- ICL Group Ltd.
- Yara International ASA
- JR Simplot Company
- DAP Fertilizers Public Co.(KSA)
第7章 化肥產業執行長面臨的關鍵策略挑戰
According to Mordor Intelligence, the phosphatic fertilizer market size is projected to grow from USD 30.78 billion in 2025 to USD 32.46 billion in 2026 and is forecast to reach USD 43.11 billion by 2031 at 5.8% CAGR over 2026-2031.
This report is Segmented by Type (Straight), Application Mode (Fertigation, Foliar, and More), Crop Type (Field Crops, Horticultural Crops, and More), and Geography (Asia-Pacific, Europe, South America, North America, and More). The Market Forecasts are Provided in Terms of Value (USD) and Volume (Metric Tons).
Global Phosphatic Fertilizer Market Trends and Insights
Surge in High-Analysis Fertilizer (DAP/MAP) Adoption
Transportation now accounts for up to 20% of delivered fertilizer cost in remote areas, pushing growers toward DAP and MAP that pack 1.7-to-2.0-times more P2O5 per ton than single superphosphate. Brazil's soybean belt illustrates the shift as cooperatives consolidate storage around highly concentrated grades to reduce freight charges. Rising diesel prices amplify logistics savings, while concentrated grades also reduce packaging waste -a benefit that aligns with tightening environmental regulations in many regions. Traders increasingly lock forward contracts for DAP to hedge against volatile freight markets, and distributors report double-digit drops in inventory carrying costs after pivoting to high-analysis products. Global producers with vertically integrated phosphate rock assets enjoy a cost advantage because they can switch product slates quickly to capture premium demand. As a result, the phosphatic fertilizer market registers stronger volume gains for DAP/MAP than total tonnage growth suggests, indicating an ongoing shift in composition rather than mere consumption expansion.
Government Subsidy Realignment in Asia-Pacific
India's DBT program redirects USD 14.4 billion annually from product-specific subsidies to farmer-centric transfers, driving adoption of balanced NPK formulations that often include higher phosphorus shares. Chinese incentives under the 14th Five-Year Plan tie payments to phosphorus use efficiency targets, rewarding growers who deploy precision equipment and low-cadmium inputs. These policies affect global flows because international suppliers must recalibrate capacity toward Asia-Pacific-preferred grades such as DAP and TSP. Short-term volume spikes follow each subsidy tranche, compelling importers to secure inventory earlier in the cycle. Longer term, premium products with controlled release or biological additives gain pricing power as farmers receive direct cash for sustainable practices rather than blanket price supports. For manufacturers, the Asia-Pacific policy overhaul magnifies revenue upside for technology-rich offerings, thereby accelerating R&D investment across the phosphatic fertilizer market.
Phosphate Rock Price Volatility
Export restrictions from Morocco and China-the two nations controlling the bulk of globally traded phosphate rock triggered 40-60% quarter-on-quarter price swings during 2024. Morocco's OCP Group dominates 75% of known reserves and uses discretionary shipment pacing to balance its internal upgrade pipeline, while China imposes quotas to shield domestic food-security priorities. Import-dependent regions such as Brazil and India experience landing-cost spikes that compress farm profits and prompt last-minute demand deferrals. Futures markets for phosphate rock remain thin, leaving processors exposed to spot volatility and short-cycle credit risks. Manufacturers hedge by diversifying sources, yet logistics bottlenecks and ore-quality differentials limit substitution flexibility. The resulting uncertainty undermines forward contracting, constrains inventory financing, and subtracts 1.4 percentage points from the phosphatic fertilizer market CAGR in the immediate term.
Other drivers and restraints analyzed in the detailed report include:
- Rising Food-Grade Phosphate Demand for Specialty Crops
- Precision Farming Enabling Phosphorus Use Efficiency
- Stringent European Union Cadmium Limits Increasing Costs
For complete list of drivers and restraints, kindly check the Table Of Contents.
Segment Analysis
DAP (Diammonium Phosphate) held the largest share of the phosphatic fertilizer market, accounting for 39.4% in 2025. This dominance is attributed to its balanced nitrogen-phosphorus composition, broad applicability across various crops, and a well-established distribution network in major agricultural markets. DAP is extensively used in cereals, oilseeds, and commercial crops due to its high nutrient concentration and cost-effective nutrient delivery. Additionally, monoammonium phosphate and other phosphate-based products continue to drive demand, particularly in intensive farming systems where efficient phosphorus management is essential for crop establishment and yield optimization.
Triple superphosphate (TSP) is projected to be the fastest-growing segment, with a projected CAGR of 8.2% during 2026-2031. This growth is driven by its high phosphorus concentration, compatibility with precision nutrient management programs, and increasing adoption in regions with phosphorus-deficient soils. As environmental regulations become stricter, TSP is gaining popularity due to its suitability for enhanced-efficiency fertilizer formulations and applications in specialty crops. Furthermore, emerging products such as ammonium polyphosphate solutions, micronutrient-fortified phosphates, and coated phosphate fertilizers are broadening the range of phosphorus delivery options available to growers. Over the forecast period, manufacturers are projected to focus on high-analysis and value-added phosphate products, promoting market growth through improved nutrient-use efficiency, reduced application intensity, and enhanced crop productivity.
Complete Report Scope:
- Type
- Straight
- Phosphatic
- DAP
- MAP
- SSP
- TSP
- Others
- Phosphatic
- Straight
- Application Mode
- Fertigation
- Foliar
- Soil
- Crop Type
- Field Crops
- Horticultural Crops
- Turf & Ornamental
- Geography
- Asia-Pacific
- Australia
- Bangladesh
- China
- India
- Indonesia
- Japan
- Pakistan
- Philippines
- Thailand
- Vietnam
- Rest of Asia-Pacific
- Europe
- France
- Germany
- Italy
- Netherlands
- Russia
- Spain
- Ukraine
- United Kingdom
- Rest of Europe
- North America
- Canada
- Mexico
- United States
- Rest of North America
- South America
- Argentina
- Brazil
- Rest of South America
- Middle East
- Saudi Arabia
- Turkey
- United Arab Emirates
- Rest of Middle East
- Africa
- Egypt
- Nigeria
- South Africa
- Rest of Africa
- Asia-Pacific
Geography Analysis
Asia-Pacific accounted for the largest phosphatic fertilizer market share, 46.5% in 2025, driven by strong demand from major agricultural economies such as China and India. Government-supported nutrient management programs, increasing adoption of balanced fertilization practices, and rising crop productivity requirements continue to support phosphate fertilizer consumption across the region. Southeast Asian countries also contribute significantly to demand as rice, palm oil, and horticultural producers increasingly adopt high-efficiency phosphorus products to improve yields and nutrient-use efficiency. As a result, Asia-Pacific remains the largest regional market for phosphatic fertilizers.
Africa is anticipated to be the fastest-growing regional market, with a projected CAGR of 7.4% during 2026-2031. This growth is driven by the expansion of commercial agriculture, increased investments in food security initiatives, higher fertilizer application rates, and the rising cultivation of cereals, horticultural crops, and export-oriented cash crops. The Middle East remains a significant contributor to regional demand, supported by ongoing investments in fertilizer production capacity, agricultural modernization programs, and irrigated farming systems, which are projected to bolster phosphatic fertilizer consumption across the region during the forecast period.
North America is projected to witness steady growth, supported by widespread adoption of precision agriculture technologies and continued demand from large-scale corn and soybean production systems. Europe is anticipated to expand at a comparatively moderate pace due to mature agricultural markets, stringent environmental regulations, and nutrient-use optimization initiatives. Meanwhile, South America continues to offer attractive growth opportunities, supported by expanding soybean, corn, and sugarcane cultivation, particularly in Brazil and Argentina, reinforcing long-term phosphatic fertilizer demand across the region.
- PhosAgro PJSC
- EuroChem Group AG
- Nutrien Ltd.
- Coromandel International Limited
- CF Industries Holdings Inc.
- Indian Farmers Fertilizer Cooperative Limited (IFFCO)
- K+S Aktiengesellschaft
- Koch Fertilizer LLC
- SABIC Agri-Nutrients Company
- OCP Group
- The Mosaic Company
- ICL Group Ltd.
- Yara International ASA
- J.R. Simplot Company
- DAP Fertilizers Public Co. (KSA)
Additional Benefits:
- The market estimate (ME) sheet in Excel format
- 3 months of analyst support
TABLE OF CONTENTS
1 INTRODUCTION
- 1.1 Study Assumptions & Market Definition
- 1.2 Scope of the Study
- 1.3 Research Methodology
2 REPORT OFFERS
3 EXECUTIVE SUMMARY & KEY FINDINGS
4 KEY INDUSTRY TRENDS
- 4.1 Acreage Of Major Crop Types
- 4.1.1 Field Crops
- 4.1.2 Horticultural Crops
- 4.2 Average Nutrient Application Rates
- 4.2.1 Primary Nutrients
- 4.2.1.1 Field Crops
- 4.2.1.2 Horticultural Crops
- 4.2.1 Primary Nutrients
- 4.3 Agricultural Land Equipped For Irrigation
- 4.4 Regulatory Framework
- 4.5 Value Chain & Distribution Channel Analysis
- 4.6 Market Drivers
- 4.6.1 Surge in high-analysis fertilizer (DAP/MAP) adoption
- 4.6.2 Government subsidy realignment in Asia-Pacific
- 4.6.3 Rising food-grade phosphate demand for specialty crops
- 4.6.4 Precision farming enabling phosphorus use efficiency
- 4.6.5 Controlled-release phosphate coatings adoption
- 4.6.6 Low-cadmium African phosphate rock supply growth
- 4.7 Market Restraints
- 4.7.1 Phosphate rock price volatility
- 4.7.2 Stringent European Union cadmium limits increasing costs
- 4.7.3 Shift toward biofertilizers and P-solubilizing microbes
- 4.7.4 Eutrophication-driven application caps in North America and European Union
5 MARKET SIZE AND GROWTH FORECASTS (VALUE AND VOLUME)
- 5.1 Type
- 5.1.1 Straight
- 5.1.1.1 Phosphatic
- 5.1.1.1.1 DAP
- 5.1.1.1.2 MAP
- 5.1.1.1.3 SSP
- 5.1.1.1.4 TSP
- 5.1.1.1.5 Others
- 5.1.1.1 Phosphatic
- 5.1.1 Straight
- 5.2 Application Mode
- 5.2.1 Fertigation
- 5.2.2 Foliar
- 5.2.3 Soil
- 5.3 Crop Type
- 5.3.1 Field Crops
- 5.3.2 Horticultural Crops
- 5.3.3 Turf & Ornamental
- 5.4 Geography
- 5.4.1 Asia-Pacific
- 5.4.1.1 Australia
- 5.4.1.2 Bangladesh
- 5.4.1.3 China
- 5.4.1.4 India
- 5.4.1.5 Indonesia
- 5.4.1.6 Japan
- 5.4.1.7 Pakistan
- 5.4.1.8 Philippines
- 5.4.1.9 Thailand
- 5.4.1.10 Vietnam
- 5.4.1.11 Rest of Asia-Pacific
- 5.4.2 Europe
- 5.4.2.1 France
- 5.4.2.2 Germany
- 5.4.2.3 Italy
- 5.4.2.4 Netherlands
- 5.4.2.5 Russia
- 5.4.2.6 Spain
- 5.4.2.7 Ukraine
- 5.4.2.8 United Kingdom
- 5.4.2.9 Rest of Europe
- 5.4.3 North America
- 5.4.3.1 Canada
- 5.4.3.2 Mexico
- 5.4.3.3 United States
- 5.4.3.4 Rest of North America
- 5.4.4 South America
- 5.4.4.1 Argentina
- 5.4.4.2 Brazil
- 5.4.4.3 Rest of South America
- 5.4.5 Middle East
- 5.4.5.1 Saudi Arabia
- 5.4.5.2 Turkey
- 5.4.5.3 United Arab Emirates
- 5.4.5.4 Rest of Middle East
- 5.4.6 Africa
- 5.4.6.1 Egypt
- 5.4.6.2 Nigeria
- 5.4.6.3 South Africa
- 5.4.6.4 Rest of Africa
- 5.4.1 Asia-Pacific
6 COMPETITIVE LANDSCAPE
- 6.1 Key Strategic Moves
- 6.2 Market Share Analysis
- 6.3 Company Landscape
- 6.4 Company Profiles (Includes Global Level Overview, Market Level Overview, Core Business Segments, Financials, Key Information, Market Rank, Market Share, Products and Services, and Analysis of Recent Developments)
- 6.4.1 PhosAgro PJSC
- 6.4.2 EuroChem Group AG
- 6.4.3 Nutrien Ltd.
- 6.4.4 Coromandel International Limited
- 6.4.5 CF Industries Holdings Inc.
- 6.4.6 Indian Farmers Fertilizer Cooperative Limited (IFFCO)
- 6.4.7 K+S Aktiengesellschaft
- 6.4.8 Koch Fertilizer LLC
- 6.4.9 SABIC Agri-Nutrients Company
- 6.4.10 OCP Group
- 6.4.11 The Mosaic Company
- 6.4.12 ICL Group Ltd.
- 6.4.13 Yara International ASA
- 6.4.14 J.R. Simplot Company
- 6.4.15 DAP Fertilizers Public Co. (KSA)
7 KEY STRATEGIC QUESTIONS FOR FERTILIZER CEOS

 磷肥市場:全球市場預測,2026-2032年
 磷酸鹽肥料市場的市場規模、市場佔有率、成長率、全球產業分析、區域趨勢以及2026-2034年的預測磷肥市場:依產品類型、形態、技術、應用及通路分類-2026-2032年全球預測
 磷肥市場規模、佔有率和趨勢分析報告:按產品、應用、地區和細分市場分類(2026-2040 年)
 磷肥市場分析及預測(至2035年):類型、產品類型、應用、最終用戶、形態、技術、製程、安裝類型、功能、設備磷肥市場-2026-2031年預測磷肥市場-2026-2031年預測
 磷肥市場規模、佔有率及成長分析(按產品、應用及地區分類)-2026-2033年產業預測
 磷肥市場:全球產業分析、市場規模、佔有率、成長、趨勢與未來預測(2025-2032)