


 |
市場調查報告書
商品編碼
2073547
互聯企業:市場佔有率分析、產業趨勢與統計、成長預測(2026-2031)Connected Enterprise - Market Share Analysis, Industry Trends & Statistics, Growth Forecasts (2026 - 2031) |
||||||

※ 本網頁內容可能與最新版本有所差異。詳細情況請與我們聯繫。
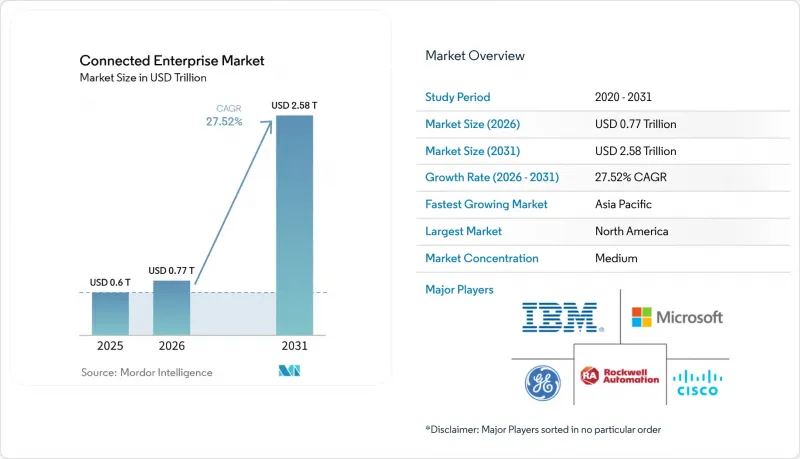
根據 Mordor Intelligence 估計,互聯企業市場在 2026 年的價值將達到 7,700 億美元,高於 2025 年的 6,000 億美元,預計到 2031 年將達到 2.58 兆美元。
預計 2026 年至 2031 年的複合年成長率為 27.52%。
本報告按交付方式(平台、解決方案、服務)、部署方式(本地部署、雲端部署、混合部署)、最終用戶產業(製造業、能源和公共產業等)、企業規模(大型企業、中小企業)、連接技術(Wi-Fi/乙太網路、蜂窩網路(4G/LTE)等)和地區進行細分。市場預測以價值(美元)表示。
全球互聯企業市場趨勢與洞察
工業IoT設備和感測器的激增
感測器的日益普及正在改變工廠的經濟模式。一家大型輪胎製造商透過將機器學習模型與現有設備整合,每天節省了1卡路里印度盧比(約12萬美元)的成本,並在不安裝任何新設備的情況下,將其乘用車輪胎的日產量從6.8萬條提高到7.3萬條。邊緣處理器可在現場完成回饋迴路,因此一旦偵測到異常情況,即可立即採取行動,無需等待與雲端的往返通訊。改裝套件比更換整套設備成本更低,使營運商能夠在延長設備使用壽命的同時,為預測性維護系統提供數據。設備製造商正在開發新的收入來源,透過將效能洞察轉化為訂閱服務來縮短硬體生命週期。感測器的廣泛應用是互聯企業市場成長的最大驅動力。
雲端原生應用程式和 iPaaS 擴充
企業正在將繁重的工作負載遷移到雲端原生架構,這些架構能夠跨區域自動化運行,並按需擴展運算能力。微軟智慧雲端部門在2025年第一季營收達424億美元,主要得益於工業IoT和分析工作負載的成長。整合平台即服務 (iPaaS) 整合了數百種營運技術 (OT) 協定和企業應用程式,能夠將物料可追溯性事件資訊即時反映到企業資源計劃 (ERP)、製造執行系統 (MES) 和運輸系統中。供應商現在銷售的是基於結果的契約,這些契約保證運作和節能效果,而非伺服器和許可證,從而將風險轉移給供應商,同時鞏固多年的收入來源。開放 API 正在緩解供應商鎖定問題,加速競爭性採購,並進一步推動互聯企業市場的發展。
棕地整合需要大量資本投資
為使用數十年的老舊機器加裝感測器、閘道器和安全遠端存取功能,會對資本預算造成沉重負擔。每台老舊設備的整合成本可能高達 12,000 美元,而同一地點往往有數十台甚至數百台這樣的機器在運作。中小企業缺乏內部先進的工程技術,不得不依賴昂貴的專業整合商,導致投資回報週期過長。各種工業協議的存在,使得多個閘道器和客製化中間件的共存成為必要,進一步擴大了專案規模。雖然模組化維修套件和開放介面標準正在興起以降低成本,但資金籌措障礙仍然是許多專案面臨的主要延誤因素。
細分市場分析
到2025年,解決方案在互聯企業市場收入中佔比將達到50.72%,主要得益於MES、EAM和CX套件的數位轉型。同時,平台正以30.12%的複合年成長率推動成長,因為企業在添加分析功能之前,優先投資於資料架構和設備管理層。預計到2026年,平台市場規模將成長491億美元,顯示投資重心正轉向骨幹網路。多租戶架構可望迅速擴大平台領域互聯企業市場的規模,因為供應商可以將研發成本分攤到各個客戶,同時為每個租戶提供獨立的資料邊界。服務領域雖然在絕對值上落後,但正朝著基於結果的模式轉型,性能風險由整合商承擔。以平台為中心的方法使企業能夠透過API整合AI推理、邊緣編配和威脅監控等功能,而無需進行全面的系統改造(即「堆高機式升級」)。設備生命週期管理平台簡化了超過 10 萬個設備的韌體更新,無需現場維護即可確保運作。隨著開放原始碼框架的日趨成熟,平台間的互通性不斷提升,使用戶能夠整合各種一流的分析工具,而無需「替換」現有的控制系統。這些變化增強了供應商生態系統,促進了專注於數據版本控制、數位雙胞胎編配或基於角色的工作流程配置等新興參與企業,並加劇了互聯企業市場的競爭。
在快速擴展和「按需收費」經濟模式的推動下,雲端運算的普及預計到2025年將佔53.02%的市場。然而,由於對延遲敏感和主權關鍵型工作負載的需求,對本地部署解決方案的需求再次激增,導致混合解決方案的複合年成長率達到30.86%。隨著工廠將響應時間低於50毫秒的本地邊緣節點與用於模型訓練的區域雲整合,由混合環境驅動的互聯企業市場到2031年規模可能達到1.14兆美元。平台供應商現在提供輕量級的Kubernetes堆疊,這些堆疊可在生產線旁運行PLC分析,並將匯總的遙測資料同步到聚合資料湖。混合架構降低了資料傳輸成本,因為只有選定的資料集會被發送到工廠外部,並且允許在監管審計(例如歐洲正在製定的人工智慧法律)中進行資料沿襲的現場驗證。這使得營運商能夠在不放棄控制權的情況下享受雲端的可擴展性。供應商正透過編配層實現差異化競爭,該編排層能夠自動將工作負載部署到符合運算、儲存、安全性和成本目標的位置。在整個預測期內,成功的解決方案將透過整合人工智慧來預測資源需求並自主重新分配容量,從而進一步推動互聯企業市場的發展。
區域分析
預計到2025年,北美將以36.62%的市佔率主導整個市場,這主要得益於早期私人5G試點計畫、大量的棕地維修以及對工業新創企業的強勁創業融資。聯邦政府對先進製造和清潔技術項目的獎勵正在推動電池工廠和半導體製造廠採用感測器。總部位於該地區的雲端超大規模資料中心業者透過提供人工智慧資料湖和低程式碼分析來支援價值鏈,從而縮短專案前置作業時間。諸如羅克韋爾自動化和微軟之間不斷擴大的合作關係等戰略協議,正在整合工廠控制和雲端推理,加速這一進程。
亞太地區正經歷更強勁的複合年成長率(CAGR),達到32.05%,這主要得益於持續的工業化進程和政府主導的智慧製造項目。中國大力推動價格競爭力強的自動化,刺激了本土原始設備製造商(OEM)的創新;而印度的生產連結獎勵計畫計畫(PLI)則鼓勵跨國公司建造互聯待開發區的全新工廠。目前,日本和韓國的都市區5G網路覆蓋率已達75%,使全無線工廠成為現實。區域通訊業者正在提供專用網路即服務(PNaaS),該服務整合了頻寬、邊緣運算和網路安全,降低了中型製造商的准入門檻。因此,預計到2029年,亞太地區互聯企業市場的支出將超過歐洲。
歐洲憑藉嚴格的ESG(環境、社會和治理)和網路安全法規,維持著強勁的市場佔有率。 《數位營運韌性法案》要求金融機構加強其OT/IT介面,而汽車OEM廠商則投資建造碳休閒孿生系統,以滿足範圍3報告的要求。這些法規推動了對安全且可審計的資料管道的需求,而這正是成熟互聯企業部署的標誌。同時,中東、非洲和南美洲仍在發展中,但潛力巨大。沿岸地區的能源公司正在試驗建造智慧煉油廠孿生系統,巴西的農產品正在人工林部署感測器,南非的礦業公司正在測試利用專用LTE網路的自動駕駛運輸系統。隨著基礎設施差距的縮小,這些地區將進一步推動互聯企業市場的成長,儘管它們目前尚未對三大洲的領先市場構成重大威脅。
其他好處:
- Excel格式的市場預測(ME)表
- 3個月的分析師支持
目錄
第1章:引言
- 研究假設和市場定義
- 調查範圍
第2章:調查方法
第3章執行摘要
第4章 市場狀況
- 市場概覽
- 市場促進因素
- 工業IoT設備和感測器的激增
- 雲端原生應用程式和 iPaaS 擴充
- 對即時供應鏈可視性的需求
- 實現確定性延遲的專用 5G 網路
- 由 GenAI 驅動的自主企業工作流程
- 用於排放報告的ESG相關數位雙胞胎
- 市場限制因素
- 棕地整合需要大量資本投資
- 網路安全人員短缺及攻擊面擴大
- 碎片化設備韌體更新的標準
- ESG審計中的資料所有權糾紛
- 產業價值鏈分析
- 監理情勢
- 技術展望
- 產業吸引力—五力分析
- 新進入者的威脅
- 買方的議價能力
- 供應商的議價能力
- 替代品的威脅
- 競爭公司之間的競爭
- 宏觀經濟因素對市場的影響
第5章 市場規模與成長預測
- 報價
- 平台
- 設備管理
- 連線管理
- 其他平台
- 解決方案
- 製造執行系統
- 企業基礎建設管理
- 客戶經驗管理
- 遠端監控系統
- 資產績效管理
- 其他解決方案(串流分析、行動工作人員、安全)
- 服務
- 管理
- 專業的
- 平台
- 部署模式
- 現場
- 雲
- 混合
- 按最終用戶行業分類
- 製造業
- 能源公用事業
- 石油和天然氣
- BFSI
- 零售與電子商務
- IT/通訊
- 其他終端用戶產業
- 按公司規模
- 大公司
- 中小企業
- 透過連接技術
- 無線/以太網
- 蜂窩網路(4G/LTE)
- 私有5G
- LPWAN(LoRaWAN、NB-IoT)
- 按地區
- 北美洲
- 美國
- 加拿大
- 墨西哥
- 南美洲
- 巴西
- 阿根廷
- 智利
- 其他南美國家
- 歐洲
- 德國
- 英國
- 法國
- 義大利
- 西班牙
- 俄羅斯
- 其他歐洲國家
- 亞太地區
- 中國
- 印度
- 日本
- 韓國
- 馬來西亞
- 新加坡
- 澳洲
- 其他亞太國家
- 中東和非洲
- 中東
- 阿拉伯聯合大公國
- 沙烏地阿拉伯
- 土耳其
- 其他中東國家
- 非洲
- 南非
- 奈及利亞
- 其他非洲國家
- 中東
- 北美洲
第6章 競爭情勢
- 市場集中度
- 策略趨勢
- 市佔率分析
- 公司簡介
- Microsoft Corporation
- IBM Corporation
- General Electric Company
- Cisco Systems, Inc.
- Rockwell Automation, Inc.
- Verizon Communications, Inc.
- Harman International Industries Ltd.
- Jacobs Solutions Inc.
- PTC Inc.
- Amazon Web Services, Inc.
- SAP SE
- Schneider Electric SE
- Siemens AG
- Honeywell International Inc.
- Oracle Corporation
- Fujitsu Ltd.
- Bosch Rexroth AG
- ABB Ltd.
- Ericsson AB
- Hitachi Vantara LLC
- Dell Technologies Inc.
- Huawei Technologies Co. Ltd.
- Zebra Technologies Corp.
- Emerson Electric Co.
- Dassault Systemes SE
第7章 投資分析
第8章 市場機會與未來趨勢
- 評估未開發的領域和未滿足的需求
According to Mordor Intelligence, connected enterprise market size in 2026 is estimated at USD 0.77 trillion, growing from 2025 value of USD 0.6 trillion with 2031 projections showing USD 2.58 trillion, growing at 27.52% CAGR over 2026-2031.
This report is Segmented by Offering (Platforms, Solutions, and Services), Deployment Mode (On-Premise, Cloud, and Hybrid), End-User Vertical (Manufacturing, Energy and Utilities, and More), Enterprise Size (Large Enterprises and Small and Medium Enterprises), Connectivity Technology (Wi-Fi/Ethernet, Cellular (4G/LTE), and More), and Geography. The Market Forecasts are Provided in Terms of Value (USD).
Global Connected Enterprise Market Trends and Insights
Proliferation of Industrial IoT Devices and Sensors
Mounting sensor deployments are rewriting factory economics. A leading tyre producer saved INR 1 crore (USD 120,000) daily by linking machine-learning models with legacy assets, then lifted daily passenger-tyre output from 68,000 to 73,000 units without new equipment. Edge processors close feedback loops locally, so anomalies trigger instant actions instead of waiting for round-trip cloud calls. Retrofit kits cost less than wholesale replacement, letting operators extend gear life while feeding predictive-maintenance engines. Equipment makers monetise performance insights as subscription services, unlocking fresh revenue that cushions hardware cycles. This widespread sensor adoption is the single biggest feedstock for connected enterprise market growth.
Cloud-Native Adoption and iPaaS Expansion
Enterprises are shifting heavy workloads to cloud-native stacks that auto-scale across regions and burst compute on demand. Microsoft's intelligent cloud segment logged USD 42.4 billion revenue in Q1 2025, buoyed by industrial IoT and analytics workloads. Integration Platform as a Service unifies hundreds of OT protocols with enterprise applications, allowing material-traceability events to update ERP, MES, and transport systems in real time. Vendors now sell outcome-based contracts that guarantee uptime or energy savings instead of selling servers or licences, shifting risk toward suppliers but cementing multiyear revenue. Open APIs reduce vendor lock-in and accelerate competitive sourcing, an added driver for the connected enterprise market.
High Capex for Brown-Field Integration
Retrofitting decades-old machinery with sensors, gateways, and secure remote access strains capital budgets. Integration can cost USD 12,000 per legacy asset, and each site runs dozens or hundreds of such machines. SMEs lack in-house engineering depth, so they rely on specialist integrators that charge premium rates, elongating payback cycles. Diverse industrial protocols inflate project scope because multiple gateways and custom middleware must coexist. Modular retrofit kits and open interface standards are emerging to curb spend, yet financing hurdles still delay many projects.
Other drivers and restraints analyzed in the detailed report include:
- Real-Time Supply-Chain Visibility Needs
- Private 5G Networks Enabling Deterministic Latency
- Cybersecurity Skills Shortage and Expanding Attack Surface
For complete list of drivers and restraints, kindly check the Table Of Contents.
Segment Analysis
Solutions held 50.72% of connected enterprise market revenue in 2025, led by MES, EAM, and CX suites that digitalize discrete functions. Platforms, however, headline growth at a 30.12% CAGR as firms invest first in data fabrics and device-management layers before layering analytics. In 2026, the platforms slice is forecast to add USD 49.1 billion, signalling a structural pivot toward backbone investments. The connected enterprise market size for platforms is projected to widen sharply because multi-tenant architectures let vendors amortize R&D across customers while still offering tenant-twinned data boundaries. Services trail in absolute dollars but shift to outcome guarantees, where integrators shoulder performance risk.A platform-centric play allows enterprises to plug in AI inference, edge orchestration, and threat monitoring by API rather than by forklift upgrade. Device-lifecycle platforms simplify firmware patching across 100,000-plus assets, protecting uptime without site visits. As open-source frameworks mature, platforms will interoperate, letting buyers mix best-of-breed analytics with incumbent control systems instead of a rip-and-replace scenario. These shifts reinforce vendor ecosystems and spur new entrants that specialise in data-versioning, digital-twin orchestration, or role-based workflow configuration, deepening competition inside the connected enterprise market.
Cloud deployments formed 53.02% of the value in 2025 due to rapid scaling and pay-as-you-grow economics. Nevertheless, latency-sensitive or sovereign workloads have rekindled on-premises needs, sparking a 30.86% CAGR in hybrid solutions. The connected enterprise market size attributable to hybrid estates could top USD 1.14 trillion by 2031 as factories blend local edge nodes for sub-50 ms response with regional clouds for model training. Platform vendors now ship lightweight Kubernetes stacks that run PLC analytics beside the line, then sync summarized telemetry to centralized lakes.Hybrid blueprints mitigate egress costs, as only curated datasets leave the plant, and regulatory audits -such as Europe's emerging AI Act -can verify lineage on site. Operators thus enjoy cloud elasticity without surrendering control. Suppliers are differentiating through orchestration layers that auto-place workloads wherever compute, storage, security, and cost targets align. Over the forecast, winning propositions will embed AI to forecast resource demand and rebalance capacity autonomously, further propelling the connected enterprise market.
Complete Report Scope:
- By Offering
- Platforms
- Device Management
- Connectivity Management
- Other Platforms
- Solutions
- Manufacturing Execution System
- Enterprise Infrastructure Management
- Customer Experience Management
- Remote Monitoring System
- Asset Performance Management
- Other Solutions (Streaming Analytics, Mobile Workforce, Security)
- Services
- Managed
- Professional
- Platforms
- By Deployment Mode
- On-premise
- Cloud
- Hybrid
- By End-user Vertical
- Manufacturing
- Energy and Utilities
- Oil and Gas
- BFSI
- Retail and E-Commerce
- IT and Telecommunications
- Other End-user Verticals
- By Enterprise Size
- Large Enterprises
- Small and Medium Enterprises (SMEs)
- By Connectivity Technology
- Wi-Fi/Ethernet
- Cellular (4G/LTE)
- Private 5G
- LPWAN (LoRaWAN, NB-IoT)
- By Geography
- North America
- United States
- Canada
- Mexico
- South America
- Brazil
- Argentina
- Chile
- Rest of South America
- Europe
- Germany
- United Kingdom
- France
- Italy
- Spain
- Russia
- Rest of Europe
- Asia-Pacific
- China
- India
- Japan
- South Korea
- Malaysia
- Singapore
- Australia
- Rest of Asia-Pacific
- Middle East and Africa
- Middle East
- United Arab Emirates
- Saudi Arabia
- Turkey
- Rest of Middle East
- Africa
- South Africa
- Nigeria
- Rest of Africa
- Middle East
- North America
Geography Analysis
North America dominated with a 36.62% share in 2025, buoyed by early private-5G pilots, ample brownfield retrofits, and robust venture funding into industrial startups. Federal incentives for advanced manufacturing and clean-tech projects drive sensor deployments in battery plants and semiconductor fabs. Cloud hyperscalers headquartered in the region feed the value chain with AI-ready data lakes and low-code analytics that compress project timelines. Strategic pacts such as Rockwell Automation's expanded alliance with Microsoft integrate factory control and cloud inferencing, accelerating adoption.
Asia-Pacific is on a steeper 32.05% CAGR curve, propelled by continued industrialization and state-led smart-manufacturing programs. China's push for price-competitive automation drives local OEM innovation, while India's Production-Linked Incentive schemes entice multinationals to build connected greenfield plants. 5G coverage now blankets 75% of urban zones across Japan and South Korea, enabling fully wireless factories. Regional operators market private-network-as-a-service offers that bundle spectrum, edge compute, and cybersecurity, lowering barriers for mid-tier manufacturers. As a result, the connected enterprise market is likely to see Asia-Pacific overtake Europe in spend before 2029.
Europe holds a solid share anchored by stringent ESG and cybersecurity mandates. The Digital Operational Resilience Act forces financial institutions to harden OT/IT interfaces, while automotive OEMs invest in carbon-ledger twins to meet Scope 3 reporting duties. These rules spur demand for secure, auditable data pipelines, a hallmark of mature connected enterprise deployments. Meanwhile, the Middle East, Africa, and South America remain nascent but promising. Gulf energy players trial smart-refinery twins, Brazilian agribusiness outfits sensorize plantations, and South African miners test autonomous haulage backed by private LTE. As infrastructure gaps close, these regions will add incremental growth to the connected enterprise market without yet challenging the tri-continental leaders.
- Microsoft Corporation
- IBM Corporation
- General Electric Company
- Cisco Systems, Inc.
- Rockwell Automation, Inc.
- Verizon Communications, Inc.
- Harman International Industries Ltd.
- Jacobs Solutions Inc.
- PTC Inc.
- Amazon Web Services, Inc.
- SAP SE
- Schneider Electric SE
- Siemens AG
- Honeywell International Inc.
- Oracle Corporation
- Fujitsu Ltd.
- Bosch Rexroth AG
- ABB Ltd.
- Ericsson AB
- Hitachi Vantara LLC
- Dell Technologies Inc.
- Huawei Technologies Co. Ltd.
- Zebra Technologies Corp.
- Emerson Electric Co.
- Dassault Systemes SE
Additional Benefits:
- The market estimate (ME) sheet in Excel format
- 3 months of analyst support
TABLE OF CONTENTS
1 INTRODUCTION
- 1.1 Study Assumptions and Market Definition
- 1.2 Scope of the Study
2 RESEARCH METHODOLOGY
3 EXECUTIVE SUMMARY
4 MARKET LANDSCAPE
- 4.1 Market Overview
- 4.2 Market Drivers
- 4.2.1 Proliferation of industrial IoT devices and sensors
- 4.2.2 Cloud-native adoption and iPaaS expansion
- 4.2.3 Real-time, supply-chain visibility needs
- 4.2.4 Private 5G networks enabling deterministic latency
- 4.2.5 GenAI-powered autonomous enterprise workflows
- 4.2.6 ESG-linked digital twins for emissions reporting
- 4.3 Market Restraints
- 4.3.1 High capex for brown-field integration
- 4.3.2 Cyber-security skills shortage and attack surface
- 4.3.3 Fragmented device-firmware-update standards
- 4.3.4 Data-ownership disputes in ESG audits
- 4.4 Industry Value Chain Analysis
- 4.5 Regulatory Landscape
- 4.6 Technological Outlook
- 4.7 Industry Attractiveness - Porter's Five Forces Analysis
- 4.7.1 Threat of New Entrants
- 4.7.2 Bargaining Power of Buyers/Consumers
- 4.7.3 Bargaining Power of Suppliers
- 4.7.4 Threat of Substitute Products
- 4.7.5 Intensity of Competitive Rivalry
- 4.8 Impact of Macroeconomic Factors on the Market
5 MARKET SIZE AND GROWTH FORECASTS (VALUES)
- 5.1 By Offering
- 5.1.1 Platforms
- 5.1.1.1 Device Management
- 5.1.1.2 Connectivity Management
- 5.1.1.3 Other Platforms
- 5.1.2 Solutions
- 5.1.2.1 Manufacturing Execution System
- 5.1.2.2 Enterprise Infrastructure Management
- 5.1.2.3 Customer Experience Management
- 5.1.2.4 Remote Monitoring System
- 5.1.2.5 Asset Performance Management
- 5.1.2.6 Other Solutions (Streaming Analytics, Mobile Workforce, Security)
- 5.1.3 Services
- 5.1.3.1 Managed
- 5.1.3.2 Professional
- 5.1.1 Platforms
- 5.2 By Deployment Mode
- 5.2.1 On-premise
- 5.2.2 Cloud
- 5.2.3 Hybrid
- 5.3 By End-user Vertical
- 5.3.1 Manufacturing
- 5.3.2 Energy and Utilities
- 5.3.3 Oil and Gas
- 5.3.4 BFSI
- 5.3.5 Retail and E-Commerce
- 5.3.6 IT and Telecommunications
- 5.3.7 Other End-user Verticals
- 5.4 By Enterprise Size
- 5.4.1 Large Enterprises
- 5.4.2 Small and Medium Enterprises (SMEs)
- 5.5 By Connectivity Technology
- 5.5.1 Wi-Fi/Ethernet
- 5.5.2 Cellular (4G/LTE)
- 5.5.3 Private 5G
- 5.5.4 LPWAN (LoRaWAN, NB-IoT)
- 5.6 By Geography
- 5.6.1 North America
- 5.6.1.1 United States
- 5.6.1.2 Canada
- 5.6.1.3 Mexico
- 5.6.2 South America
- 5.6.2.1 Brazil
- 5.6.2.2 Argentina
- 5.6.2.3 Chile
- 5.6.2.4 Rest of South America
- 5.6.3 Europe
- 5.6.3.1 Germany
- 5.6.3.2 United Kingdom
- 5.6.3.3 France
- 5.6.3.4 Italy
- 5.6.3.5 Spain
- 5.6.3.6 Russia
- 5.6.3.7 Rest of Europe
- 5.6.4 Asia-Pacific
- 5.6.4.1 China
- 5.6.4.2 India
- 5.6.4.3 Japan
- 5.6.4.4 South Korea
- 5.6.4.5 Malaysia
- 5.6.4.6 Singapore
- 5.6.4.7 Australia
- 5.6.4.8 Rest of Asia-Pacific
- 5.6.5 Middle East and Africa
- 5.6.5.1 Middle East
- 5.6.5.1.1 United Arab Emirates
- 5.6.5.1.2 Saudi Arabia
- 5.6.5.1.3 Turkey
- 5.6.5.1.4 Rest of Middle East
- 5.6.5.2 Africa
- 5.6.5.2.1 South Africa
- 5.6.5.2.2 Nigeria
- 5.6.5.2.3 Rest of Africa
- 5.6.5.1 Middle East
- 5.6.1 North America
6 COMPETITIVE LANDSCAPE
- 6.1 Market Concentration
- 6.2 Strategic Moves
- 6.3 Market Share Analysis
- 6.4 Company Profiles (includes Global level Overview, Market level overview, Core Segments, Financials as available, Strategic Information, Market Rank/Share for key companies, Products and Services, and Recent Developments)
- 6.4.1 Microsoft Corporation
- 6.4.2 IBM Corporation
- 6.4.3 General Electric Company
- 6.4.4 Cisco Systems, Inc.
- 6.4.5 Rockwell Automation, Inc.
- 6.4.6 Verizon Communications, Inc.
- 6.4.7 Harman International Industries Ltd.
- 6.4.8 Jacobs Solutions Inc.
- 6.4.9 PTC Inc.
- 6.4.10 Amazon Web Services, Inc.
- 6.4.11 SAP SE
- 6.4.12 Schneider Electric SE
- 6.4.13 Siemens AG
- 6.4.14 Honeywell International Inc.
- 6.4.15 Oracle Corporation
- 6.4.16 Fujitsu Ltd.
- 6.4.17 Bosch Rexroth AG
- 6.4.18 ABB Ltd.
- 6.4.19 Ericsson AB
- 6.4.20 Hitachi Vantara LLC
- 6.4.21 Dell Technologies Inc.
- 6.4.22 Huawei Technologies Co. Ltd.
- 6.4.23 Zebra Technologies Corp.
- 6.4.24 Emerson Electric Co.
- 6.4.25 Dassault Systemes SE
7 INVESTMENT ANALYSIS
8 MARKET OPPORTUNITIES AND FUTURE TRENDS
- 8.1 White-Space and Unmet-Need Assessment

 互聯企業市場:按組件、連接類型、產業、部署模式和組織規模分類-2026年至2032年全球預測
 2026年全球互聯企業市場報告
 互聯企業市場分析及預測(至2035年):依類型、產品類型、服務、技術、組件、應用、部署類型、最終用戶及功能分類
 互聯企業市場-2026-2031年預測
 互聯企業市場-全球產業規模、佔有率、趨勢、機會及預測(依產品/服務、類型、最終用戶、地區及競爭格局分類,2021-2031年預測)
 互聯企業市場規模、佔有率和成長分析(按組件、應用和地區分類)-2026-2033年產業預測全球互聯企業市場規模:按組件、類型、最終用戶、地區分類的範圍和預測
 互聯企業市場規模、佔有率、趨勢、行業分析報告(按組件、類型、最終用戶和地區)- 市場預測,2025-2034 年