


 |
市場調查報告書
商品編碼
2073542
機器人視覺:市場佔有率分析、產業趨勢與統計、成長預測(2026-2031)Robotic Vision - Market Share Analysis, Industry Trends & Statistics, Growth Forecasts (2026 - 2031) |
||||||

※ 本網頁內容可能與最新版本有所差異。詳細情況請與我們聯繫。
根據 Mordor Intelligence 預測,全球機器人視覺市場預計將在 2026 年達到 35.6 億美元,並在 2031 年擴大到 55.6 億美元,複合年成長率為 9.33%。
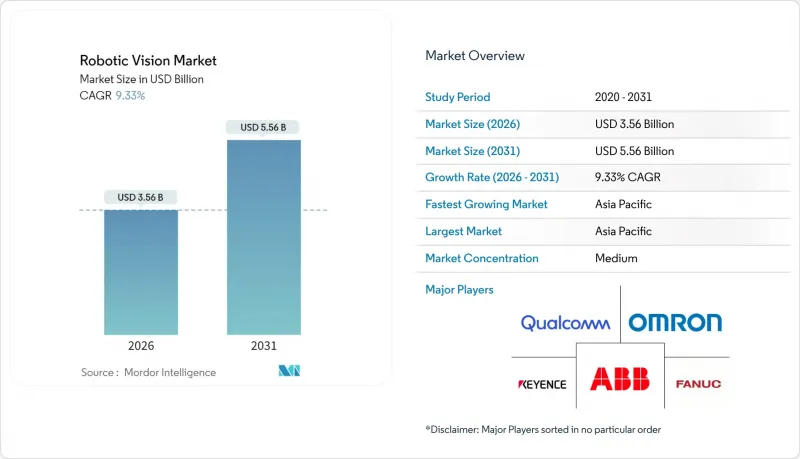
本報告按技術(2D視覺系統、3D視覺系統、頻譜/紅外線視覺等)、組件(硬體、軟體、服務)、機器人類型(工業機器人、無人機等)、應用(物料輸送、取放等)、終端用戶產業(汽車、農業等)和地區進行細分。市場預測以美元價值表示。
全球機器人視覺市場趨勢與洞察
人工智慧驅動的3D視覺技術在複雜組裝過程中的應用正在加速。
人工智慧嵌入式3D視覺技術使機器人能夠即時解讀深度、方向和表面紋理,從而實現電池、電路基板基板焊點的偵測精度,克服了2D相機的限制。英特爾Movidius和高通RB5等通用邊緣處理器現在可以以低於5瓦的功耗執行神經推理,消除了輕型協作機器人內部的散熱限制。隨著組件價格的下降,曾經比2D系統貴兩到三倍的3D系統,現在的價格僅高出50%,加速了引進週期。這項進展符合「零缺陷」的要求,將供應商獎金與每百萬件產品(ppm)的缺陷目標掛鉤。
政府為因應人手不足而採取的支持自動化措施
由於勞動參與率仍低於疫情前水平,已開發國家正面臨勞動人口短缺的困境。英國已向引進視覺協作機器人的工廠提供2.5億英鎊(約3.12億美元)的津貼,將投資回收期縮短至不到兩年。在日本,稅額扣抵已使食品加工和製藥業的中小型企業受益。德國已聯合出資5億歐元(約5.65億美元)用於支持中小企業引進視覺系統,優先考慮那些能夠取代重複性體力勞動的計畫。這些項目正在加快項目核准速度,鼓勵使用透明的人工智慧演算法,並將補貼導向能夠提供可解釋視覺模型的供應商。
與現有棕地生產線整合成本高昂
2010 年前建造的工廠很少具備適合攝影機叢集和邊緣伺服器的網路頻寬、電力佈線和實體佈局。一項 2025 年的調查顯示,65% 的北美汽車零件供應商面臨每條生產線視覺系統整合成本超過 50 萬美元的困境,其中近一半用於電氣和安全升級。歐洲工廠通常運作無法處理高解析度影像流的傳統 PLC,迫使它們採用成本高昂的平行控制架構。客製化攝影機和照明設備的支架需要數週的試運行,而低利潤率迫使許多供應商推遲項目,直到他們能夠徹底改造生產線。
細分市場分析
到2025年,2D系統將佔據機器人視覺市場56.73%的佔有率。這主要得益於相機成本的降低以及條碼和存在檢測軟體的成熟。由於電動車電池和半導體檢測需求的激增,3D深度感測技術正在迅速發展,預計到2031年將以10.32%的複合年成長率成長。在汽車生產線上,將基於CAD的檢測與點雲比較相結合,已將缺陷檢測率提高到99.9%。自2024年以來,飛行時間(ToF)感測器的價格大幅下降,使3D單元的總成本僅為2D替代方案的1.5倍。頻譜和紅外線選項在製藥和食品安全領域越來越受歡迎,因為它們可以檢測RGB無法檢測到的污染物。混合架構可在記錄高解析度 2D 影像的同時傳輸 3D 點雲數據,從而在一次掃描中實現“拾取”、“檢查”和“放置”,將週期時間縮短 20%。
人工智慧分析技術的廣泛應用正在進一步縮小效能差距。將神經網路與傳統濾波器結合的系統無需人工重新編程即可學習新的缺陷類型,從而最大限度地減少停機時間。物流業者正在將3D視覺技術整合到自主機器人中,以自動測量托盤尺寸並檢測懸垂部分,從而將裝載錯誤減少60%。隨著價格差異縮小和人工智慧工具鏈的簡化,3D視覺技術將滲透到中國、印度和東歐的中型工廠,從而鞏固機器人視覺市場持續成長的勢頭。
以攝影機、光學元件和處理器為核心的硬體在2025年佔銷售額的66.89%。面掃描感測器在2D領域佔據主導地位,而結構光和飛行時間(ToF)設備則應用於3D揀選。 NVIDIA Jetson等邊緣模組佔硬體支出的20-25%。同時,受「視覺即服務」(Vision-as-a-Service)普及的推動,軟體市場預計將以9.92%的複合年成長率成長至2031年。 「視覺即服務」結合了訂閱許可、模型學習與合成資料以及遠端校準。像康耐視(Cognex)這樣的供應商正在從永久許可轉向年度計劃,在保證持續更新的同時,將部署成本降低了60%。抽象硬體特定特性的中間件使整合商無需重寫程式碼即可更換感測器,從而緩解了供應商鎖定帶來的挑戰。
服務業正在迅速崛起,涵蓋系統設計、操作員培訓和人工智慧模型維護等領域。由於小規模工廠缺乏專職資料科學家,全託管服務包的市場佔有率正在不斷擴大,這一趨勢在北美尤為明顯,因為高昂的人事費用使得外包成為合理的選擇。在整個預測期內,軟體和服務業在機器人視覺市場的佔有率預計將逐年穩步成長,這表明其戰略重心正從硬體利潤率轉向持續的收入成長。
區域分析
預計到2025年,亞太地區將佔全球銷售額的47.91%,並將在2031年之前以10.37%的複合年成長率持續成長,這主要得益於中國「中國製造2025」戰略目標和韓國對半導體設備的投資。在日本,勞動力老化正在推動食品和製藥工廠採用協作機器人;而在印度,一項20億美元的獎勵計畫正在激勵電子產品製造商向視覺驅動的自動化轉型。澳洲的礦業公司正在引入視覺引導的自動駕駛卡車和鑽孔機,以減少工人面臨的危險。
北美地區雖然落後於其他地區,但受益於《通膨控制法案》提供的稅額扣抵,該法案正資助配備視覺技術的電池工廠建設。肯塔基州和德克薩斯州的美國物流中心正在維修其物流中心,配備攝影機自主移動機器人(AMR),以應對假期季節的訂單高峰。加拿大魁北克的航太產業叢集正在投資用於偵測複合材料的3D視覺技術,目標是將缺陷率降低到0.05ppm以下。
儘管面臨與現有設施整合的挑戰,歐洲仍扮演著至關重要的角色。一家德國一級汽車供應商計劃在2024年至2025年間投資15億歐元(17億美元)用於電池測試生產線。在英國,航太和製藥業正在引入自動化視覺引導處理技術,以應對英國脫歐後的勞動力短缺問題。波蘭和捷克等中歐國家透過提供自動化補貼和降低能源成本,吸引了大量近岸外包合約。
在中東、非洲、拉丁美洲以及小規模的地區,成長正從相對較小的基礎開始萌芽。在墨西哥,近岸外包帶來的200億美元收益,促使大量資金湧入配備視覺技術的線束工廠。一家巴西農業機械製造商已將視覺技術整合到自動收割機中,使操作成本降低了近一半。沙烏地阿拉伯的「2030願景」已撥款5億美元用於食品和石化產業的自動化,而採用視覺技術是獲得撥款的先決條件。在南非,視覺引導的礦石分分類機正在進行試點,在提高礦石品位的同時,也減少了安全事故。
其他好處:
- Excel格式的市場預測(ME)表
- 3個月的分析師支持
目錄
第1章:引言
- 研究假設和市場定義
- 調查範圍
第2章:調查方法
第3章執行摘要
第4章 市場狀況
- 市場概覽
- 市場促進因素
- 人工智慧驅動的3D視覺技術在複雜組裝過程中的應用正在加速。
- 政府為因應人手不足而推出的自動化獎勵措施
- 二級製造地中具備視覺功能的協作機器人迅速普及
- 邊緣AI晶片將延遲降低到10毫秒以內,從而實現高精度任務。
- 從 2025 年起實施的 ESG 法規將促進「零缺陷製造」。
- 視覺即服務的訂閱模式降低了前期成本。
- 市場限制因素
- 傳統棕地生產線的高整合成本
- 主要技術叢集以外的地區缺乏視覺和系統整合人才。
- 感測器和軟體標準不一致阻礙了互通性。
- 大量使用視覺系統的工廠面臨日益成長的網路安全合規成本。
- 產業價值鏈分析
- 監理情勢
- 技術展望
- 宏觀經濟因素對市場的影響
- 波特五力分析
第5章 市場規模與成長預測
- 透過技術
- 2D視覺系統
- 3D視覺系統
- 人工智慧驅動的視覺
- 頻譜/紅外線視覺
- 混合視覺架構
- 按組件
- 硬體
- 相機
- 感應器
- 處理器和邊緣模組
- 光學/照明
- 通訊模組
- 軟體
- 影像處理演算法
- 人工智慧/機器學習模型
- 視覺中介軟體
- 校準和仿真工具
- 服務
- 整合與工程
- 培訓和支持
- 維護和升級
- Vision-as-a-Service
- 硬體
- 按機器人類型
- 工業機器人
- 協作機器人(cobots)
- 移動機器人(AMR/AGV)
- 人形機器人
- 無人機
- 透過使用
- 物料輸送
- 組裝和拆卸
- 檢驗和品質保證
- 導引與導航
- 包裝和托盤堆垛
- 挑選和放置
- 焊接和釬焊
- 表面處理和塗裝
- 自適應任務和新的用例
- 按最終用戶行業分類
- 車
- 電子和半導體
- 食品/飲料
- 藥品和醫療保健
- 航太/國防
- 物流和倉儲
- 電子商務與零售
- 農業
- 能源公用事業
- 按地區
- 北美洲
- 美國
- 加拿大
- 墨西哥
- 歐洲
- 德國
- 英國
- 法國
- 俄羅斯
- 其他歐洲國家
- 亞太地區
- 中國
- 日本
- 印度
- 韓國
- 澳洲
- 其他亞太國家
- 中東和非洲
- 中東
- 沙烏地阿拉伯
- 阿拉伯聯合大公國
- 其他中東國家
- 非洲
- 南非
- 埃及
- 其他非洲國家
- 中東
- 南美洲
- 巴西
- 阿根廷
- 其他南美國家
- 北美洲
第6章 競爭情勢
- 市場集中度
- 策略趨勢
- 市佔率分析
- 公司簡介
- Cognex Corporation
- Keyence Corporation
- FANUC Corporation
- ABB Ltd.
- Omron Corporation
- Sick AG
- Teledyne DALSA Inc.
- Hexagon AB
- Basler AG
- Yaskawa Electric Corporation
- KUKA AG
- Denso Wave Incorporated
- Universal Robots A/S
- LMI Technologies Inc.
- Intel Corporation
- Qualcomm Technologies Inc.
- Nikon Metrology NV
- Matrox Imaging
- ISRA Vision AG
第7章 市場機會與未來展望
According to Mordor Intelligence, the global robotic vision market size reached USD 3.56 billion in 2026 and is forecast to climb to USD 5.56 billion by 2031, advancing at a 9.33% CAGR.
This report is Segmented by Technology (2D Vision Systems, 3D Vision Systems, Multispectral/Infrared Vision, and More), Component (Hardware, Software, and Services), Robot Type (Industrial Robots, Aerial Drones, and More), Application (Material Handling, Pick and Place, and More), End-User Industry (Automotive, Agriculture, and More), and Geography. The Market Forecasts are Provided in Terms of Value (USD).
Global Robotic Vision Market Trends and Insights
Accelerating adoption of AI-embedded 3D vision for complex assembly
AI-embedded 3D Vision lets robots interpret depth, pose, and surface texture in real time, enabling adaptive placement of battery cells, circuit boards, and molded plastics. Automotive plants in Germany and the United States cut battery-module scrap rates by up to 50% after switching from fixed jigs to 3D vision-guided placement. Electronics makers in China and South Korea improved solder-joint detection on curved substrates, overcoming 2D cameras. Commodity edge processors such as Intel Movidius and Qualcomm RB5 now execute neural inference at under 5 watts, eliminating heat constraints inside lightweight cobots. As component prices fall, 3D systems that once cost 2 to 3 times more than 2D alternatives now carry only a 50% premium, speeding replacement cycles. The advance aligns with zero-defect mandates that tie supplier bonuses to ppm defect targets.
Government incentives for automation amid labor shortages
Advanced economies face shrinking labor pools as participation rates remain below pre-pandemic levels. The United Kingdom awarded GBP 250 million (USD 312 million) in grants to factories integrating vision-equipped cobots, thereby trimming payback periods to under 2 years. Japan's tax credit covering 30% of vision-system outlays favored food-processing and drug-manufacturing SMEs. Germany co-funded EUR 500 million (USD 565 million) in vision deployments for Mittelstand firms, prioritizing projects that replace repetitive manual tasks. These programs accelerate project approvals, incentivize transparent AI algorithms, and channel subsidies to vendors offering explainable vision models.
High integration costs with legacy brown-field production lines
Plants built before 2010 seldom feature network bandwidth, power routing, or physical layouts suitable for camera clusters and edge servers. A 2025 survey showed that 65% of North American automotive suppliers face vision integration costs above USD 500,000 per line, with electrical and safety upgrades accounting for nearly half. European factories often run legacy PLCs that lack the headroom to ingest high-resolution image streams, forcing parallel control architectures that inflate budgets. Custom brackets for cameras and lighting add weeks to commissioning, while tight margins push many suppliers to defer projects until full line replacements.
Other drivers and restraints analyzed in the detailed report include:
- Rapid scale-up of vision-enabled cobots in Tier-2 hubs
- Edge-AI chips slashing latency below 10 ms
- Shortage of vision-system integration talent
For complete list of drivers and restraints, kindly check the Table Of Contents.
Segment Analysis
2D systems accounted for 56.73% of the robotic vision market share in 2025, supported by low camera costs and mature barcode and presence-detection software. The surge of electric-vehicle battery and semiconductor inspection is lifting 3D depth sensing, which is set to grow at a 10.32% CAGR through 2031. Automotive lines merging CAD-driven inspections with point-cloud comparison raised defect-detection rates to 99.9%. Time-of-flight sensor pricing fell sharply after 2024, bringing the total cost of 3D cells to just 1.5 times that of a 2D alternative. Multispectral and infrared options are gaining traction in pharma and food safety, where they detect contaminants invisible to RGB. Hybrid architectures that record high-resolution 2D images while streaming 3D point clouds now handle pick, inspect, and place in a single scan, cutting cycle time by 20%.
The diffusion of AI-powered analytics further narrows the performance gap. Systems overlaying neural networks on traditional filters learn new defect classes without manual reprogramming, minimizing downtime. Logistics providers integrate 3D Vision into autonomous mobile robots to automatically measure pallet dimensions and detect overhang, slashing loading errors by 60%. As the price premium narrows and AI toolchains simplify, 3D Vision will penetrate mid-tier factories across China, India, and Eastern Europe, locking in a durable growth runway for the robotic vision market.
Hardware generated 66.89% of 2025 revenue, anchored by cameras, optics, and processors. Area-scan sensors dominate 2D, while structured-light and time-of-flight devices power 3D bin-picking. Edge modules such as NVIDIA Jetson carry 20-25% of hardware spend. Yet software is on track for a 9.92% CAGR to 2031 as vision-as-a-service bundles subscription licenses, synthetic-data model training, and remote calibration. Vendors like Cognex converted perpetual licenses to annual plans, slashing entry cost by 60% and guaranteeing continuous updates. Middleware that abstracts hardware idiosyncrasies lets integrators swap sensors without rewriting code, easing vendor lock-in pain.
Services trail closely, covering system design, operator training, and AI model maintenance. As small factories lack resident data scientists, fully managed packages are gaining market share, particularly in North America, where labor rates justify outsourcing. Over the forecast window, software and services combined are set to capture incremental points of market share in the robotic vision market each year, signaling a strategic pivot from hardware margins to recurring revenue.
Complete Report Scope:
- By Technology
- 2D Vision Systems
- 3D Vision Systems
- AI-Powered Vision
- Multispectral / Infrared Vision
- Hybrid Vision Architectures
- By Component
- Hardware
- Cameras
- Sensors
- Processors and Edge Modules
- Optics and Lighting
- Communication Modules
- Software
- Image-Processing Algorithms
- AI/ML Models
- Vision Middleware
- Calibration and Simulation Tools
- Services
- Integration and Engineering
- Training and Support
- Maintenance and Upgrades
- Vision-as-a-Service
- Hardware
- By Robot Type
- Industrial Robots
- Collaborative Robots (Cobots)
- Mobile Robots (AMR/AGV)
- Humanoid Robots
- Aerial Drones
- By Application
- Material Handling
- Assembly and Disassembly
- Inspection and Quality Assurance
- Guidance and Navigation
- Packaging and Palletizing
- Pick and Place
- Welding and Soldering
- Surface Finishing and Painting
- Adaptive Tasks and Emerging Use Cases
- By End-User Industry
- Automotive
- Electronics and Semiconductor
- Food and Beverage
- Pharmaceutical and Healthcare
- Aerospace and Defense
- Logistics and Warehousing
- E-commerce and Retail
- Agriculture
- Energy and Utilities
- By Geography
- North America
- United States
- Canada
- Mexico
- Europe
- Germany
- United Kingdom
- France
- Russia
- Rest of Europe
- Asia-Pacific
- China
- Japan
- India
- South Korea
- Australia
- Rest of Asia-Pacific
- Middle East and Africa
- Middle East
- Saudi Arabia
- United Arab Emirates
- Rest of Middle East
- Africa
- South Africa
- Egypt
- Rest of Africa
- Middle East
- South America
- Brazil
- Argentina
- Rest of South America
- North America
Geography Analysis
Asia-Pacific retained 47.91% of 2025 revenue and is on course for a 10.37% CAGR to 2031, buoyed by China's Made in China 2025 targets and South Korea's semiconductor capital outlays. Japan's aging workforce pushes cobot adoption in food and pharma factories, while India's USD 2 billion incentive steers electronics makers toward vision-driven automation. Australia's mining firms deploy vision-guided autonomous trucks and drills, cutting operator exposure to hazards.
North America trails but benefits from the Inflation Reduction Act tax credits that fund vision-enabled battery plants. U.S. logistics hubs in Kentucky and Texas are retrofitting distribution centers with camera-equipped AMRs to handle holiday peak orders. Canada's aerospace corridor in Quebec invests in 3D Vision for composite inspection, aiming to achieve defect rates below 0.05 ppm.
Europe faces brownfield integration hurdles yet remains pivotal. Germany's automotive Tier-1s spent EUR 1.5 billion (USD 1.7 billion) on battery inspection lines across 2024-2025. The United Kingdom offsets post-Brexit labor shortages with lights-out vision-guided machining in aerospace and pharma. Central European nations such as Poland and the Czech Republic lure near-shoring contracts by bundling automation rebates with low energy tariffs.
Middle East and Africa, Latin America, and smaller regions grow from modest bases. Mexico's USD 20 billion near-shoring windfall channeled funds to vision-ready wiring harness plants. Brazil's ag-equipment makers integrate Vision into autonomous harvesters, slashing operator costs nearly in half. Saudi Arabia's Vision 2030 earmarks USD 500 million for food and petrochemical automation, with Vision a prerequisite for subsidy approval. South Africa trials vision-guided ore sorters that uplift grade while curbing safety incidents.
- Cognex Corporation
- Keyence Corporation
- FANUC Corporation
- ABB Ltd.
- Omron Corporation
- Sick AG
- Teledyne DALSA Inc.
- Hexagon AB
- Basler AG
- Yaskawa Electric Corporation
- KUKA AG
- Denso Wave Incorporated
- Universal Robots A/S
- LMI Technologies Inc.
- Intel Corporation
- Qualcomm Technologies Inc.
- Nikon Metrology NV
- Matrox Imaging
- ISRA Vision AG
Additional Benefits:
- The market estimate (ME) sheet in Excel format
- 3 months of analyst support
TABLE OF CONTENTS
1 INTRODUCTION
- 1.1 Study Assumptions and Market Definition
- 1.2 Scope of the Study
2 RESEARCH METHODOLOGY
3 EXECUTIVE SUMMARY
4 MARKET LANDSCAPE
- 4.1 Market Overview
- 4.2 Market Drivers
- 4.2.1 Accelerating Adoption of AI-Embedded 3D Vision for Complex Assembly
- 4.2.2 Government Incentives for Automation Amid Labor Shortages
- 4.2.3 Rapid Scale-Up of Vision-Enabled Cobots in Tier-2 Manufacturing Hubs
- 4.2.4 Edge-AI Chips Slashing Latency Below 10 ms Enabling Precision Tasks
- 4.2.5 Post-2025 ESG Mandates Pushing Zero-Defect Manufacturing
- 4.2.6 Vision-as-a-Service Subscription Models Lower Upfront Costs
- 4.3 Market Restraints
- 4.3.1 High Integration Costs With Legacy Brown-Field Production Lines
- 4.3.2 Shortage of Vision-System Integration Talent Outside Major Tech Clusters
- 4.3.3 Fragmented Sensor and Software Standards Hindering Interoperability
- 4.3.4 Rising Cyber-Security Compliance Costs for Vision-Rich Factories
- 4.4 Industry Value Chain Analysis
- 4.5 Regulatory Landscape
- 4.6 Technological Outlook
- 4.7 Impact of Macroeconomic Factors on the Market
- 4.8 Porter's Five Forces Analysis
- 4.8.1 Threat of New Entrants
- 4.8.2 Bargaining Power of Buyers
- 4.8.3 Bargaining Power of Suppliers
- 4.8.4 Threat of Substitute Products
- 4.8.5 Intensity of Competitive Rivalry
5 MARKET SIZE AND GROWTH FORECASTS (VALUE)
- 5.1 By Technology
- 5.1.1 2D Vision Systems
- 5.1.2 3D Vision Systems
- 5.1.3 AI-Powered Vision
- 5.1.4 Multispectral / Infrared Vision
- 5.1.5 Hybrid Vision Architectures
- 5.2 By Component
- 5.2.1 Hardware
- 5.2.1.1 Cameras
- 5.2.1.2 Sensors
- 5.2.1.3 Processors and Edge Modules
- 5.2.1.4 Optics and Lighting
- 5.2.1.5 Communication Modules
- 5.2.2 Software
- 5.2.2.1 Image-Processing Algorithms
- 5.2.2.2 AI/ML Models
- 5.2.2.3 Vision Middleware
- 5.2.2.4 Calibration and Simulation Tools
- 5.2.3 Services
- 5.2.3.1 Integration and Engineering
- 5.2.3.2 Training and Support
- 5.2.3.3 Maintenance and Upgrades
- 5.2.3.4 Vision-as-a-Service
- 5.2.1 Hardware
- 5.3 By Robot Type
- 5.3.1 Industrial Robots
- 5.3.2 Collaborative Robots (Cobots)
- 5.3.3 Mobile Robots (AMR/AGV)
- 5.3.4 Humanoid Robots
- 5.3.5 Aerial Drones
- 5.4 By Application
- 5.4.1 Material Handling
- 5.4.2 Assembly and Disassembly
- 5.4.3 Inspection and Quality Assurance
- 5.4.4 Guidance and Navigation
- 5.4.5 Packaging and Palletizing
- 5.4.6 Pick and Place
- 5.4.7 Welding and Soldering
- 5.4.8 Surface Finishing and Painting
- 5.4.9 Adaptive Tasks and Emerging Use Cases
- 5.5 By End-User Industry
- 5.5.1 Automotive
- 5.5.2 Electronics and Semiconductor
- 5.5.3 Food and Beverage
- 5.5.4 Pharmaceutical and Healthcare
- 5.5.5 Aerospace and Defense
- 5.5.6 Logistics and Warehousing
- 5.5.7 E-commerce and Retail
- 5.5.8 Agriculture
- 5.5.9 Energy and Utilities
- 5.6 By Geography
- 5.6.1 North America
- 5.6.1.1 United States
- 5.6.1.2 Canada
- 5.6.1.3 Mexico
- 5.6.2 Europe
- 5.6.2.1 Germany
- 5.6.2.2 United Kingdom
- 5.6.2.3 France
- 5.6.2.4 Russia
- 5.6.2.5 Rest of Europe
- 5.6.3 Asia-Pacific
- 5.6.3.1 China
- 5.6.3.2 Japan
- 5.6.3.3 India
- 5.6.3.4 South Korea
- 5.6.3.5 Australia
- 5.6.3.6 Rest of Asia-Pacific
- 5.6.4 Middle East and Africa
- 5.6.4.1 Middle East
- 5.6.4.1.1 Saudi Arabia
- 5.6.4.1.2 United Arab Emirates
- 5.6.4.1.3 Rest of Middle East
- 5.6.4.2 Africa
- 5.6.4.2.1 South Africa
- 5.6.4.2.2 Egypt
- 5.6.4.2.3 Rest of Africa
- 5.6.4.1 Middle East
- 5.6.5 South America
- 5.6.5.1 Brazil
- 5.6.5.2 Argentina
- 5.6.5.3 Rest of South America
- 5.6.1 North America
6 COMPETITIVE LANDSCAPE
- 6.1 Market Concentration
- 6.2 Strategic Moves
- 6.3 Market Share Analysis
- 6.4 Company Profiles (includes Global Level Overview, Market Level Overview, Core Segments, Financials as available, Strategic Information, Market Rank/Share for key companies, Products and Services, and Recent Developments)
- 6.4.1 Cognex Corporation
- 6.4.2 Keyence Corporation
- 6.4.3 FANUC Corporation
- 6.4.4 ABB Ltd.
- 6.4.5 Omron Corporation
- 6.4.6 Sick AG
- 6.4.7 Teledyne DALSA Inc.
- 6.4.8 Hexagon AB
- 6.4.9 Basler AG
- 6.4.10 Yaskawa Electric Corporation
- 6.4.11 KUKA AG
- 6.4.12 Denso Wave Incorporated
- 6.4.13 Universal Robots A/S
- 6.4.14 LMI Technologies Inc.
- 6.4.15 Intel Corporation
- 6.4.16 Qualcomm Technologies Inc.
- 6.4.17 Nikon Metrology NV
- 6.4.18 Matrox Imaging
- 6.4.19 ISRA Vision AG
7 MARKET OPPORTUNITIES AND FUTURE OUTLOOK
- 7.1 White-Space and Unmet-Need Assessment

 機器人視覺市場-2026-2032年全球市場預測
 工業機器人視覺系統市場規模、佔有率和成長分析:按視覺技術、組件、機器人類型、應用、最終用戶產業和地區分類-2026-2033年產業預測
 機器人視覺系統市場機會、成長要素、產業趨勢分析及2026-2035年預測
 機器人視覺市場分析及預測(至2035年):依類型、產品類型、服務、技術、應用及最終用戶分類
 2026年全球機器人視覺市場報告機器人3D視覺市場分析及預測(至2035年):依類型、產品類型、服務、技術、組件、應用、最終用戶、功能分類
 全球機器人視覺市場規模、佔有率、趨勢和成長分析報告(2026-2034)全球機器人視覺市場:市場規模、佔有率、成長率、產業分析、依類型、應用和地區劃分的分析以及未來預測(2026-2034)
 機器人視覺市場-全球產業規模、佔有率、趨勢、機會、預測:硬體、技術、應用、區域及競爭格局(2021-2031年)
 機器人視覺市場規模、佔有率和成長分析(按組件、類型、應用、最終用戶和地區分類)-2026-2033年產業預測