

 |
市場調查報告書
商品編碼
2073517
全Flash陣列:市場佔有率分析、產業趨勢與統計、成長預測(2026-2031)All Flash Array - Market Share Analysis, Industry Trends & Statistics, Growth Forecasts (2026 - 2031) |
||||||
※ 本網頁內容可能與最新版本有所差異。詳細情況請與我們聯繫。
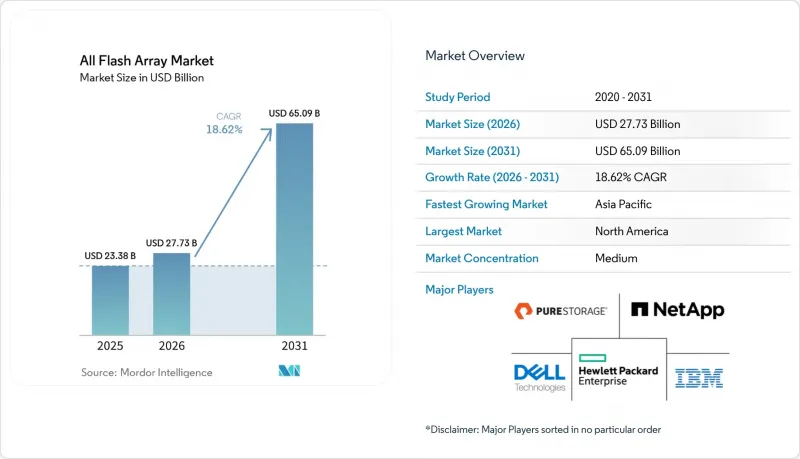
根據 Mordor Intelligence 預測,全Flash陣列市場規模將從 2025 年的 233.8 億美元成長到 2026 年的 277.3 億美元,然後在 2031 年達到 650.9 億美元,2026 年至 2031 年的複合年成長率為 18.62%。
本報告按架構(縱向擴展、橫向擴展、NVMe-OF 解耦式)、容量(20 TB 以下、20–100 TB、100 TB 以上)、介面協議(SAS/SATA、光纖通道、其他)、最終用戶產業(IT 與通訊、銀行、金融服務和保險、醫療保健與生命科學、其他)以及地區進行細分。市場預測以美元 (USD) 為單位。
全球全Flash陣列市場趨勢與洞察
超大規模和邊緣資料中心的快速建設
超大規模雲端服務供應商已為2025年的AI最佳化園區投入超過1,300億美元的資本總合(CAPEX),其中儲存目前約佔五分之一。新建設施需要高密度、低延遲的快閃記憶體層來支援數千個GPU處理大規模語言模型的參數。同時,零售店、行動電話基地台和製造工廠等邊緣部署也傾向於使用緊湊型快閃記憶體系統,因為該系統能夠承受振動和溫度波動,同時提供穩定的吞吐量。供應商正在透過統一的控制器程式碼來解決這個問題,該程式碼可擴展,從雙節點邊緣設備到核心資料中心內的機架級NVMe-oF架構。主要都會地區的電力限制進一步加速了高IOPS/W快閃記憶體的轉變。因此,全Flash陣列市場正受益於集中式雲端和分散式邊緣節點需求的整合。
效能關鍵型人工智慧和即時分析工作負載
AI模型訓練會透過連續式寫入操作使儲存鏈路飽和,而推理工作負載則依賴微秒級的隨機讀取。這兩種工作負載模式暴露了混合陣列的延遲和隊列深度限制,加速了AI驅動型儲存的普及,並推動銀行、保險公司和電子商務平台向全快閃系統遷移。部署演算法交易引擎的金融機構在將其交易資料儲存庫遷移到經過STAC基準測試檢驗的全快閃平台後,報告指出收入顯著成長。醫院正在利用基於快閃記憶體的PACS歸檔系統,使AI診斷引擎能夠即時分析MRI和電腦斷層掃描,從而縮短診斷時間。製造企業正在邊緣GPU上運行預測性維護模型,這些模型即時接收感測器遙測數據,如果儲存出現故障,此工作流程將停止運作。搜尋增強生成(RAG)、圖查詢和串流分析的融合,正在將全Flash陣列市場確立為下一代資料管道的基礎。
與混合陣列相比,初始資本支出(CAPEX)較高
儘管固態硬碟 (SSD) 價格下降,但入門級全快閃節點的價格仍然比容量相當的混合產品高出 40% 到 60%。對價格敏感的行業財務長 (CFO) 通常優先考慮初始採購成本而非五年總擁有成本 (TCO),從而推遲了快閃記憶體遷移專案。拉丁美洲和東南亞的一些中小企業選擇透過升級快取來延長其磁碟陣列的使用壽命,而不是完全遷移工作負載。通膨週期帶來的經濟不確定性延長了採購核准流程,進一步阻礙了短期內向全Flash陣列的轉型。
細分市場分析
到2025年,縱向擴展陣列將佔全快閃陣列銷售額的47.12%,仍將是全Flash陣列市場最大的貢獻者。其熟悉的雙控制器配置能夠與現有的SAN編配整合,因此經久不衰。然而,這種架構難以充分利用日益高密度的NVMe驅動器,促使注重效能的買家轉向橫向擴展或完全解耦的NVMe-oF設計。儘管供應商透過添加無狀態計算架和快取層來降低風險,但這些售後改進無法克服控制器固有的根本限制。
相較之下,預計到 2031 年,NVMe-oF 解耦叢集的複合年成長率將達到 19.45%,成為全Flash陣列市場中成長最快的領域。解耦技術透過將儲存邏輯遷移到可線性擴展的乙太網路連接節點,消除了單底盤瓶頸。 Pure Storage 和多家軟體定義儲存領域的新興參與企業已展示了基於此模型構建的Petabyte級 GPU 集群,並指出其在 AI 模型查核點期間能夠保持穩定的線速吞吐量。部署的成功仍取決於資料中心團隊能否掌握 RDMA、擁塞定序以及高速乙太網路上的多通道傳輸等技術,而這種技能差距正是阻礙短期部署的一個因素。
20-100 TB 的頻寬在 2025 年將佔部署總量的 49.25%,使其成為資料庫整合和緩解虛擬機器無序成長的理想選擇。此頻寬範圍在價格、機架功耗和重建窗口方面實現了良好的平衡,使其成為中型企業更新周期的首選。 QLC 快閃記憶體與強大的線上壓縮技術的結合,可提供遠超傳統混合系統的有效容量,且無需負責人設計專用底盤。
預計到2031年,容量超過100TB的系統將以19.61%的複合年成長率成長,超過全Flash陣列市場的整體成長率。超大規模超大規模資料中心業者傾向於使用這些高密度機架向GPU叢集提供數據,因為局部可以降低東西向流量成本。金融交易中心也擴大採用高密度配置,將交易歷史資料和回測庫整合到一個超低延遲的池中。美光與Pure Storage共同開發的150TB DirectFlash模組,象徵廠商致力於打造多Petabyte機架,以減少佈線和功耗,並提供毫不妥協的頻寬。
區域分析
到2025年,北美將佔全球營收的38.24%,這主要得益於美國超大規模資料中心業者資料中心營運商不斷擴展人工智慧叢集以及華爾街交易公司對市場資料湖進行現代化改造。該地區每年在人工智慧基礎設施方面的投資超過500億美元,而全快閃層則構成了每個GPU核心。此外,美國證券交易委員會(SEC)和金融業監管局(FINRA)的嚴格監管要求必須符合「一次寫入,多次讀取(WROM)」原則,而現代快閃記憶體陣列透過不可變簡介框架滿足了這項要求。
亞太地區是成長最快的區域,預計到2031年將實現20.30%的複合年成長率,這主要得益於工廠品管的自動化以及各國人工智慧戰略推動的自主資料中心的普及。中國正在補貼本土儲存品牌以抵消出口限制的影響,而日本和韓國正在將5G邊緣節點升級為緊湊型閃存機架,用於現場處理影片分析。印度的IT服務中心正在下一代託管園區內部署全快閃機架,以縮短全球客戶的應用程式回應時間。新加坡和香港正在將金融區與區域災害復原快閃記憶體叢集連接起來,以符合有關更快支付和清算的法規要求。在歐洲,企業被鼓勵採用能夠降低每瓦時功耗的儲存方案,同時兼顧能源政策和數位創新。德國正在資助一條「工業4.0」試點生產線,該生產線整合了需要快速數據檢索的人工智慧視覺系統,而法國則正在投資建設一個由國內管理的、具有全快閃骨幹層的雲端區域。北歐國家正吸引超大規模企業進駐水力發電園區,催生了對高密度閃存盤的新需求。同時,中東石油巨頭正將快閃陣列應用於地震建模設備,而非洲通訊業者正在部署基於快閃記憶體的行動支付平台,這些平台即使在區域電力供應不穩定的情況下也需要全天候可用。這種地理多元化以及其他因素,共同推動了全Flash陣列市場的強勁成長。
其他好處:
- Excel格式的市場預測(ME)表
- 3個月的分析師支持
目錄
第1章:引言
- 研究假設和市場定義
- 調查範圍
第2章:調查方法
第3章執行摘要
第4章 市場狀況
- 市場概覽
- 市場促進因素
- 超大規模和邊緣資料中心的建設正在蓬勃發展。
- NAND快閃記憶體每位元價格的急劇下降
- 效能關鍵型人工智慧和即時分析工作負載
- 企業IT部門強制推行能源效率
- 金融交易中心的Tier-0資料庫整合
- 網路復原架構需要不可變的快閃記憶體簡介
- 市場限制因素
- 人們普遍認為初始資本投資成本較高,並且與混合陣列相比…
- 擴展架構中的控制器瓶頸
- 高密度NAND快閃記憶體供應鏈的變異性
- 頻繁寫入的日誌記錄用例的耐久性有限制。
- 產業價值鏈分析
- 監理情勢
- 技術展望
- 宏觀經濟因素的影響
- 波特五力分析
第5章 市場規模與成長預測
- 以建築學為例
- 擴大規模
- 橫向擴展
- NVMe-oF 解聚型
- 按容量(有效)
- 20 TB 或更少
- 20~100 TB
- 超過100TB
- 透過介面協議
- SAS/SATA
- 光纖通道
- iSCSI
- NVMe
- 按最終用戶行業分類
- IT/通訊
- BFSI
- 醫療保健和生命科學
- 政府/公共部門
- 媒體與娛樂
- 製造業和能源
- 其他終端用戶產業
- 按地區
- 北美洲
- 美國
- 加拿大
- 墨西哥
- 南美洲
- 巴西
- 阿根廷
- 智利
- 其他南美國家
- 歐洲
- 德國
- 英國
- 法國
- 義大利
- 西班牙
- 其他歐洲國家
- 亞太地區
- 中國
- 日本
- 韓國
- 印度
- 新加坡
- 澳洲
- 其他亞太國家
- 中東和非洲
- 中東
- 沙烏地阿拉伯
- 阿拉伯聯合大公國
- 土耳其
- 其他中東國家
- 非洲
- 南非
- 奈及利亞
- 埃及
- 其他非洲國家
- 中東
- 北美洲
第6章 競爭情勢
- 市場集中度
- 策略趨勢
- 市佔率分析
- 公司簡介
- Pure Storage Inc.
- Dell Technologies Inc.
- NetApp Inc.
- Hewlett Packard Enterprise Company
- IBM Corporation
- Huawei Technologies Co., Ltd.
- Hitachi Ltd.(Hitachi Vantara LLC)
- Western Digital Corporation
- Fujitsu Limited
- Violin Systems LLC
- Silk Platform Ltd.
- Lenovo Group Limited
- NEC Corporation
- Inspur Electronic Information Industry Co., Ltd.
- Nimbus Data Inc.
- VAST Data Ltd.
- DataDirect Networks Inc.(DDN)
- Pavilion Data Systems Inc.
- Seagate Technology Holdings plc
- AccelStor Inc.
- StorONE Inc.
第7章 市場機會與未來展望
According to Mordor Intelligence, the all flash array market size is expected to grow from USD 23.38 billion in 2025 to USD 27.73 billion in 2026 and is forecast to reach USD 65.09 billion by 2031 at 18.62% CAGR over 2026-2031.
This report is Segmented by Architecture (Scale-Up, Scale-Out, and NVMe-OF Disaggregated), Capacity (<=20 TB, 20-100 TB, and >100 TB), Interface Protocol (SAS/SATA, Fibre Channel, and More), End-User Industry (IT and Telecom, BFSI, Healthcare and Life Sciences, and More), and Geography. The Market Forecasts are Provided in Terms of Value (USD).
Global All Flash Array Market Trends and Insights
Surging hyperscale and edge data-center buildouts
Hyperscale cloud operators collectively allocated more than USD 130 billion in 2025 capex for AI-optimized campuses, and storage now captures roughly one-fifth of that spend. New facilities require dense, low-latency flash tiers to feed thousands of GPUs that process large language model parameters. In parallel, edge deployments at retail outlets, cell towers, and manufacturing sites favor compact flash systems that tolerate vibration and temperature variations yet still deliver consistent throughput. Vendors are responding with unified controller code that scales from two-node edge appliances to rack-scale NVMe-oF fabrics inside core data centers. Utility-driven power caps in major metros further accelerate the move from hybrid drives to flash that delivers higher IOPS per watt. As a result, the All Flash Array market benefits from synchronized demand across centralized clouds and distributed edge nodes.
Performance-critical AI and real-time analytics workloads
AI model training saturates storage links with sequential writes, while inference workloads depend on microsecond random reads. These dual-workload profiles expose the latency and queue-depth limits of hybrid arrays, accelerating adoption of AI powered Storage and pushing banks, insurers, and e-commerce platforms toward all-flash systems. Financial institutions deploying algorithmic trading engines report tangible revenue gains after migrating tick-data stores to all-flash platforms validated under STAC benchmarks. Hospitals leverage flash-based PACS archives to let AI diagnostic engines review MRI and CT scans without delay, accelerating time to diagnosis. Manufacturers run predictive maintenance models on edge-hosted GPUs that ingest sensor telemetry in real time, a workflow that collapses if storage stalls. The convergence of retrieval-augmented generation, graph queries, and streaming analytics positions the All Flash Array market as foundational for next-generation data pipelines.
Up-front capex premium versus hybrid arrays
Even with falling SSD prices, an entry-level all-flash node still lists 40% to 60% higher than a hybrid alternative of equal usable capacity. CFOs in price-sensitive verticals often prioritize initial purchase cost over five-year TCO, delaying flash migration projects. SMEs in Latin America and parts of Southeast Asia extend the life of disk-based arrays by adding cache upgrades rather than shifting workloads outright. Economic uncertainty following inflationary cycles has elongated procurement approvals, further suppressing near-term All Flash Array market conversions.
Other drivers and restraints analyzed in the detailed report include:
- Rapid decline in NAND cost per bit
- Energy-efficiency mandates for enterprise IT
- Controller bottlenecks in scale-up architectures
For complete list of drivers and restraints, kindly check the Table Of Contents.
Segment Analysis
Scale-up arrays delivered 47.12% of 2025 revenue, keeping them the largest contributor to the All Flash Array market. The familiar dual-controller footprint integrates with existing SAN orchestration, explaining its staying power. Yet the same architecture struggles to utilize ever-denser NVMe drives, nudging performance-critical buyers toward scale-out or fully disaggregated NVMe-oF designs. Vendors mitigate risk by adding stateless compute shelves and caching layers, but these retrofits cannot erase fundamental controller constraints.
In contrast, NVMe-oF disaggregated clusters are projected to post a 19.45% CAGR to 2031, the fastest within the All Flash Array market. Disaggregation eliminates single-chassis bottlenecks by pushing storage logic to Ethernet-attached nodes that scale linearly. Pure Storage and several software-defined entrants showcase petabyte-scale GPU farms built on this model, citing sustained line-rate throughput figures during AI model checkpoints. Adoption still hinges on data-center teams mastering RDMA, congestion control, and multi-pathing across high-speed Ethernet, creating a skills gap that tempers near-term rollouts.
The 20-100 TB band held 49.25% of 2025 deployments, representing the sweet spot for database consolidation and VM sprawl elimination. This range balances price, rack power, and rebuild windows, making it the default for mid-sized enterprise refresh cycles. QLC flash plus aggressive inline compression yields effective capacities that dwarf predecessor hybrids without forcing operators into exotic chassis designs.
Systems above 100 TB are forecast to grow at 19.61% CAGR through 2031, outpacing the overall All Flash Array market. Hyperscalers favor these dense shelves to feed GPU clusters where locality lowers east-west traffic costs. Financial trading hubs also gravitate toward high-density builds, consolidating tick history and back-testing libraries onto singular ultra-low-latency pools. Micron's 150 TB DirectFlash Module, co-engineered with Pure Storage, exemplifies the vendor push toward multi-petabyte racks that promise fewer cables, fewer watts, and uncompromised bandwidth.
Complete Report Scope:
- By Architecture
- Scale-Up
- Scale-Out
- NVMe-oF Disaggregated
- By Capacity (Usable)
- <=20 TB
- 20 - 100 TB
- >100 TB
- By Interface Protocol
- SAS/SATA
- Fibre Channel
- iSCSI
- NVMe
- By End-User Industry
- IT and Telecom
- BFSI
- Healthcare and Life Sciences
- Government and Public Sector
- Media and Entertainment
- Manufacturing and Energy
- Other End-User Industries
- By Geography
- North America
- United States
- Canada
- Mexico
- South America
- Brazil
- Argentina
- Chile
- Rest of South America
- Europe
- Germany
- United Kingdom
- France
- Italy
- Spain
- Rest of Europe
- Asia-Pacific
- China
- Japan
- South Korea
- India
- Singapore
- Australia
- Rest of Asia-Pacific
- Middle East and Africa
- Middle East
- Saudi Arabia
- United Arab Emirates
- Turkey
- Rest of Middle East
- Africa
- South Africa
- Nigeria
- Egypt
- Rest of Africa
- Middle East
- North America
Geography Analysis
North America generated 38.24% of 2025 revenue, anchored by U.S. hyperscalers expanding AI clusters and Wall Street trading firms modernizing market-data lakes. The region allocates well over USD 50 billion each year to AI infrastructure, and all-flash tiers sit at the heart of every GPU pod. Strict SEC and FINRA rules also require write-once-read-many compliance, which modern flash arrays fulfill through immutable snapshot frameworks.
Asia-Pacific is the fastest-growing territory, registering a 20.30% CAGR to 2031 as factories automate quality control and national AI strategies proliferate sovereign data centers. China channels subsidies to local storage brands to offset export controls, while Japan and South Korea retrofit 5G edge nodes with compact flash shelves that process video analytics in place. India's IT-services hubs deploy all-flash racks inside next-generation co-location campuses to lower application response times for global clients. Singapore and Hong Kong twin their financial districts with regional disaster-recovery flash clusters to comply with faster clearing and settlement rules. Europe balances energy policy with digital innovation, driving enterprises toward storage that shrinks watt-hour footprints. Germany funds Industry 4.0 pilot lines that embed AI vision systems needing rapid data recall, while France invests in sovereign cloud regions equipped with all-flash backbone tiers. Nordic nations lure hyperscale entrants to hydro-powered campuses, securing new demand for high-density flash trays. Meanwhile, Middle East oil majors adopt flash arrays for seismic modeling rigs, and African telecoms roll out flash-backed mobile-money platforms that require 24 X 7 availability despite regional power volatility. Collectively, geographic diversification supports a resilient growth path for the All Flash Array market.
- Pure Storage Inc.
- Dell Technologies Inc.
- NetApp Inc.
- Hewlett Packard Enterprise Company
- IBM Corporation
- Huawei Technologies Co., Ltd.
- Hitachi Ltd. (Hitachi Vantara LLC)
- Western Digital Corporation
- Fujitsu Limited
- Violin Systems LLC
- Silk Platform Ltd.
- Lenovo Group Limited
- NEC Corporation
- Inspur Electronic Information Industry Co., Ltd.
- Nimbus Data Inc.
- VAST Data Ltd.
- DataDirect Networks Inc. (DDN)
- Pavilion Data Systems Inc.
- Seagate Technology Holdings plc
- AccelStor Inc.
- StorONE Inc.
Additional Benefits:
- The market estimate (ME) sheet in Excel format
- 3 months of analyst support
TABLE OF CONTENTS
1 INTRODUCTION
- 1.1 Study Assumptions and Market Definition
- 1.2 Scope of the Study
2 RESEARCH METHODOLOGY
3 EXECUTIVE SUMMARY
4 MARKET LANDSCAPE
- 4.1 Market Overview
- 4.2 Market Drivers
- 4.2.1 Surging hyperscale and edge data-centre buildouts
- 4.2.2 Rapid decline in NAND cost per bit
- 4.2.3 Performance-critical AI and real-time analytics workloads
- 4.2.4 Energy-efficiency mandates for enterprise IT
- 4.2.5 Tier-0 database consolidation in financial trading hubs
- 4.2.6 Cyber-recovery architectures demanding immutable flash snapshots
- 4.3 Market Restraints
- 4.3.1 Up-front capex premium versus hybrid arrays
- 4.3.2 Controller bottlenecks in scale-up architectures
- 4.3.3 Supply-chain volatility for high-density NAND
- 4.3.4 Limited endurance for write-intensive logging use-cases
- 4.4 Industry Value Chain Analysis
- 4.5 Regulatory Landscape
- 4.6 Technological Outlook
- 4.7 Impact of Macroeconomic Factors
- 4.8 Porter's Five Forces Analysis
- 4.8.1 Threat of New Entrants
- 4.8.2 Bargaining Power of Suppliers
- 4.8.3 Bargaining Power of Buyers
- 4.8.4 Threat of Substitutes
- 4.8.5 Intensity of Competitive Rivalry
5 MARKET SIZE AND GROWTH FORECASTS (VALUES)
- 5.1 By Architecture
- 5.1.1 Scale-Up
- 5.1.2 Scale-Out
- 5.1.3 NVMe-oF Disaggregated
- 5.2 By Capacity (Usable)
- 5.2.1 <=20 TB
- 5.2.2 20 - 100 TB
- 5.2.3 >100 TB
- 5.3 By Interface Protocol
- 5.3.1 SAS/SATA
- 5.3.2 Fibre Channel
- 5.3.3 iSCSI
- 5.3.4 NVMe
- 5.4 By End-User Industry
- 5.4.1 IT and Telecom
- 5.4.2 BFSI
- 5.4.3 Healthcare and Life Sciences
- 5.4.4 Government and Public Sector
- 5.4.5 Media and Entertainment
- 5.4.6 Manufacturing and Energy
- 5.4.7 Other End-User Industries
- 5.5 By Geography
- 5.5.1 North America
- 5.5.1.1 United States
- 5.5.1.2 Canada
- 5.5.1.3 Mexico
- 5.5.2 South America
- 5.5.2.1 Brazil
- 5.5.2.2 Argentina
- 5.5.2.3 Chile
- 5.5.2.4 Rest of South America
- 5.5.3 Europe
- 5.5.3.1 Germany
- 5.5.3.2 United Kingdom
- 5.5.3.3 France
- 5.5.3.4 Italy
- 5.5.3.5 Spain
- 5.5.3.6 Rest of Europe
- 5.5.4 Asia-Pacific
- 5.5.4.1 China
- 5.5.4.2 Japan
- 5.5.4.3 South Korea
- 5.5.4.4 India
- 5.5.4.5 Singapore
- 5.5.4.6 Australia
- 5.5.4.7 Rest of Asia-Pacific
- 5.5.5 Middle East and Africa
- 5.5.5.1 Middle East
- 5.5.5.1.1 Saudi Arabia
- 5.5.5.1.2 United Arab Emirates
- 5.5.5.1.3 Turkey
- 5.5.5.1.4 Rest of Middle East
- 5.5.5.2 Africa
- 5.5.5.2.1 South Africa
- 5.5.5.2.2 Nigeria
- 5.5.5.2.3 Egypt
- 5.5.5.2.4 Rest of Africa
- 5.5.5.1 Middle East
- 5.5.1 North America
6 COMPETITIVE LANDSCAPE
- 6.1 Market Concentration
- 6.2 Strategic Moves
- 6.3 Market Share Analysis
- 6.4 Company Profiles (includes Global level Overview, Market level overview, Core Segments, Financials as available, Strategic Information, Market Rank/Share for key companies, Products and Services, and Recent Developments)
- 6.4.1 Pure Storage Inc.
- 6.4.2 Dell Technologies Inc.
- 6.4.3 NetApp Inc.
- 6.4.4 Hewlett Packard Enterprise Company
- 6.4.5 IBM Corporation
- 6.4.6 Huawei Technologies Co., Ltd.
- 6.4.7 Hitachi Ltd. (Hitachi Vantara LLC)
- 6.4.8 Western Digital Corporation
- 6.4.9 Fujitsu Limited
- 6.4.10 Violin Systems LLC
- 6.4.11 Silk Platform Ltd.
- 6.4.12 Lenovo Group Limited
- 6.4.13 NEC Corporation
- 6.4.14 Inspur Electronic Information Industry Co., Ltd.
- 6.4.15 Nimbus Data Inc.
- 6.4.16 VAST Data Ltd.
- 6.4.17 DataDirect Networks Inc. (DDN)
- 6.4.18 Pavilion Data Systems Inc.
- 6.4.19 Seagate Technology Holdings plc
- 6.4.20 AccelStor Inc.
- 6.4.21 StorONE Inc.
7 MARKET OPPORTUNITIES AND FUTURE OUTLOOK
- 7.1 White-space and Unmet-Need Assessment
 2026年全球全Flash陣列市場報告
 全Flash陣列市場:按組件、企業規模、部署類型、應用程式和最終用戶產業分類 - 全球預測 2026-2032快閃記憶體陣列市場:按類型、介面、部署模式、最終用戶產業和應用程式分類 - 全球預測 2026-2032
 全Flash陣列市場分析及至2035年預測:按類型、產品類型、服務、技術、組件、應用、部署類型、最終用戶、解決方案和模式分類
 全快閃陣列市場-全球產業規模、佔有率、趨勢、機會和預測,按類型(傳統和客製化)、最終用戶(IT和電信業、銀行、金融服務和保險、醫療保健、政府)、地區和競爭格局分類,2020-2030年預測
 全球全Flash陣列市場規模、佔有率和產業分析報告:2025 年至 2032 年快閃記憶體媒體、儲存架構、最終用途產業、儲存系統和地區的展望與預測
 全球全Flash陣列市場:市場規模、佔有率和趨勢分析(按快閃媒體、儲存架構、儲存系統、最終用途和地區分類),細分市場預測(2025-2033 年)
 全Flash陣列市場報告:2031 年趨勢、預測與競爭分析
 全Flash陣列(AFA)市場 2025-2029
 全球全快閃陣列 (AFA) 市場規模(按快閃媒體、儲存架構、最終用戶產業、地區、範圍和預測)