


 |
市場調查報告書
商品編碼
2073488
軟體定義儲存:市場佔有率分析、產業趨勢與統計資料、成長預測(2026-2031 年)Software-Defined Storage - Market Share Analysis, Industry Trends & Statistics, Growth Forecasts (2026 - 2031) |
||||||

※ 本網頁內容可能與最新版本有所差異。詳細情況請與我們聯繫。
根據 Mordor Intelligence 預測,軟體定義儲存 (SDS) 市場預計將在 2026 年達到 242.7 億美元,並在 2031 年擴大到 750.3 億美元,預測期內複合年成長率為 25.32%。
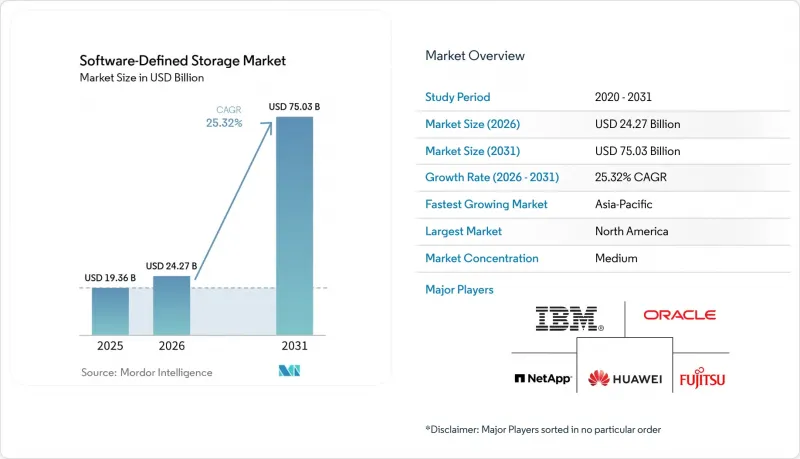
本報告按儲存類型(區塊儲存、文件儲存、物件儲存及其他)、部署類型(本地部署、私有雲端及其他)、組織規模(中小企業和大型企業)、最終用戶產業(銀行、金融服務和保險;電信和資訊科技;及其他)以及地區進行細分。市場預測以美元計價。
全球軟體定義儲存市場趨勢及洞察
非結構化資料的指數級成長
到2025年,全球數據量將成長到更龐大的Zetta位元組級,其中大部分是非結構化數據,例如影片、感測器日誌和圖像檔案。傳統的縱向擴展陣列無法經濟高效地容納每月Petabyte的數據,因此企業正在採用可橫向擴展的軟體定義叢集元元資料帶化到鍵值存儲中,以實現線性容量擴展。例如,交易監控系統每天歸檔Terabyte以符合MiFID II的要求,但由於S3的定價為每月每GB 0.004美元,其成本僅為區塊儲存的六分之一。進行電腦視覺檢測的製造商每天每行處理800GB的影像數據,需要並行寫入對象,延遲低於100毫秒。一家符合HIPAA標準的醫療機構正在使用軟體定義歸檔實現儲存自動化,從而將審計準備時間縮短了70%。
成本優勢,從專有陣列轉向通用硬體
雖然專有陣列每GB可用容量的成本為8-15美元,但基於x86伺服器的軟體定義環境可以以0.50-2美元的成本提供容量,從而折舊免稅額75-90%的成本。企業透過重複利用已折舊的運算節點來延長硬體壽命,每個Petabyte儲存環境可節省200萬美元的更新成本。 NVMe over Fabrics消除了傳統的延遲挑戰,使分散式儲存能夠實現與陣列相當的IOPS密度。在印度和印尼等地部署的基於ARM的叢集,可將功耗降低40%,並在電力成本較高的地區進一步降低18%的總擁有成本。
傳統儲存環境中的整合複雜性
企業通常擁有 11 種不同類型的儲存系統,需要進行精細的區域分類和 LUN 映射,才能在不停機的情況下遷移Petabyte資料。光纖通道架構依賴專有控制,無法轉換為基於 TCP 的 NVMe,導致協定閘道器增加延遲並成為單點故障。傳統備份工具依賴磁帶庫,迫使企業部署虛擬磁帶模擬層,進而削弱了雲端經濟效益。使用 IBM z/OS 的金融機構無法簡單地將 FICON 儲存替換為面向 x86 的版本,而必須重新編譯數十年前的通道程式。對於法律要求的數據,保留歷史記錄的證明可能會使遷移期延長長達六個月。
細分市場分析
預計到2025年,物件儲存將佔據軟體定義儲存市場42.64%的佔有率,年複合成長率達26.22%,這主要得益於S3 API的推動,該API整合了本地和雲端儲存桶的資料湖。由於採用糾刪編碼,物件儲存的成本優勢日益凸顯,糾刪碼能夠以低於每月每GB 0.004美元的價格實現「11個9」的持久性。區塊儲存仍然在對延遲敏感的資料庫中佔據重要地位,透過整合基於TCP的NVMe,不斷突破微秒IOPS效能的極限。基於物件後端建構的檔案閘道在企業共用中維護SMB和NFS工作流程,並在部門層級應用情境中得到越來越廣泛的採用。超融合融合式基礎架構將運算和儲存整合在同一節點上,對於尋求承包部署的中型企業IT部門來說極具吸引力。監管政策的影響正推動醫療保健產業向具有WORM(一次寫入,永久讀取)保證的物件儲存轉型,而交易部門仍依賴核心帳本和區塊儲存磁碟區來確保可預測的微秒級寫入回應時間。受人工智慧模型訓練流程需要跨數千個GPU進行並行讀取的驅動,預計到2031年,物件導向平台的軟體定義儲存市場將翻倍。供應商透過添加GPU直接協議進一步拉大與傳統陣列的差距,這些協議繞過了基於CPU的複製過程,並將epoch時間縮短了數秒。
目前,物件儲存方案在單一命名空間內提供高效能的 NVMe SSD 層和低成本的 HDD 層,管理員可以定義措施來自動歸檔不常用的日誌。 MinIO 和 Ceph 發布了改進的糾錯編碼,在 16+4 佈局中實現了 90% 的儲存效率,與 RAID 6 相比降低了容量開銷。同時,雲端提供者正在部署單區域 Turbo 層,為 AI 訓練提供亞毫秒訪問,這表明物件儲存可以同時滿足吞吐量和延遲方面的工作負載需求。隨著企業採用微服務,每個服務直接將事件記錄到物件儲存桶中,因此無需檔案系統並簡化了 DevOps 管線。在命名空間虛擬化(抽象化了協定差異)的驅動下,物件、檔案和區塊語義正在融合,預計軟體定義儲存市場將進一步整合。
託管服務消除了採購壁壘,預計到 2025 年,公共雲端將佔總收入的 55.83%。然而,受監管行業需要在利用雲端的突發容量的同時,將某些數據保留在本地,因此混合配置預計將實現 26.55% 的複合年成長率。歐洲銀行正在平衡合規性和可擴展性,一方面將主要副本保留在本地以符合 GDPR 要求,另一方面將匿名化資料複製到公共雲端以進行詐欺分析。美國聯邦機構正在利用 FedRAMP 認證的區域,同時維護本地副本以支援業務永續營運計劃。私有雲端對於那些先前已投資於託管服務的公司仍然至關重要,它提供自助服務門戶,能夠複製超大規模的用戶體驗。與空氣間隙的政府網路正在部署 Ceph叢集來處理敏感工作負載,這體現了主權的重要性。多重雲端編配工具整合了 AWS、Azure 和 Google 等平台的各項計劃,無需更改平台即可實現容錯移轉。隨著各組織從成本、延遲和監管角度最佳化其部署,預計到 2029 年以後,與混合模式相關的軟體定義儲存的市場規模將超過純公共雲端的支出。
技術創新的核心在於雙向資料移動性。如今,供應商提供的實施引擎能夠對本機 VMware 磁碟區進行簡介,並將其原生掛載至 Amazon EBS 和 Azure 託管磁碟。渲染農場的雲端爆發已成為常態,工作室會啟動數千個競價型實例存取同一個物件儲存桶。持續複製軟體會在將變更的資料區塊串流傳輸到目標區域之前對其進行壓縮和加密,將災害復原的RPO 縮短至 15 分鐘以內。合規性審計指出,軟體定義平台產生的不可變日誌可將人工證據收集週期減少 30%。企業正在進一步採用邊緣閘道器,將資料快取在分公司本地,並將不常用的檔案遷移到雲端歸檔層,這體現了一種持續的選擇範圍,而非本地部署與公共雲端之間的二元對立。因此,軟體定義儲存市場正持續從孤立的部署模式轉變為流動的資料架構。
區域分析
預計到2025年,北美地區仍將佔全球營收的38.73%,這得益於超大規模資料中心業者資料中心超過1800億美元的資本投資以及Kubernetes CSI的早期應用,該技術可在數秒內配置持久卷。聯邦政府機構正在利用FedRAMP認證的雲端平台,將其資料中心規模縮減50%。加拿大金融公司將客戶資料保留在本地,同時在雲端沙箱中運行分析處理,以符合《個人資訊保護和電子文件法》(PIPEDA)的要求。墨西哥的一個金融科技中心正在採用軟體定義存儲,以滿足即時支付和資料居住的要求。
亞太地區正以26.45%的複合年成長率成長,這主要得益於中國的《網路安全法》、印度的數位公共基礎設施以及東協的5G邊緣部署。為了滿足主權雲法規的要求,中國當地的副本被保留在其境內。到2025年12月,印度的統一支付介面(UPI)將每月處理116億筆交易,這將促使部署可水平擴展的叢集。日本的《個人資訊保護法》正在推動製造業和醫院等機構採用混合部署模式。韓國通訊業者在基地台託管擴增實境(AR)內容快取,將延遲降低至8毫秒。東協正在建立主權區域,強制要求使用本地副本。
在歐洲,GDPR和《數位營運彈性法案》正在加強監管,推動自動化資料分類和防篡改審計追蹤。德國聯邦資訊安全局(BSI)建議在歐盟內部建立多區域副本。英國國家醫療服務體系(NHS)已整合影像存檔,將放射診斷報告的產生時間從48小時縮短至6小時。法國健康資料中心管理Petabyte的研究數據,同時遵守法國國家資訊與自由委員會(CNIL)的隱私權要求。在南美洲,巴西的《通用資料保護法》(LGPD)和阿根廷的資料保護法已實施;在中東,「2030願景」計畫正在推動利雅德的超大規模資料中心建置。在非洲,隨著南非的銀行和奈及利亞的金融科技公司採用符合《個人資訊保護法》(POPIA)的雲端平台,成長正在加速。
其他好處
- Excel格式的市場預測(ME)表
- 3個月的分析師支持
目錄
第1章:引言
- 研究假設和市場定義
- 調查範圍
第2章:調查方法
第3章執行摘要
第4章 市場狀況
- 市場概覽
- 市場促進因素
- 非結構化企業資料呈指數級成長
- 成本優勢,從專用陣列遷移到通用硬體
- 採用混合/多重雲端需要儲存抽象。
- 利用人工智慧/機器學習實現自主儲存管理和分層
- 容器/Kubernetes原生持久性儲存需求
- 利用邊緣運算和5G建構低延遲SDS節點
- 市場限制因素
- 與傳統儲存環境整合的複雜性
- 缺乏與策略發展系統和組織轉型相關的專業技能
- 對延遲敏感型應用程式的效能確定性問題
- 標準細分會增加供應商鎖定風險。
- 產業價值鏈分析
- 監理情勢
- 技術展望
- 波特五力分析
第5章 市場規模與成長預測
- 依儲存類型
- 堵塞
- 文件
- 目的
- 超融合融合式基礎架構
- 按實現類型
- 現場
- 私有雲端
- 公共雲端
- 混合雲端
- 按組織規模
- 小型企業
- 大公司
- 按最終用戶行業分類
- 銀行、金融服務和保險(BFSI)
- 通訊和資訊技術
- 政府/公共部門
- 醫療保健和生命科學
- 製造業
- 媒體與娛樂
- 零售與電子商務
- 其他
- 按地區
- 北美洲
- 美國
- 加拿大
- 墨西哥
- 南美洲
- 巴西
- 阿根廷
- 其他南美國家
- 歐洲
- 德國
- 英國
- 法國
- 義大利
- 西班牙
- 其他歐洲國家
- 亞太地區
- 中國
- 日本
- 印度
- 韓國
- ASEAN
- 其他亞太國家
- 中東和非洲
- 中東
- 沙烏地阿拉伯
- 阿拉伯聯合大公國
- 其他中東國家
- 非洲
- 南非
- 奈及利亞
- 其他非洲地區
- 中東
- 北美洲
第6章 競爭情勢
- 市場集中度
- 策略趨勢
- 市佔率分析
- 公司簡介
- Amazon Web Services, Inc.
- Microsoft Corporation
- International Business Machines Corporation
- Dell Technologies Inc.
- Hewlett Packard Enterprise Company
- NetApp, Inc.
- Huawei Technologies Co., Ltd.
- Hitachi Vantara LLC
- Pure Storage, Inc.
- VMware, Inc.
- Nutanix, Inc.
- Oracle Corporation
- Cisco Systems, Inc.
- Fujitsu Limited
- DataCore Software Corporation
- Red Hat, Inc.
- Scality SA
- Cloudian, Inc.
- Infinidat Ltd.
- StarWind Software, Inc.
- FalconStor Software, Inc.
- Promise Technology, Inc.
- StorPool Storage AD
- MinIO, Inc.
- Qumulo, Inc.
第7章 市場機會與未來展望
According to Mordor Intelligence, the software-defined storage market size reached USD 24.27 billion in 2026 and is projected to climb to USD 75.03 billion by 2031, reflecting a 25.32% CAGR over the forecast horizon.
This report is Segmented by Storage Type (Block, File, Object, and More), Deployment Mode (On-Premises, Private Cloud, and More), Organisation Size (Small and Medium Enterprises, and Large Enterprises), End-User Industry (Banking Financial Services and Insurance, Telecom and Information Technology, and More), and Geography. The Market Forecasts are Provided in Terms of Value (USD).
Global Software-Defined Storage Market Trends and Insights
Exponential Growth of Unstructured Data
The global datasphere expanded to a larger number of zettabytes in 2025, with most of the data comprising unstructured formats, such as video, sensor logs, and imaging files. Traditional scale-up arrays cannot ingest petabyte-per-month volumes economically, so enterprises are adopting horizontally scalable software-defined clusters that stripe metadata across key-value stores for linear capacity expansion. A trade-surveillance system, for example, archives 12 terabytes daily for MiFID II compliance at one-sixth the cost of block storage, thanks to S3 pricing of USD 0.004 per gigabyte-month. Manufacturers running computer-vision inspection pump 800 gigabytes of imagery per line per day and need parallel object writes that keep latency under 100 milliseconds. Healthcare entities that rely on HIPAA rules now automate retention in software-defined archives, reducing audit preparation time by 70%.
Cost-Advantaged Shift from Proprietary Arrays to Commodity Hardware
Proprietary arrays cost USD 8-15 per usable gigabyte, while software-defined deployments on x86 servers deliver capacity at USD 0.50-2.00, a 75-90% saving. Enterprises extend hardware life by repurposing depreciated compute nodes, postponing USD 2 million in refresh spend for each 10-petabyte estate. NVMe-over-Fabrics eliminates historical latency penalties, enabling distributed storage to match array IOPS density. Emerging ARM-based clusters in India and Indonesia cut power draw 40%, lowering the total cost of ownership by another 18% in high-tariff zones.
Integration Complexity with Legacy Storage Estates
Enterprises average 11 disparate storage systems, and migrating petabytes without downtime requires meticulous zoning and LUN mapping. Fibre Channel fabrics depend on proprietary controls that do not translate to NVMe-over-TCP, so protocol gateways add latency and become single points of failure. Legacy backup tools expect tape libraries, forcing virtual-tape emulation layers that dilute cloud economics. Financial institutions on IBM z/OS cannot simply swap FICON storage for x86 targets without recompiling decades-old channel programs. Chain-of-custody proof for data under legal hold further extends migration timelines by up to six months.
Other drivers and restraints analyzed in the detailed report include:
- Hybrid and Multi-Cloud Adoption Demanding Storage Abstraction
- AI and ML-Driven Autonomous Storage Management and Tiering
- Shortage of Specialized SDS Skills and Organizational Change
For complete list of drivers and restraints, kindly check the Table Of Contents.
Segment Analysis
Object storage controlled 42.64% of the software-defined storage market share in 2025 and is forecast to grow at 26.22% CAGR on the back of S3 APIs that unify data lakes spanning on-premises and cloud buckets. The segment benefits from erasure coding that delivers eleven nines of durability at sub-USD 0.004 per gigabyte-month, reinforcing cost leadership. Block storage remains entrenched for latency-sensitive databases, integrating NVMe-over-TCP to push microsecond IOPS envelopes. File gateways layered on object back ends preserve SMB and NFS workflows for enterprise shares, broadening adoption in departmental use cases. Hyper-converged infrastructure weaves compute and storage on the same node, appealing to mid-market IT shops seeking turnkey installs. Regulatory influence steers healthcare toward object setups with WORM guarantees, while trading desks still pin core ledgers on block volumes to ensure predictable microsecond write response. The software-defined storage market size for object platforms is on track to double by 2031, supported by AI model training pipelines that demand parallel reads across thousands of GPUs. Vendors are adding GPU-direct protocols that bypass CPU copies and shave seconds off epoch times, further widening the gap with legacy arrays.
Object implementations now offer high-performance tiers using NVMe SSDs and low-cost HDD tiers in a single namespace, letting administrators define policies that age seldom-accessed logs automatically. MinIO and Ceph have shipped erasure-coding improvements that hit 90% storage efficiency on 16+4 layouts, narrowing the capacity overhead versus RAID 6. Meanwhile, cloud providers roll out single-zone turbo tiers offering sub-millisecond access for AI training, showing that object storage can satisfy both throughput and latency workloads. As enterprises adopt microservices, each service logs events directly to object buckets, eliminating the need for file systems and simplifying DevOps pipelines. Expect the software-defined storage market to see deeper convergence where object, file, and block semantics blend, driven by namespace virtualization that abstracts protocol differences.
Public cloud captured 55.83% revenue in 2025 as managed services removed procurement friction. Yet hybrid arrangements post a 26.55% CAGR because regulated sectors must keep certain data local while tapping cloud burst capacity. European banks pin primary copies on-premises for GDPR, then replicate anonymized sets to public clouds for fraud analytics, balancing compliance with scale. U.S. federal agencies lean on FedRAMP-authorized regions, but still maintain on-site replicas for continuity plans. Private clouds remain relevant among firms with sunk co-location investments, offering self-service portals that copy the hyperscale user experience. Air-gapped government networks deploy Ceph clusters for classified workloads, illustrating the role of sovereignty. Multi-cloud orchestration tools stitch policies across AWS, Azure, and Google, enabling failover without re-platforming. The software-defined storage market size tied to hybrid modes is projected to outpace pure public cloud spend beyond 2029 as organizations optimize placement for cost, latency, and regulation.
Technical innovation centers on bidirectional data mobility. Vendors now provide policy engines that snapshot on-premises VMware volumes and hydrate them natively into Amazon EBS or Azure Managed Disks. Cloud bursting for render farms has become routine, as studios spin up thousands of spot instances accessing the same object bucket. Disaster recovery RPOs have tightened to under 15 minutes through continuous-replication software that compresses and encrypts changed blocks before streaming them to target regions. Compliance audits cite immutable logs produced by software-defined platforms, reducing manual evidence collection cycles by 30%. Enterprises further adopt edge gateways that cache data locally in branch offices then migrate cold files to cloud archive tiers, reflecting a continuum rather than a binary choice between on-premises and public cloud. Consequently, the software-defined storage market continues its pivot from deployment silos to fluid data fabrics.
Complete Report Scope:
- By Storage Type
- Block
- File
- Object
- Hyper-converged Infrastructure
- By Deployment Mode
- On-premises
- Private Cloud
- Public Cloud
- Hybrid Cloud
- By Organisation Size
- Small and Medium Enterprises
- Large Enterprises
- By End-user Industry
- Banking, Financial Services and Insurance (BFSI)
- Telecom and Information Technology
- Government and Public Sector
- Healthcare and Life Sciences
- Manufacturing
- Media and Entertainment
- Retail and e-Commerce
- Other End-user Industries
- By Geography
- North America
- United States
- Canada
- Mexico
- South America
- Brazil
- Argentina
- Rest of South America
- Europe
- Germany
- United Kingdom
- France
- Italy
- Spain
- Rest of Europe
- Asia-Pacific
- China
- Japan
- India
- South Korea
- ASEAN
- Rest of Asia-Pacific
- Middle East and Africa
- Middle East
- Saudi Arabia
- United Arab Emirates
- Rest of Middle East
- Africa
- South Africa
- Nigeria
- Rest of Africa
- Middle East
- North America
Geography Analysis
North America maintained 38.73% of 2025 revenue, buoyed by hyperscaler capital expenditure topping USD 180 billion and early Kubernetes CSI adoption that provisions persistent volumes in seconds. Federal agencies leverage FedRAMP-authorized clouds to slash data-center footprints by 50%. Canadian financial firms comply with PIPEDA by retaining customer data on-premises while analytics run in cloud sandboxes. Mexico's fintech hubs adopt software-defined storage for real-time payments and data residency mandates.
Asia-Pacific advances at 26.45% CAGR, driven by China's cybersecurity law, India's Digital Public Infrastructure, and ASEAN's 5G edge rollouts. Mainland replicas stay within national borders to meet sovereign-cloud rules. India's UPI processed 11.6 billion monthly transactions by December 2025, forcing horizontally scalable clusters. Japan's privacy act catalyzes hybrid deployment among manufacturers and hospitals. South Korean carriers host AR content caches at base stations, cutting latency to 8 milliseconds. ASEAN nations establish sovereign zones that insist on local replicas.
Europe tightens controls through GDPR and the Digital Operational Resilience Act, pushing automated data classification and immutable audit trails. Germany's BSI urges multi-region replicas within EU borders. The United Kingdom's NHS consolidates imaging archives, shrinking radiology report turnaround from 48 hours to 6 hours. France's Health Data Hub manages 120 petabytes for research while upholding CNIL privacy mandates. South America rides Brazil's LGPD and Argentina's data-protection laws, while Middle East programs under Vision 2030 spur hyperscale builds in Riyadh. Africa's growth accelerates as South African banks and Nigerian fintechs adopt cloud platforms compliant with POPIA.
- Amazon Web Services, Inc.
- Microsoft Corporation
- International Business Machines Corporation
- Dell Technologies Inc.
- Hewlett Packard Enterprise Company
- NetApp, Inc.
- Huawei Technologies Co., Ltd.
- Hitachi Vantara LLC
- Pure Storage, Inc.
- VMware, Inc.
- Nutanix, Inc.
- Oracle Corporation
- Cisco Systems, Inc.
- Fujitsu Limited
- DataCore Software Corporation
- Red Hat, Inc.
- Scality SA
- Cloudian, Inc.
- Infinidat Ltd.
- StarWind Software, Inc.
- FalconStor Software, Inc.
- Promise Technology, Inc.
- StorPool Storage AD
- MinIO, Inc.
- Qumulo, Inc.
Additional Benefits:
- The market estimate (ME) sheet in Excel format
- 3 months of analyst support
TABLE OF CONTENTS
1 INTRODUCTION
- 1.1 Study Assumptions and Market Definition
- 1.2 Scope of the Study
2 RESEARCH METHODOLOGY
3 EXECUTIVE SUMMARY
4 MARKET LANDSCAPE
- 4.1 Market Overview
- 4.2 Market Drivers
- 4.2.1 Exponential Growth of Unstructured Enterprise Data
- 4.2.2 Cost-Advantaged Shift from Proprietary Arrays to Commodity Hardware
- 4.2.3 Hybrid/Multi-Cloud Adoption Demanding Storage Abstraction
- 4.2.4 AI/ML-Driven Autonomous Storage Management and Tiering
- 4.2.5 Container/Kubernetes-Native Persistent Storage Needs
- 4.2.6 Edge Computing and 5G Creating Low-Latency SDS Nodes
- 4.3 Market Restraints
- 4.3.1 Integration Complexity with Legacy Storage Estates
- 4.3.2 Shortage of Specialised SDS Skills and Organisational Change
- 4.3.3 Performance Determinism Concerns for Latency-Sensitive Apps
- 4.3.4 Fragmented Standards Increasing Vendor-Lock-In Risk
- 4.4 Indusy Value Chain Analysis
- 4.5 Regulatory Landscape
- 4.6 Technological Outlook
- 4.7 Porter's Five Forces Analysis
- 4.7.1 Bargaining Power of Suppliers
- 4.7.2 Bargaining Power of Buyers
- 4.7.3 Threat of New Entrants
- 4.7.4 Threat of Substitutes
- 4.7.5 Intensity of Competitive Rivalry
5 MARKET SIZE AND GROWTH FORECASTS (VALUE)
- 5.1 By Storage Type
- 5.1.1 Block
- 5.1.2 File
- 5.1.3 Object
- 5.1.4 Hyper-converged Infrastructure
- 5.2 By Deployment Mode
- 5.2.1 On-premises
- 5.2.2 Private Cloud
- 5.2.3 Public Cloud
- 5.2.4 Hybrid Cloud
- 5.3 By Organisation Size
- 5.3.1 Small and Medium Enterprises
- 5.3.2 Large Enterprises
- 5.4 By End-user Industry
- 5.4.1 Banking, Financial Services and Insurance (BFSI)
- 5.4.2 Telecom and Information Technology
- 5.4.3 Government and Public Sector
- 5.4.4 Healthcare and Life Sciences
- 5.4.5 Manufacturing
- 5.4.6 Media and Entertainment
- 5.4.7 Retail and e-Commerce
- 5.4.8 Other End-user Industries
- 5.5 By Geography
- 5.5.1 North America
- 5.5.1.1 United States
- 5.5.1.2 Canada
- 5.5.1.3 Mexico
- 5.5.2 South America
- 5.5.2.1 Brazil
- 5.5.2.2 Argentina
- 5.5.2.3 Rest of South America
- 5.5.3 Europe
- 5.5.3.1 Germany
- 5.5.3.2 United Kingdom
- 5.5.3.3 France
- 5.5.3.4 Italy
- 5.5.3.5 Spain
- 5.5.3.6 Rest of Europe
- 5.5.4 Asia-Pacific
- 5.5.4.1 China
- 5.5.4.2 Japan
- 5.5.4.3 India
- 5.5.4.4 South Korea
- 5.5.4.5 ASEAN
- 5.5.4.6 Rest of Asia-Pacific
- 5.5.5 Middle East and Africa
- 5.5.5.1 Middle East
- 5.5.5.1.1 Saudi Arabia
- 5.5.5.1.2 United Arab Emirates
- 5.5.5.1.3 Rest of Middle East
- 5.5.5.2 Africa
- 5.5.5.2.1 South Africa
- 5.5.5.2.2 Nigeria
- 5.5.5.2.3 Rest of Africa
- 5.5.5.1 Middle East
- 5.5.1 North America
6 COMPETITIVE LANDSCAPE
- 6.1 Market Concentration
- 6.2 Strategic Moves
- 6.3 Market Share Analysis
- 6.4 Company Profiles (includes Global level Overview, Market level overview, Core Segments, Financials as available, Strategic Information, Market Rank/Share, Products and Services, Recent Developments)
- 6.4.1 Amazon Web Services, Inc.
- 6.4.2 Microsoft Corporation
- 6.4.3 International Business Machines Corporation
- 6.4.4 Dell Technologies Inc.
- 6.4.5 Hewlett Packard Enterprise Company
- 6.4.6 NetApp, Inc.
- 6.4.7 Huawei Technologies Co., Ltd.
- 6.4.8 Hitachi Vantara LLC
- 6.4.9 Pure Storage, Inc.
- 6.4.10 VMware, Inc.
- 6.4.11 Nutanix, Inc.
- 6.4.12 Oracle Corporation
- 6.4.13 Cisco Systems, Inc.
- 6.4.14 Fujitsu Limited
- 6.4.15 DataCore Software Corporation
- 6.4.16 Red Hat, Inc.
- 6.4.17 Scality SA
- 6.4.18 Cloudian, Inc.
- 6.4.19 Infinidat Ltd.
- 6.4.20 StarWind Software, Inc.
- 6.4.21 FalconStor Software, Inc.
- 6.4.22 Promise Technology, Inc.
- 6.4.23 StorPool Storage AD
- 6.4.24 MinIO, Inc.
- 6.4.25 Qumulo, Inc.
7 MARKET OPPORTUNITIES AND FUTURE OUTLOOK
- 7.1 White-space and Unmet-Need Assessment

 軟體定義儲存市場-2026-2032年全球市場預測
 軟體定義儲存市場:按元件、儲存應用、組織規模、應用程式和地區分類
 2026年全球軟體定義儲存市場報告
 軟體定義儲存 (SDS) 市場規模、佔有率和成長分析(按組件、組織規模、部署類型、應用、最終用途和地區分類)—2026-2033 年行業預測
 美國的軟體定義製造業(SDM)市場:各解決方案,各部署模式,各用途,各終端用戶產業,各地區,機會,預測,2018年~2032年
 全球軟體定義儲存(SDS)市場
 軟體定義儲存 (SDS) 市場:全球 2025-2029
 軟體定義儲存市場規模、佔有率、趨勢分析報告:2024 年至 2031 年按組件、部署、組織規模、最終用途、應用和地區分類的展望和預測
 軟體定義儲存市場 - 按類型、企業規模、最終用戶產業、地區和競爭細分的全球產業規模、佔有率、趨勢、機會和預測。 2019-2029F