


 |
市場調查報告書
商品編碼
2073478
可攜式發電機:市場佔有率分析、行業趨勢和統計數據、成長預測(2026-2031 年)Portable Generator - Market Share Analysis, Industry Trends & Statistics, Growth Forecasts (2026 - 2031) |
||||||

※ 本網頁內容可能與最新版本有所差異。詳細情況請與我們聯繫。
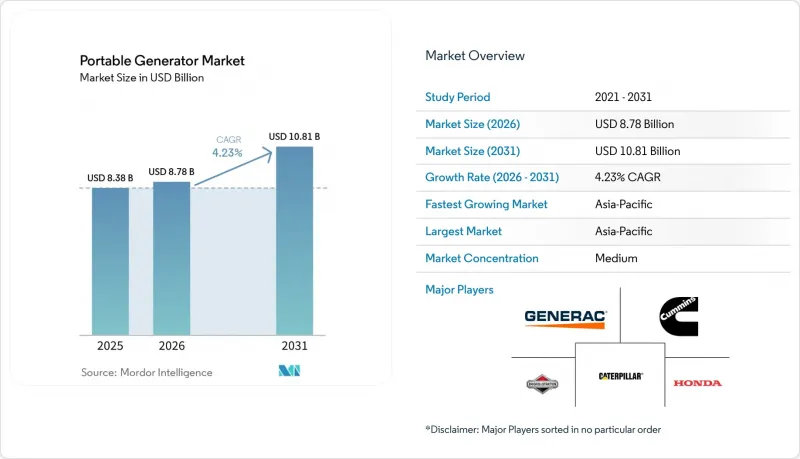
根據 Mordor Intelligence 預測,可攜式發電機市場預計將從 2025 年的 83.8 億美元成長到 2026 年的 87.8 億美元,到 2031 年達到 108.1 億美元,2026 年至 2031 年的複合年成長率預計為 4.23%。
本報告按燃料類型(汽油、柴油、雙燃料、液化石油氣/丙烷、整合式太陽能發電)、輸出等級(5kW 以下、5-10kW、10kW 以上)、技術(傳統和逆變器)、應用(緊急/備用、主要/連續運作、休閒/戶外)、最終用戶(住宅、商業、工業)和地區(北美、歐洲、亞太地區及其他地區)進行分類。
全球可攜式發電機市場趨勢與洞察
停電頻率增加,電網不穩定
氣候變遷引發的風暴、乾旱導致的水力發電受限以及電力公司採取的停電措施,都在延長停電時間,凸顯了備用電源的重要性。 2024年,美國家庭平均停電8.2小時,比2019年增加了27%。其中,德克薩斯州和加州的停電時間佔全美總停電時間的40%。在印度,2024-2025財政年度計畫停電累計達68億用戶小時,北方邦、比哈爾邦和賈坎德邦受影響最為嚴重。在巴西,創紀錄的熱浪和乾旱導致水壩蓄水不足,使得2024年的停電時間增加了14.3小時。在南非,2024年實施了118天的四級和五級計畫停電,需要額外增加2.1吉瓦的備用容量,其中35%由可攜式發電機提供。由於庫存損耗和管線凍結的保險免賠額較高,這些趨勢正在推動可攜式發電機市場向傳統颶風易發地區以外的地區擴張。
住宅用間歇式電源需求快速成長
在聯邦緊急災難管理署(FEMA) 指定的易受洪水和山火侵襲的地區,房屋抵押貸款機構現在要求借款人提供不間斷電力供應證明,並且發電機費用已包含在合約簽約費中。遠距辦公的普及加劇了停電帶來的不便。 28% 的美國員工每週至少在家工作工作三天,他們將穩定的電力供應列為決定是否居家辦公的三大因素之一。 2024 年,德國復興信貸銀行 (KfW) 提供了 8,700 萬歐元(約 9,500 萬美元)的貸款,用於升級農村家庭的家用發電機和蓄電池。根據澳洲清潔能源監管機構的一項調查,2024 年安裝的屋頂太陽能發電系統中,18% 的機組配備了與發電機相容的混合逆變器。補貼、保險激勵措施以及遠程辦公帶來的經濟效益共同推動了發電機普及率高於歷史平均水準。
小型引擎的嚴格排放氣體法規
美國環保署 (EPA) 針對 19kW 以下火星點火引擎的 Tier 4 排放標準將於 2025 年 1 月生效,強制要求配備三元觸媒轉換器和閉合迴路燃油供給系統,這將使每輛車增加 80 至 120 美元的成本。歐盟的 Stage V 排放標準提高了粒狀物排放限值,促進了攜帶式柴油引擎採用柴油顆粒過濾器 (DPF) 和選擇性催化還原 (SCR) 系統。中國的「國四」排放標準將於 2025 年 7 月起強制要求配備電子燃油噴射 (EFI) 和汽車診斷系統。在日本,目前所有公共部門採購都必須使用符合 Tier 4 標準的引擎。合規成本正在推高入門車型的價格,加速了逆變器和混合太陽能系統的普及。
細分市場分析
預計到2025年,汽油發電機仍將佔據可攜式發電機市場44.5%的佔有率,這主要得益於燃料供應充足以及400至1200美元的價格區間。整合式太陽能的混合動力發電機正以9.7%的複合年成長率成長,這主要受離網通訊設備和房車(休閒車)需求的推動。由於第五階段後處理系統的重量和成本增加,柴油發電機在非重型應用領域的市佔率正在下降。採用汽油-丙烷混合燃料的雙燃料發電機受到美國農村地區買家的青睞,他們重視丙烷的長保存期限(18個月)和低碳特性。
在非洲的通訊塔站點,結合太陽能、電池和發電機的混合動力系統已將柴油消耗量減少了高達 80%,每個節點每年可節省 3,200 美元的燃料物流成本。 Jackery 和 EcoFlow 等電力品牌在 2024 年交付了 89 萬套太陽能發電裝置,這些裝置將折疊式太陽能板與 1-3kWh 的電池結合。在日照充足的地區,其平準化發電成本低於 0.30 美元/kWh時,比純柴油系統成本優勢高達 40%。
到2025年,5-10kW功率等級的可攜式發電機市場47.9%的佔有率,滿足整個住宅和餐車的備用電源需求。然而,5kW以下功率等級的發電機正以6.1%的複合年成長率快速成長,這主要得益於公寓和戶外聚會等應用場景的推動。雖然10kW以上功率等級的發電機仍是工業應用的主流,但正逐漸被租賃車隊取代。
都市區噪音法規,例如洛杉磯規定7公尺距離處噪音不得超過60分貝,使得大多數開放式空調無法使用,促使消費者轉向噪音低於58分貝的緊湊型變頻空調。東京和新加坡也實施了類似的夜間噪音限制,促使原始設備製造商(OEM)開發隔音罩。一台7千瓦、重55公斤的變頻空調無需永久性傳輸開關即可滿足單戶住宅80%的用電需求,在便攜性和容量之間取得了平衡。
區域分析
到2025年,亞太地區將佔全球攜帶式發電機銷售額的38.6%,預計到2031年,該地區可攜式發電機市場將以4.9%的複合年成長率成長,這主要得益於基礎設施建設和農村地區通訊網路的發展。印度經歷了68億小時的停電,這刺激了住宅和中小企業對攜帶式發電機的需求。同時,中國已在農村地區安裝了8.7萬個5G基地台,其中41%的基地台由太陽能和柴油混合動力發電機運作。東協總額達890億美元的官民合作關係(PPP)計畫規定,橋樑和隧道建設必須使用可攜式發電機。
北美則位居第二,這主要得益於美國1.42億戶獨棟住宅。預計到2024年,停電事故發生率將上升至每公升燃油8.2起,將推動混合動力發電機普及率的提高。同時,加拿大北部的礦場依靠混合動力發電機來抵消每公升2.5美元的空運柴油成本。在墨西哥,近岸外包浪潮正在提振建築需求,預計2024年工業園區競標中,68%的專案都需要安裝臨時電力。
在柴油價格飆升的背景下,符合排放氣體法規的逆變器和混合動力系統推動了歐洲的成長。德國在2024年向14,300戶家庭發放了用於提高農村地區電力韌性的貸款。同時,在英國,諸如「阿爾文」風暴等大規模停電事件促使政府改革補償機制,優先考慮現場備用電源。法國警告稱,冬季用電尖峰時段可能出現電力供應緊張,這推動了工業備用電源的普及。然而,在北歐市場,隨著露營車的日益普及,休閒用電的需求正在穩步成長。
其他好處
- Excel格式的市場預測(ME)表
- 3個月的分析師支持
目錄
第1章:引言
- 研究假設和市場定義
- 調查範圍
第2章:調查方法
第3章執行摘要
第4章 市場狀況
- 市場概覽
- 市場促進因素
- 停電頻率增加,電網不穩定
- 住宅用電間歇性需求激增
- 新興國家建設活動的擴張
- 休閒車輛和戶外休閒的蓬勃發展
- 家庭微型資料中心(邊緣運算)的成長
- 在離網通訊塔中混合使用太陽能和柴油動力
- 市場限制因素
- 小型引擎的嚴格排放氣體法規
- 住宅電池儲能系統的普及
- 都市區噪音管制區對發電機運作運作有限制
- 鋰離子可攜式電源(功率小於2千瓦)的銷售蠶食
- 供應鏈分析
- 監理情勢
- 技術展望
- 波特五力分析
- 投資分析
第5章 市場規模與成長預測
- 按燃料類型
- 汽油
- 柴油引擎
- 雙燃料(汽油/丙烷)
- 液化石油氣/丙烷
- 整合太陽能發電
- 按輸出類別
- 5千瓦或以下
- 5~10kW
- 10千瓦或以上
- 透過技術
- 傳統的
- 逆變器型
- 透過使用
- 應急/備用
- 用於主電源/用於連續運行
- 用於休閒/戶外活動
- 最終用戶
- 住宅
- 商業
- 產業
- 按地區
- 北美洲
- 美國
- 加拿大
- 墨西哥
- 歐洲
- 德國
- 英國
- 法國
- 西班牙
- 北歐國家
- 俄羅斯
- 其他歐洲國家
- 亞太地區
- 中國
- 印度
- 日本
- 韓國
- ASEAN
- 澳洲和紐西蘭
- 其他亞太國家
- 南美洲
- 巴西
- 阿根廷
- 哥倫比亞
- 其他南美國家
- 中東和非洲
- 沙烏地阿拉伯
- 阿拉伯聯合大公國
- 南非
- 埃及
- 其他中東和非洲國家
- 北美洲
第6章 競爭情勢
- 市場集中度
- 策略趨勢(併購、聯盟、購電協議)
- 市場佔有率分析(主要公司的市場排名和佔有率)
- 公司簡介
- Generac Holdings Inc.
- Honda Motor Co. Ltd.
- Caterpillar Inc.
- Briggs & Stratton LLC
- Cummins Inc.
- Kohler Co.
- Yamaha Motor Co. Ltd.
- Atlas Copco AB
- Wacker Neuson SE
- Champion Power Equipment Inc.
- Westinghouse Electric Corp.
- Doosan Portable Power
- Hyundai Power Equipment Co.
- FG Wilson(Caterpillar UK)
- Perkins Engines Company Ltd.
- DuroMax Power Equipment
- Wen Products
- Jackery Inc.(Solar)
- EcoFlow Tech Ltd.(Battery)
- Anker Innovations Ltd.(Battery)
第7章 市場機會與未來展望
According to Mordor Intelligence, the portable generator market size is expected to increase from USD 8.38 billion in 2025 to USD 8.78 billion in 2026 and reach USD 10.81 billion by 2031, growing at a CAGR of 4.23% over 2026-2031.
This report is Segmented by Fuel Type (Gasoline, Diesel, Dual-Fuel, LPG/Propane, and Solar-Integrated), Power Rating (Below 5 KW, 5 To 10 KW, and Above 10 KW), Technology (Conventional and Inverter), Application (Emergency/Stand-by, Prime/Continuous, and Recreational/Outdoor), End User (Residential, Commercial, and Industrial), and Geography (North America, Europe, Asia-Pacific, South America, and More).
Global Portable Generator Market Trends and Insights
Increasing Frequency of Power Outages & Grid Instability
Climate-driven storms, drought-strained hydropower, and utility de-energization events are lengthening outage hours, elevating the value of on-site generation. U.S. households endured 8.2 outage hours in 2024, up 27% from 2019, while Texas and California accounted for 40% of national downtime. India recorded 6.8 billion customer-hours of load-shedding during fiscal 2024-2025, with Uttar Pradesh, Bihar, and Jharkhand hardest hit. Brazil's outage duration rose to 14.3 hours in 2024 amid record heat and drought-hit dams. South Africa imposed stage-4 and stage-5 load-shedding on 118 days in 2024, driving 2.1 GW of incremental standby capacity, 35% of which involved portable units. Alongside steep insurance deductibles for spoiled inventory and frozen pipes, these trends are broadening the portable generator market beyond traditional hurricane-prone zones.
Rapid Growth in Residential Backup-Power Demand
Mortgage lenders now require backup-power attestations in FEMA flood and wildfire zones, embedding generator costs into closing fees. Remote work intensifies outage pain points: 28% of U.S. employees work from home at least three days weekly and cite power reliability as a top-three relocation factor. Germany's KfW financed EUR 87 million (USD 95 million) of home generator and battery upgrades for rural households in 2024. Australia's Clean Energy Regulator found that 18% of 2024 rooftop-solar installs included a generator-ready hybrid inverter. Collectively, subsidies, insurance incentives, and telework economics lift attach rates above historical norms.
Stringent Emission Regulations on Small Engines
The U.S. EPA's Tier 4 rules for sub-19 kW spark-ignition engines took effect in January 2025, forcing three-way catalysts and closed-loop fueling that add USD 80-120 per unit. EU Stage V raises particulate-number limits, driving diesel particulate filters and SCR on portable diesels. China's National IV standards mandate EFI and onboard diagnostics from July 2025. Japan now requires Tier-4-equivalent engines in all public-sector procurements. Compliance costs squeeze entry pricing and accelerate the shift toward inverter and hybrid-solar architectures.
Other drivers and restraints analyzed in the detailed report include:
- Expanding Construction Activities in Emerging Economies
- Recreational Vehicle & Outdoor Leisure Boom
- Adoption of Residential Battery-Storage Systems
For complete list of drivers and restraints, kindly check the Table Of Contents.
Segment Analysis
Gasoline units retained 44.5% portable generator market share in 2025, benefiting from widespread fuel availability and USD 400-1,200 pricing, yet solar-integrated hybrids are growing 9.7% CAGR on off-grid telecom and RV demand. Diesel models face weight and cost penalties from Stage V after-treatment, losing ground outside heavy-duty sites. Dual-fuel gasoline-propane designs win rural U.S. buyers who prize 18-month propane shelf life and lower carbon intensity.
Hybrid solar-battery-generator systems slash diesel use by up to 80% at African tower sites, trimming annual fuel logistics by USD 3,200 per node. Power-station brands such as Jackery and EcoFlow shipped 890,000 solar-ready units in 2024, combining foldable PV with 1-3 kWh batteries. Levelized energy costs drop below USD 0.30/kWh in high-insolation zones, a 40% edge over diesel-only setups.
The 5-10 kW class represented 47.9% of the portable generator market size in 2025, addressing whole-home backup and food-truck power, yet sub-5 kW units are advancing 6.1% CAGR on apartment and tailgating use cases. Units above 10 kW remain industrial staples but face rental-fleet substitution.
Urban decibel caps, such as Los Angeles' 60 dBA at 7 m, disqualify most open-frame models, pushing consumers toward compact inverters under 58 dBA. Tokyo and Singapore impose similar nighttime limits, spurring OEM acoustic enclosures. A 7 kW inverter weighing 55 kg meets 80% of single-family loads without permanent transfer switches, balancing portability with capacity.
Complete Report Scope:
- By Fuel Type
- Gasoline
- Diesel
- Dual-Fuel (Gasoline-Propane)
- LPG/Propane
- Solar-Integrated
- By Power Rating
- Below 5 kW
- 5 to 10 kW
- Above 10 kW
- By Technology
- Conventional
- Inverter
- By Application
- Emergency/Stand-by
- Prime/Continuous
- Recreational/Outdoor
- By End User
- Residential
- Commercial
- Industrial
- By Geography
- North America
- United States
- Canada
- Mexico
- Europe
- Germany
- United Kingdom
- France
- Spain
- NORDIC Countries
- Russia
- Rest of Europe
- Asia-Pacific
- China
- India
- Japan
- South Korea
- ASEAN Countries
- Australia and New Zealand
- Rest of Asia-Pacific
- South America
- Brazil
- Argentina
- Colombia
- Rest of South America
- Middle East and Africa
- Saudi Arabia
- United Arab Emirates
- South Africa
- Egypt
- Rest of Middle East and Africa
- North America
Geography Analysis
Asia-Pacific controlled 38.6% of 2025 revenue, and the portable generator market size in the region will grow at a 4.9% CAGR through 2031 on infrastructure and rural-telecom build-outs. India logged 6.8 billion outage-hours, spurring residential and SME purchases, while China deployed 87,000 rural 5G base stations, 41% powered by solar-diesel hybrids. ASEAN PPP pipelines worth USD 89 billion specify portable units for bridge and tunnel works.
North America ranks second, anchored by the United States' 142 million single-family homes. Outage hours rose to 8.2 in 2024, elevating attach rates, while Canada's northern mines rely on hybrid gensets to offset USD 2.50-per-liter air-lifted diesel. Mexico's near-shoring wave pushes construction demand, with 68% of industrial-park tenders in 2024 requiring temporary generators.
Europe's growth hinges on emission-compliant inverters and hybrids amid high diesel costs. Germany's rural-resilience loans covered 14,300 households in 2024, while Storm Arwen-style blackouts prompted U.K. compensation reforms that favor onsite backup. France warns of winter peak constraints, driving industrial standby installs, whereas Nordic markets see modest recreational growth tied to camper-van adoption.
- Generac Holdings Inc.
- Honda Motor Co. Ltd.
- Caterpillar Inc.
- Briggs & Stratton LLC
- Cummins Inc.
- Kohler Co.
- Yamaha Motor Co. Ltd.
- Atlas Copco AB
- Wacker Neuson SE
- Champion Power Equipment Inc.
- Westinghouse Electric Corp.
- Doosan Portable Power
- Hyundai Power Equipment Co.
- FG Wilson (Caterpillar UK)
- Perkins Engines Company Ltd.
- DuroMax Power Equipment
- Wen Products
- Jackery Inc. (Solar)
- EcoFlow Tech Ltd. (Battery)
- Anker Innovations Ltd. (Battery)
Additional Benefits:
- The market estimate (ME) sheet in Excel format
- 3 months of analyst support
TABLE OF CONTENTS
1 Introduction
- 1.1 Study Assumptions & Market Definition
- 1.2 Scope of the Study
2 Research Methodology
3 Executive Summary
4 Market Landscape
- 4.1 Market Overview
- 4.2 Market Drivers
- 4.2.1 Increasing frequency of power outages & grid instability
- 4.2.2 Rapid growth in residential backup-power demand
- 4.2.3 Expanding construction activities in emerging economies
- 4.2.4 Recreational vehicle & outdoor leisure boom
- 4.2.5 Growth of home-based micro-data-centres (edge)
- 4.2.6 Hybrid solar-diesel use at off-grid telecom towers
- 4.3 Market Restraints
- 4.3.1 Stringent emission regulations on small engines
- 4.3.2 Adoption of residential battery storage systems
- 4.3.3 Urban noise-zoning curfews on generator run-time
- 4.3.4 Lithium portable power-stations cannibalising <2 kW sales
- 4.4 Supply-Chain Analysis
- 4.5 Regulatory Landscape
- 4.6 Technological Outlook
- 4.7 Porter's Five Forces Analysis
- 4.7.1 Bargaining Power of Suppliers
- 4.7.2 Bargaining Power of Consumers
- 4.7.3 Threat of New Entrants
- 4.7.4 Threat of Substitutes
- 4.7.5 Intensity of Rivalry
- 4.8 Investment Analysis
5 Market Size & Growth Forecasts
- 5.1 By Fuel Type
- 5.1.1 Gasoline
- 5.1.2 Diesel
- 5.1.3 Dual-Fuel (Gasoline-Propane)
- 5.1.4 LPG/Propane
- 5.1.5 Solar-Integrated
- 5.2 By Power Rating
- 5.2.1 Below 5 kW
- 5.2.2 5 to 10 kW
- 5.2.3 Above 10 kW
- 5.3 By Technology
- 5.3.1 Conventional
- 5.3.2 Inverter
- 5.4 By Application
- 5.4.1 Emergency/Stand-by
- 5.4.2 Prime/Continuous
- 5.4.3 Recreational/Outdoor
- 5.5 By End User
- 5.5.1 Residential
- 5.5.2 Commercial
- 5.5.3 Industrial
- 5.6 By Geography
- 5.6.1 North America
- 5.6.1.1 United States
- 5.6.1.2 Canada
- 5.6.1.3 Mexico
- 5.6.2 Europe
- 5.6.2.1 Germany
- 5.6.2.2 United Kingdom
- 5.6.2.3 France
- 5.6.2.4 Spain
- 5.6.2.5 NORDIC Countries
- 5.6.2.6 Russia
- 5.6.2.7 Rest of Europe
- 5.6.3 Asia-Pacific
- 5.6.3.1 China
- 5.6.3.2 India
- 5.6.3.3 Japan
- 5.6.3.4 South Korea
- 5.6.3.5 ASEAN Countries
- 5.6.3.6 Australia and New Zealand
- 5.6.3.7 Rest of Asia-Pacific
- 5.6.4 South America
- 5.6.4.1 Brazil
- 5.6.4.2 Argentina
- 5.6.4.3 Colombia
- 5.6.4.4 Rest of South America
- 5.6.5 Middle East and Africa
- 5.6.5.1 Saudi Arabia
- 5.6.5.2 United Arab Emirates
- 5.6.5.3 South Africa
- 5.6.5.4 Egypt
- 5.6.5.5 Rest of Middle East and Africa
- 5.6.1 North America
6 Competitive Landscape
- 6.1 Market Concentration
- 6.2 Strategic Moves (M&A, Partnerships, PPAs)
- 6.3 Market Share Analysis (Market Rank/Share for key companies)
- 6.4 Company Profiles (includes Global level Overview, Market level overview, Core Segments, Financials as available, Strategic Information, Products & Services, and Recent Developments)
- 6.4.1 Generac Holdings Inc.
- 6.4.2 Honda Motor Co. Ltd.
- 6.4.3 Caterpillar Inc.
- 6.4.4 Briggs & Stratton LLC
- 6.4.5 Cummins Inc.
- 6.4.6 Kohler Co.
- 6.4.7 Yamaha Motor Co. Ltd.
- 6.4.8 Atlas Copco AB
- 6.4.9 Wacker Neuson SE
- 6.4.10 Champion Power Equipment Inc.
- 6.4.11 Westinghouse Electric Corp.
- 6.4.12 Doosan Portable Power
- 6.4.13 Hyundai Power Equipment Co.
- 6.4.14 FG Wilson (Caterpillar UK)
- 6.4.15 Perkins Engines Company Ltd.
- 6.4.16 DuroMax Power Equipment
- 6.4.17 Wen Products
- 6.4.18 Jackery Inc. (Solar)
- 6.4.19 EcoFlow Tech Ltd. (Battery)
- 6.4.20 Anker Innovations Ltd. (Battery)
7 Market Opportunities & Future Outlook
- 7.1 White-space & Unmet-need Assessment

 工業可攜式發電機市場預測至2034年—按燃料類型、額定功率、便攜性、應用、最終用戶和地區分類的全球分析
 可攜式發電機市場:2026-2032年全球市場預測(按燃料類型、技術類型、額定功率、運作模式、相數、銷售管道、應用和最終用戶分類)
 可攜式發電機市場規模、佔有率、趨勢和預測:按燃料類型、應用、輸出功率和地區分類,2026-2034年
 可攜式發電機市場:按燃料類型、輸出功率、應用和地區分類
 全球可攜式發電機市場規模、佔有率、趨勢和成長分析報告(2026-2034年)
 2026年全球可攜式發電機市場報告
 可攜式發電機市場 - 全球產業規模、佔有率、趨勢、機會及預測(按功率容量、燃料類型、應用、最終用途、地區和競爭格局分類,2021-2031年)日本攜帶式發電機市場報告(按燃料類型、應用、功率輸出和地區分類,2026-2034年)全球可攜式發電機產業市場:成長機會(2025-2035 年)
 住宅可攜式發電機:全球市場佔有率和排名、總收入和需求預測(2025-2031 年)