


 |
市場調查報告書
商品編碼
2073473
液化天然氣(LNG):市場佔有率分析、產業趨勢與統計數據、成長預測(2026-2031)Liquefied Natural Gas (LNG) - Market Share Analysis, Industry Trends & Statistics, Growth Forecasts (2026 - 2031) |
||||||

※ 本網頁內容可能與最新版本有所差異。詳細情況請與我們聯繫。
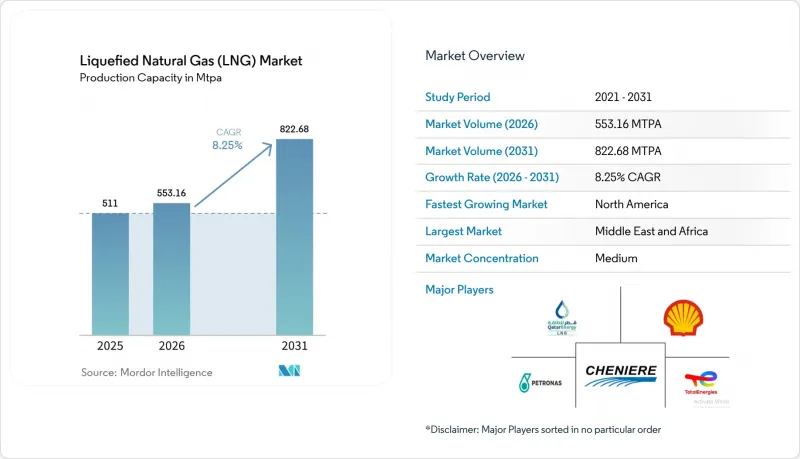
據 Mordor Intelligence 稱,液化天然氣 (LNG) 市場規模預計在 2026 年達到 553.16 MTPA,高於 2025 年的 511 MTPA,預計到 2031 年將達到 822.68 MTPA。
預計從 2026 年到 2031 年,其複合年成長率將達到 8.25%。
本報告按基礎設施類型(液化天然氣工廠、液化天然氣再氣化設施、液化天然氣運輸船隊)、最終用途(發電、工業/製造業、其他)、規模(大型、中型、小規模)、位置(陸上和海上)以及地區(北美、歐洲、亞太地區、南美、中東和非洲)進行分類。
全球液化天然氣(LNG)市場趨勢及洞察
隨著亞太地區天然氣發電工程的激增,對中游液化天然氣運輸合約的需求也日益成長。
亞太地區的電力公司正在新增超過1,000億立方公尺的天然氣再氣化產能,印度計畫在2030年將其天然氣消費量提高60%。各國的脫碳目標正加速從煤炭到天然氣的轉型,並將液化天然氣供應與購電協議直接掛鉤的一體化合約也正在推廣中。這種緊密的協調降低了資金籌措風險,提高了專案的銀行融資合格,並增強了液化天然氣市場的長期需求。
液化天然氣作為船用燃料的迅速普及是由歐洲國際海事組織 (IMO) 2020 年的硫排放法規引發的。
預計2024年,全球液化天然氣(LNG)動力船舶數量將增加33%,達到638艘,到2028年將超過1,200艘。貨櫃航運公司佔LNG動力船舶載重噸位的60%,並正在加速198個港口的加註基礎建設。隨著生物LNG計畫的推進,液化天然氣(LNG)市場正獲得進一步發展動力,這些計畫將有助於滿足未來的排放管理體制。
EPC成本不斷上漲和組件製造瓶頸導致FID(首次檢驗日)流程延長。
2024年,僅有1,480萬噸/年的產能專案最終獲得投資決策(FID),由於成本上漲20-30%以及人手不足,這一數字大幅下降。儘管設備價格飆升,模組化建造模式仍獲得市場認可,但延誤可能導致2027年至2029年間出現供應缺口,進而可能影響整個液化天然氣市場。
細分市場分析
到2025年,液化天然氣工廠將佔總銷售額的42.60%,成為液化天然氣市場中佔最大佔有率的環節。卡達、美國和澳洲產能的擴張是2031年預計複合年成長率達到10.75%的基礎。電動壓縮機和碳捕獲技術的減量排放進一步加劇了大型綜合企業之間的競爭。
該領域的生態系統目前包含904艘液化天然氣裝運船隻,其中許多配備了低甲烷洩漏引擎,以降低溫室氣體排放強度。浮式儲存再氣化裝置(FSRU)正在加速液化天然氣進口成長,尤其是在歐洲,自2021年以來,每年新增7,700萬毫升再氣化能力,凸顯了模組化部署在液化天然氣市場的有效性。
預計到2025年,發電業將佔總需求的37.70%,並透過亞洲的液化天然氣發電整合計畫持續擴張。這些項目透過整合終端、儲存和發電資產,降低了信用風險,並進一步鞏固了液化天然氣市場。
預計船用燃料供應將以13.55%的複合年成長率成長,在所有應用領域中成長最高。船隊規模、港口燃料供應網路以及生物液化天然氣試點計畫均顯示該市場將持續成長,航運業正逐漸成為液化天然氣市場的重要推動力量。
區域分析
預計到2025年,中東和非洲將佔據27.60%的市場。卡達北方氣田的產能將於2027年從每年7,700萬噸提升至1.26億噸,這將鞏固其在該地區的主導地位,並提升歐亞之間運輸路線的柔軟性。阿拉伯聯合大公國和茅利塔尼亞的新業務正在增加市場深度,但途經霍爾木茲海峽的油輪保險成本仍然是液化天然氣市場營運中需要關注的問題。
北美地區頁岩氣資源豐富,一座年產量達 1,330 萬噸的出口工廠將於 2025 年運作,預計到 2031 年,北美液化天然氣市場將以 10.25% 的複合年成長率成長。由於加拿大基蒂馬特液化天然氣工廠投產以及亨利樞紐液化天然氣項目的相關協議,買家的興趣日益濃厚,但由於臨時許可程序的延誤,預計在 2020 年代中期做出最終投資決定 (FID) 的可能性不大。
亞太地區仍是液化天然氣市場最大的進口中心,預計中國將在2024年進口7,864萬噸。菲律賓和越南等新興進口國正在擴大基本客群,而小規模液化天然氣分銷在島嶼地區也迅速發展。日本和韓國可再生能源的成長以及氫能試點項目,為該地區的液化天然氣消費帶來了長期的不確定性。
自2021年以來,歐洲的再氣化能力成長了44%,並投入使用多個浮式儲存再氣化裝置(FSRU)以補充來自俄羅斯的管線供應。由於季節性需求激增,溢價得以維持。隨著歐盟甲烷排放法規即將生效,預計整個液化天然氣市場的供應鏈監控將增加。
其他好處
- Excel格式的市場預測(ME)表
- 3個月的分析師支持
目錄
第1章:引言
- 研究假設和市場定義
- 調查範圍
第2章:調查方法
第3章執行摘要
第4章 市場狀況
- 市場概覽
- 市場促進因素
- 亞太地區天然氣發電計畫激增:旨在確保中游液化天然氣運輸合約。
- 歐洲國際海事組織-2020年硫排放法規實施後,液化天然氣作為船用燃料迅速普及
- 二疊紀盆地聯產氣生產確保了美國墨西哥灣沿岸出口碼頭獲得低成本的原料天然氣。
- 浮體式液化天然氣技術能夠開發非洲偏遠的海上天然氣田。
- 中國工業鍋爐從煤炭轉向天然氣的政策正在推動現貨液化天然氣進口。
- 經合組織市場中能源密集型資料中心對可靠的低碳電力供應的需求日益成長。
- 市場限制因素
- EPC成本不斷上漲和組件製造瓶頸導致FID(首次檢驗日)流程延長。
- 來自可再生氫能的競爭正在降低東北亞地區對長期液化天然氣合約的興趣。
- 美國和加拿大暫停發放新的液化天然氣出口許可證
- 關鍵戰略要地(霍爾木茲、蘇伊士)的地緣政治風險,以及液化天然氣運輸保險成本飆升。
- 供應鏈分析
- 監理展望
- 技術展望
- 波特五力模型
第5章 市場規模與成長預測
- 依基礎設施類型
- 液化天然氣工廠[陸上液化、浮體式液化天然氣(FLNG)、中型(1-5 百萬噸/年)、小規模(小於 1 百萬噸/年)]
- 液化天然氣再氣化設施[陸上進口終端及浮體式儲存再氣化裝置(FSRU)]
- LNG運輸船隊[依儲存方式(莫斯式和膜式)和船體尺寸(Q-Max、Q-Flex、標準型)分類的LNG裝運船隻和LNG燃料庫船]
- 按最終用途
- 發電
- 工業和製造業
- 住宅和商業
- 運輸(船舶燃料供應、重型道路運輸、鐵路運輸)
- 按尺寸
- 大型(500萬噸/年或以上)
- 中等規模(1-500萬噸/年)
- 小規模(小於100萬噸/年)
- 按位置
- 土地
- 海上(FLNG 和 FSRU)
- 按地區
- 北美洲
- 美國
- 加拿大
- 墨西哥
- 歐洲
- 英國
- 德國
- 法國
- 西班牙
- 北歐國家
- 俄羅斯
- 其他歐洲國家
- 亞太地區
- 中國
- 印度
- 日本
- 韓國
- ASEAN
- 澳洲
- 其他亞太國家
- 南美洲
- 巴西
- 阿根廷
- 哥倫比亞
- 其他南美國家
- 中東和非洲
- 阿拉伯聯合大公國
- 沙烏地阿拉伯
- 卡達
- 南非
- 埃及
- 其他中東和非洲國家
- 北美洲
第6章 競爭情勢
- 市場集中度
- 策略趨勢(併購、聯盟、購電協議)
- 市場佔有率分析(主要公司的市場排名和市場佔有率)
- 公司簡介
- QatarEnergy LNG(Qatargas)
- Shell plc
- Cheniere Energy Inc.
- TotalEnergies SE
- Petronas
- Novatek
- Chevron Corporation
- Exxon Mobil Corporation
- Woodside Energy Group
- Equinor ASA
- Sempra Infrastructure
- Venture Global LNG
- ENI SpA
- KOGAS
- Mitsui OSK Lines
- Golar LNG
- BW LNG
- Technip Energies
- Bechtel Corporation
- Fluor Corporation
- KBR Inc.
第7章 市場機會與未來展望
According to Mordor Intelligence, liquefied natural gas market size in 2026 is estimated at 553.16 MTPA, growing from 2025 value of 511 MTPA with 2031 projections showing 822.68 MTPA, growing at 8.25% CAGR over 2026-2031.
This report is Segmented by Infrastructure Type (LNG Liquefaction Plants, LNG Regasification Facilities, and LNG Shipping Fleet), End-Use Application (Power Generation, Industrial and Manufacturing, and Others), Scale (Large-Scale, Mid-Scale, and Small-Scale), Location (Onshore and Offshore), and Geography (North America, Europe, Asia-Pacific, South America, and Middle East and Africa).
Global Liquefied Natural Gas (LNG) Market Trends and Insights
Surge in Asia-Pacific Gas-to-Power Projects Seeking Midstream LNG Offtake Agreements
Asia-Pacific utilities are adding over 100 bcm of new regasification capacity, and India plans to lift gas consumption 60% by 2030. National decarbonization targets are accelerating coal-to-gas switching and prompting integrated contracts that link LNG supply directly to power-purchase deals. This tight coupling lowers financing risk, improves project bankability, and reinforces long-run demand for the liquefied natural gas market.
Rapid Uptake of LNG as Marine Bunker Fuel Following IMO-2020 Sulfur Cap in Europe
The global LNG-fueled fleet grew 33% in 2024 to 638 vessels and is expected to exceed 1,200 ships by 2028. Container lines represent 60% of LNG-propelled deadweight tonnage, driving accelerated bunker-infrastructure rollout in 198 ports. The liquefied natural gas market is picking up additional momentum from bio-LNG initiatives that extend compliance into future emissions-control regimes.
Prolonged FID Delays Owing to EPC-Cost Inflation & Module Fabrication Bottlenecks
Just 14.8 MTPA of capacity reached FID in 2024, down sharply amid 20-30% cost jumps and labor shortages. Modular construction is gaining favor despite higher equipment prices, yet delays could open a supply gap in 2027-2029, inducing volatility across the liquefied natural gas market.
Other drivers and restraints analyzed in the detailed report include:
- Permian Basin Associated Gas Output Unlocks Low-Cost Feedgas for U.S. Gulf-Coast Export Terminals
- Floating LNG Technology Unlocking Stranded Offshore Gas Fields in Africa
- Competitiveness of Renewable Hydrogen Eroding Long-Term LNG Contract Appetite in Northeast Asia
For complete list of drivers and restraints, kindly check the Table Of Contents.
Segment Analysis
Liquefaction plants held 42.60% of 2025 revenues, the highest within the liquefied natural gas market. Capacity boosts in Qatar, the United States, and Australia underpin a forecast 10.75% CAGR to 2031. Electrified compressors and carbon capture trim emissions and sharpen competitive edges for integrated majors.
The segment's ecosystem now includes 904 LNG carriers, many fitted with low-methane-slip engines that curb greenhouse-gas intensity. FSRUs are accelerating import growth, especially in Europe, adding 77 MMtpy of regas capacity since 2021 and validating modular deployment for the LNG market.
Power generation retained 37.70% of demand in 2025 and is expanding through integrated LNG-to-power projects in Asia. These setups consolidate terminal, storage, and generation assets, lowering credit risk and deepening the LNG market footprint.
Marine bunkering is poised for a 13.55% CAGR, the fastest among applications. Fleet counts, port bunkering networks, and bio-LNG pilots signal durable growth, positioning shipping as a dynamic contributor to the liquefied natural gas market.
Complete Report Scope:
- By Infrastructure Type
- LNG Liquefaction Plants [Onshore Liquefaction, Floating LNG (FLNG), Mid-Scale (1-5 mtpa), and Small-Scale (<1 mtpa)]
- LNG Regasification Facilities [Onshore Import Terminals, and Floating Storage & Regasification Units (FSRU)]
- LNG Shipping Fleet [LNG Carriers by Containment (Moss and Membrane), Carrier Size (Q-Max, Q-Flex and Standard), LNG Bunkering Vessels]
- By End-Use Application
- Power Generation
- Industrial and Manufacturing
- Residential and Commercial
- Transportation (Marine Bunkering, Heavy-Duty Road Transport and Rail)
- By Scale
- Large-Scale (Above 5 mtpa)
- Mid-Scale (1 to 5 mtpa)
- Small-Scale (Below 1 mtpa)
- By Location
- Onshore
- Offshore (FLNG and FSRU)
- By Geography
- North America
- United States
- Canada
- Mexico
- Europe
- United Kingdom
- Germany
- France
- Spain
- Nordic Countries
- Russia
- Rest of Europe
- Asia-Pacific
- China
- India
- Japan
- South Korea
- ASEAN Countries
- Australia
- Rest of Asia-Pacific
- South America
- Brazil
- Argentina
- Colombia
- Rest of South America
- Middle East and Africa
- United Arab Emirates
- Saudi Arabia
- Qatar
- South Africa
- Egypt
- Rest of Middle East and Africa
- North America
Geography Analysis
The Middle East & Africa held 27.60% of the 2025 market. Qatar's North Field build-out from 77 MTPA to 126 MTPA by 2027 cements regional leadership and improves routing flexibility between Europe and Asia. New UAE and Mauritanian ventures add depth, though tanker insurance costs through Hormuz remain an operational concern for the liquefied natural gas market.
North America is set for a 10.25% CAGR through 2031 in the LNG market, driven by abundant shale gas and 13.3 MTPA of export trains entering service in 2025. Canada's Kitimat start-up and Henry-Hub-linked contracts amplify buyer interest, although temporary permitting pauses temper mid-decade FID outlooks.
Asia-Pacific remains the largest import center in the LNG market, with China purchasing 78.64 million t in 2024. First-time importers in the Philippines and Vietnam broaden the customer base, while small-scale LNG distribution gains traction for archipelagic supply. Renewable energy growth and hydrogen pilots in Japan and South Korea inject longer-term uncertainty into regional consumption.
Europe expanded regas capacity by 44% since 2021, installing multiple FSRUs to replace Russian pipeline volumes. Seasonal demand spikes sustain premium pricing, and impending EU methane rules will intensify supply-chain monitoring across the liquefied natural gas market.
- QatarEnergy LNG (Qatargas)
- Shell plc
- Cheniere Energy Inc.
- TotalEnergies SE
- Petronas
- Novatek
- Chevron Corporation
- Exxon Mobil Corporation
- Woodside Energy Group
- Equinor ASA
- Sempra Infrastructure
- Venture Global LNG
- ENI SpA
- KOGAS
- Mitsui O.S.K. Lines
- Golar LNG
- BW LNG
- Technip Energies
- Bechtel Corporation
- Fluor Corporation
- KBR Inc.
Additional Benefits:
- The market estimate (ME) sheet in Excel format
- 3 months of analyst support
TABLE OF CONTENTS
1 Introduction
- 1.1 Study Assumptions & Market Definition
- 1.2 Scope of the Study
2 Research Methodology
3 Executive Summary
4 Market Landscape
- 4.1 Market Overview
- 4.2 Market Drivers
- 4.2.1 Surge in Asia-Pacific Gas-to-Power Projects Seeking Midstream LNG Offtake Agreements
- 4.2.2 Rapid Uptake of LNG as Marine Bunker Fuel Following IMO-2020 Sulfur Cap in Europe
- 4.2.3 Permian Basin Associated Gas Output Unlocks Low-Cost Feed-gas for U.S. Gulf-Coast Export Terminals
- 4.2.4 Floating LNG Technology Unlocking Stranded Offshore Gas Fields in Africa
- 4.2.5 China's Coal-to-Gas Switching Policies for Industrial Boilers Driving Spot LNG Imports
- 4.2.6 Growing Demand from Energy-Intensive Data Centres for Firm Low-Carbon Supply in OECD Markets
- 4.3 Market Restraints
- 4.3.1 Prolonged FID Delays Owing to EPC-Cost Inflation & Module Fabrication Bottlenecks
- 4.3.2 Competitiveness of Renewable Hydrogen Eroding Long-Term LNG Contract Appetite in N.E. Asia
- 4.3.3 Regulatory Moratoria on New LNG Export Permits in U.S. & Canada
- 4.3.4 Geopolitical Risk at Key Chokepoints (Hormuz, Suez) Escalating LNG Shipping Insurance Costs
- 4.4 Supply-Chain Analysis
- 4.5 Regulatory Outlook
- 4.6 Technological Outlook
- 4.7 Porter's Five Forces
- 4.7.1 Bargaining Power of Suppliers
- 4.7.2 Bargaining Power of Buyers
- 4.7.3 Threat of New Entrants
- 4.7.4 Threat of Substitutes
- 4.7.5 Competitive Rivalry
5 Market Size & Growth Forecasts
- 5.1 By Infrastructure Type
- 5.1.1 LNG Liquefaction Plants [Onshore Liquefaction, Floating LNG (FLNG), Mid-Scale (1-5 mtpa), and Small-Scale (<1 mtpa)]
- 5.1.2 LNG Regasification Facilities [Onshore Import Terminals, and Floating Storage & Regasification Units (FSRU)]
- 5.1.3 LNG Shipping Fleet [LNG Carriers by Containment (Moss and Membrane), Carrier Size (Q-Max, Q-Flex and Standard), LNG Bunkering Vessels]
- 5.2 By End-Use Application
- 5.2.1 Power Generation
- 5.2.2 Industrial and Manufacturing
- 5.2.3 Residential and Commercial
- 5.2.4 Transportation (Marine Bunkering, Heavy-Duty Road Transport and Rail)
- 5.3 By Scale
- 5.3.1 Large-Scale (Above 5 mtpa)
- 5.3.2 Mid-Scale (1 to 5 mtpa)
- 5.3.3 Small-Scale (Below 1 mtpa)
- 5.4 By Location
- 5.4.1 Onshore
- 5.4.2 Offshore (FLNG and FSRU)
- 5.5 By Geography
- 5.5.1 North America
- 5.5.1.1 United States
- 5.5.1.2 Canada
- 5.5.1.3 Mexico
- 5.5.2 Europe
- 5.5.2.1 United Kingdom
- 5.5.2.2 Germany
- 5.5.2.3 France
- 5.5.2.4 Spain
- 5.5.2.5 Nordic Countries
- 5.5.2.6 Russia
- 5.5.2.7 Rest of Europe
- 5.5.3 Asia-Pacific
- 5.5.3.1 China
- 5.5.3.2 India
- 5.5.3.3 Japan
- 5.5.3.4 South Korea
- 5.5.3.5 ASEAN Countries
- 5.5.3.6 Australia
- 5.5.3.7 Rest of Asia-Pacific
- 5.5.4 South America
- 5.5.4.1 Brazil
- 5.5.4.2 Argentina
- 5.5.4.3 Colombia
- 5.5.4.4 Rest of South America
- 5.5.5 Middle East and Africa
- 5.5.5.1 United Arab Emirates
- 5.5.5.2 Saudi Arabia
- 5.5.5.3 Qatar
- 5.5.5.4 South Africa
- 5.5.5.5 Egypt
- 5.5.5.6 Rest of Middle East and Africa
- 5.5.1 North America
6 Competitive Landscape
- 6.1 Market Concentration
- 6.2 Strategic Moves (M&A, Partnerships, PPAs)
- 6.3 Market Share Analysis (Market Rank/Share for key companies)
- 6.4 Company Profiles (includes Global level Overview, Market level overview, Core Segments, Financials as available, Strategic Information, Products & Services, and Recent Developments)
- 6.4.1 QatarEnergy LNG (Qatargas)
- 6.4.2 Shell plc
- 6.4.3 Cheniere Energy Inc.
- 6.4.4 TotalEnergies SE
- 6.4.5 Petronas
- 6.4.6 Novatek
- 6.4.7 Chevron Corporation
- 6.4.8 Exxon Mobil Corporation
- 6.4.9 Woodside Energy Group
- 6.4.10 Equinor ASA
- 6.4.11 Sempra Infrastructure
- 6.4.12 Venture Global LNG
- 6.4.13 ENI SpA
- 6.4.14 KOGAS
- 6.4.15 Mitsui O.S.K. Lines
- 6.4.16 Golar LNG
- 6.4.17 BW LNG
- 6.4.18 Technip Energies
- 6.4.19 Bechtel Corporation
- 6.4.20 Fluor Corporation
- 6.4.21 KBR Inc.
7 Market Opportunities & Future Outlook
- 7.1 White-Space & Unmet-Need Assessment

 2026-2030年全球液化天然氣市場(作為燃料)
 液化天然氣 (LNG) 市場:2026-2032 年全球市場預測(按基礎設施、液化技術、產能、應用和分銷管道分類)
 2026年全球液化天然氣(LNG)蒸發撬裝設備市場報告
 液化天然氣(LNG)市場規模、佔有率和趨勢分析報告:按應用、地區和細分市場預測(2026-2033 年)
 2026-2030年全球液化天然氣(LNG)市場
 液化天然氣市場預測:按技術、終端用戶產業和地區分類(2026-2034 年)
 液化天然氣市場:按應用和地區分類生物液化天然氣市場:2026-2032年全球市場預測(依來源、技術、通路、應用及最終用戶產業分類)2026年全球液化天然氣(LNG)基礎設施市場報告按類型、流量、壓力範圍、材料和最終用戶分類的撬裝式氣體減壓裝置市場,全球預測,2026-2032年