


 |
市場調查報告書
商品編碼
2073470
輻射偵測設備:市場佔有率分析、產業趨勢與統計、成長預測(2026-2031)Radiography Test Equipment - Market Share Analysis, Industry Trends & Statistics, Growth Forecasts (2026 - 2031) |
||||||

※ 本網頁內容可能與最新版本有所差異。詳細情況請與我們聯繫。
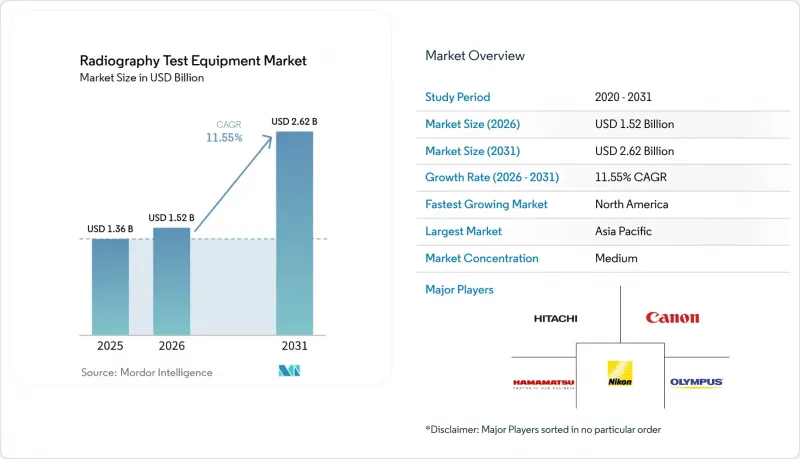
據 Mordor Intelligence 稱,輻射探測設備的市場規模預計在 2026 年達到 15.2 億美元,高於 2025 年的 13.6 億美元,預計到 2031 年將達到 26.2 億美元。
預計從 2026 年到 2031 年,其複合年成長率將達到 11.55%。
本報告按技術(膠片射線照相、電腦射線照相及其他)、組件(硬體/設備、軟體、服務)、應用(焊接檢測、腐蝕/侵蝕監測及其他)、終端用戶產業(航太與國防、能源與發電及其他)和地區進行細分。市場預測以美元計價。
全球放射檢測設備市場趨勢及洞察。
可攜式數位RT系統的廣泛應用
可攜式數位放射線正在徹底改變現場檢測的成本效益,它能夠即時提供高對比度影像,即使是現場最細微的裂紋也能清晰顯示,從而取代耗時數小時的膠片沖洗過程。先進的平板檢測器結合了無線連接和堅固的機殼,使管道工人和海上技術人員能夠在幾分鐘內檢查焊接完整性,並將加密結果上傳到雲端伺服器進行集中審核。無需暗房也避免了有害化學品的處理,從而降低了整體合規成本,並滿足淨零排放要求。對於頻繁使用的用戶而言,投資回收期已縮短至不到 24 個月,這使得工期緊張的承包商能夠輕鬆升級到可攜式系統。隨著組件成本的下降和檢測器靈敏度的提高,該技術的應用範圍正從最初的北美和歐洲用戶擴展到拉丁美洲和東南亞的能源走廊地區,這些地區的物流障礙最為嚴重。
航太領域複合材料偵測量激增
私人火箭發射器和民航機原始設備製造商 (OEM) 正在將碳纖維部件(關鍵承重部件)的電腦斷層掃描 (CT) 標準化,每架飛機的總掃描時間已達到創紀錄的水平。為了適應多層結構、壁厚變化以及金屬網狀防雷裝置,需要能夠識別亞毫米級空隙的3D資料集。配備 450 kV X光源的可攜式CT 機架現在可直接運送到組裝現場,從而避免了在排班緊張的固定設施中出現延誤。因此,初始產品偵測能力的提高使 OEM 能夠自信地擴展新型材料系統,在不犧牲安全裕度的前提下,將結構重量減輕 20%。亞太地區快速發展的複合材料供應鏈也迅速採用這些標準,以確保獲得一級機身和引擎短艙的合約。
擁有成本高昂,尤其是CT掃描儀。
高能工業CT掃描儀的售價通常超過50萬美元,加上屏蔽、校準和技術純熟勞工的人事費用,十年內支出可能翻倍。東南亞和非洲的小規模檢測實驗室往往更傾向於選擇合約檢測實驗室和行動服務供應商,這減緩了直接購買的成長。租賃模式和按掃描收費平台在一定程度上彌補了成本效益方面的差距,但規模仍然不夠大。提供硬體和訂閱式人工智慧分析服務的供應商正在改變現金流結構,但融資方仍指出客製化CT機櫃的殘值存在不確定性。因此,許多中型用戶正在推遲升級,直到折舊免稅額週期能夠帶來必要的資金。
細分市場分析
至2025年,直接射線照相(DR)將佔射線照相檢測設備市場45.10%的佔有率,凸顯其在常規焊接檢驗和腐蝕測繪中的穩固地位。同時,電腦斷層掃描(CT)正以12.18%的複合年成長率快速成長,在需要完整體積資料集而非2D投影的專案中日益普及。因此,射線照相檢測設備市場正呈現兩極化的發展趨勢:經濟高效的DR可滿足基本的合規性要求,而CT則可在航太、積層製造和複雜鑄件等領域實現高價值的檢測。從底片到數位技術的轉變仍然至關重要,目前底片設備的銷售量佔不到15%,且其應用主要局限於一些老舊的國防相關設施。
可攜式CT技術的進步正在克服傳統固定式鉛襯外殼帶來的種種限制。整合了450 kV X光源、碳纖維支撐框架和減震轉台的系統,已在發射場和管道廠區等場所的ISO集裝箱內運作。隨著解析度達到小於50微米的體素網格,CT也開始承擔測量任務,例如根據CAD模型檢驗積層製造的鈦合金零件。這些功能使原始設備製造商(OEM)能夠在24小時內完成初始產品檢測,從而減少成本高昂的迭代週期。因此,預計到2031年,CT將佔據X光檢測設備市場20%以上的佔有率,其中很大一部分成長預計將來自對過時膠片式系統的淘汰。
硬體收入占我們2025年總收入的48.40%,這反映了X光源、機械臂和檢測器等檢測單元的關鍵組件的資本密集型特性。然而,軟體收入的成長速度更快,複合年成長率達到12.05%,這得益於我們的人工智慧引擎能夠將原始影像堆疊轉化為定量缺陷評估,從而減少高達60%的解讀工作量。從年度校準到按需評估CT資料集等服務契約,均保持著穩定的個位數中段成長,尤其對於那些沒有內部負責人的製造商而言更是如此。
輻射檢測設備產業正朝著一體化生態系統發展,檢測器、控制電子設備和分析功能共用通用一個韌體層。供應商將基於訂閱的演算法捆綁在一起,這些演算法可以對氣孔、焊接缺陷、壁厚偏差等進行分類,使品管管理人員能夠即時查看儀錶板上的結果。這種緊密整合提高了切換成本,同時也提升了設備的生命週期價值。預計在預測期內,軟體將佔新增成長的近三分之一,凸顯了其在未來採購週期中的策略重要性。
區域分析
北美擁有全球最密集的管道網路和全球複合材料飛機生產能力的主導地位,預計到2025年將佔全球銷售額的38.50%。受美國聯邦航空管理局(FAA)強制要求的複合材料飛機檢查和老舊核能設施延壽計畫的推動,該地區的輻射偵測設備市場正在穩步擴張,預計到2031年將達到11.2億美元。加拿大油砂開發的擴張以及墨西哥改革推動的中游領域投資,也進一步刺激了市場需求。
亞太地區是成長最快的市場,年複合成長率達12.30%,這主要得益於中國數兆美元的基礎建設項目以及印度對火力發電廠現代化改造需求的激增。天津、班加羅爾和名古屋的航太產業叢集正在安裝CT機房,以期在全球飛機計畫中達到一級供應商(Tier 1)標準。韓國和新加坡政府透過與工業4.0現代化相關的稅額扣抵提供的獎勵,進一步推動了CT技術的應用。
在歐洲,成長要素呈現均衡的態勢。可再生能源(尤其是離岸風力發電)的擴張,使得大型零件的輻射偵測成為必要;同時,100多座核子反應爐的長期運作也確保了基本負載需求。歐洲核能共同體(Euratom)嚴格的輻射標準迫使使用者轉向數位化輻射計量降低技術,從而催生了對技術升級而非單純產量成長的需求。在中東和非洲,與油氣相關的大型企劃正在蓬勃發展,但由於連續油氣檢測設備(CT)的資本密集特性,其普及率仍然滯後。在巴西深海開發案的推動下,南美洲正經歷顯著成長,但其收入來源仍較為小眾。
其他好處
- Excel格式的市場預測(ME)表
- 3個月的分析師支持
目錄
第1章:引言
- 研究假設和市場定義
- 調查範圍
第2章:調查方法
第3章執行摘要
第4章 市場狀況
- 市場概覽
- 市場促進因素
- 攜帶式數位RT系統的廣泛應用
- 航太複合材料檢測數量激增。
- 關於石油和天然氣管道焊接完整性的監管要求
- 在世界能源基礎設施老化的背景下,需要進行無損檢測(NDT)來延長其使用壽命。
- 與RT硬體捆綁的AI驅動缺陷偵測軟體
- SpaceX 等私人發射項目正在為火箭技術創造新的應用場景。
- 市場限制因素
- 擁有成本高昂,尤其是CT掃描儀。
- 降低輻射暴露風險與安全裕度
- 三級認證呼吸治療師短缺
- 網路化即時系統中的網路安全漏洞
- 產業價值鏈分析
- 宏觀經濟趨勢對市場的影響
- 監理情勢
- 技術展望
- 波特五力分析
第5章 市場規模與成長預測
- 透過技術
- 底片放射檢查
- 電腦放射檢查
- 直接放射成像
- 電腦斷層掃描
- 按組件
- 硬體/設備
- 軟體
- 服務
- 透過使用
- 焊接檢驗
- 腐蝕和侵蝕監測
- 鑄造和鍛造檢驗
- 複合材料的檢測
- 其他
- 按最終用戶行業分類
- 航太/國防
- 能源和發電
- 石油和天然氣
- 車
- 建設基礎設施
- 製造業和重工業
- 其他
- 按地區
- 北美洲
- 美國
- 加拿大
- 墨西哥
- 南美洲
- 巴西
- 阿根廷
- 智利
- 其他南美國家
- 歐洲
- 德國
- 英國
- 法國
- 義大利
- 荷蘭
- 其他歐洲國家
- 亞太地區
- 中國
- 印度
- 日本
- 韓國
- 其他亞太國家
- 中東和非洲
- 中東
- 沙烏地阿拉伯
- 阿拉伯聯合大公國
- 土耳其
- 其他中東國家
- 非洲
- 南非
- 奈及利亞
- 其他非洲地區
- 中東
- 北美洲
第6章 競爭情勢
- 市場集中度
- 策略趨勢
- 市佔率分析
- 供應商排名分析
- 公司簡介
- Baker Hughes Co.(Waygate Technologies)
- GE Vernova-Measurement and Control
- Canon Inc.
- Nikon Metrology Inc.
- Comet AG(Yxlon International)
- Teledyne DALSA Inc.
- Hitachi Ltd.
- Fujifilm Holdings Corp.
- Hamamatsu Photonics KK
- Shimadzu Corp.
- Carestream NDT(Carestream Health)
- Rigaku Corp.
- North Star Imaging Inc.
- Vidisco Ltd.
- DURR NDT GmbH and Co. KG
- Sonatest Ltd.
- Varex Imaging Corp.
- Bosello High Technology srl
- DIONDO GmbH
- Pexraytech Oy
- Industrial Control X-Ray(ICXR)Inc.
- Mistras Group Inc.
- Olympus Corporation
- Tuboscope NDT Services(NOV Inc.)
- Zetec Inc.
第7章 市場機會與未來展望
According to Mordor Intelligence, radiography test equipment market size in 2026 is estimated at USD 1.52 billion, growing from 2025 value of USD 1.36 billion with 2031 projections showing USD 2.62 billion, growing at 11.55% CAGR over 2026-2031.
This report is Segmented by Technology (Film Radiography, Computed Radiography, and More), Component (Hardware/Equipment, Software, and Services), Application (Weld Inspection, Corrosion and Erosion Monitoring, and More), End-User Industry (Aerospace and Defense, Energy and Power, and More), and Geography. The Market Forecasts are Provided in Terms of Value (USD).
Global Radiography Test Equipment Market Trends and Insights
Growing Adoption of Portable Digital RT Systems
Portable digital radiography is overturning field inspection economics by replacing hours-long film processing with immediate, high-contrast images that expose micro-cracks on site. Advanced flat-panel detectors now pair wireless connectivity with ruggedized housings, letting pipeline crews or offshore technicians validate weld integrity in minutes and upload encrypted results to a cloud server for centralized review. Eliminating darkrooms also removes hazardous chemical disposal, lowering total compliance cost and aligning with net-zero mandates. Capital payback periods are shortening to fewer than 24 months for high-duty users, making portable systems an easy upgrade for contractors chasing tight project schedules. As component prices fall and detector sensitivity rises, adoption spreads from early North American and European users to Latin American and Southeast Asian energy corridors where logistical hurdles are greatest.
Surge in Aerospace Composite-Materials Inspection Volumes
Private launch providers and commercial aircraft OEMs have standardized computed-tomography scanning for primary load-bearing carbon-fiber parts, raising total scan hours per airframe to record levels. Multi-layer lay-ups, variable wall thicknesses, and metal-mesh lightning strike protections demand 3-D datasets capable of isolating sub-millimeter voids. Portable CT gantries equipped with 450 kV sources now move directly to assembly bays, sidestepping schedule bottlenecks at overbooked fixed installations. The resulting acceleration in first-article inspection throughput gives OEMs confidence to scale novel material systems that cut 20% structural weight without sacrificing safety margins. Asia-Pacific's burgeoning composite supply chain is quickly adopting these same standards to win Tier-1 fuselage and engine nacelle contracts.
High Ownership Cost, Particularly for CT Scanners
High-energy industrial CT units routinely top USD 500,000, and shielding, calibration, and skilled labor can double that outlay over ten years. Smaller inspection houses in Southeast Asia and Africa prefer contract labs or mobile service providers, slowing the direct-purchase curve. Leasing models and pay-per-scan platforms are partially bridging the affordability gap but not yet at scale. Vendors that bundle hardware with subscription-based AI analytics are shifting cash-flow profiles, but financiers still perceive residual-value uncertainty for bespoke CT cabinets. Consequently, many mid-tier users postpone upgrades until depreciation cycles free capital.
Other drivers and restraints analyzed in the detailed report include:
- Regulatory Mandates for Weld Integrity Across Oil and Gas Pipelines
- Aging Global Energy Infrastructure Demanding Life-Extension NDT
- Radiation Exposure Risk and Tightening Safety Clearances
For complete list of drivers and restraints, kindly check the Table Of Contents.
Segment Analysis
Direct Radiography accounted for 45.10% of the radiography test equipment market size in 2025, underscoring its entrenched role in routine weld verification and corrosion mapping. Computed Tomography, however, is accelerating at 12.18% CAGR, capturing projects that require complete volumetric datasets rather than 2-D projections. The radiography test equipment market is therefore experiencing a dual-track evolution where cost-efficient DR fulfills baseline compliance while CT unlocks high-value inspections for aerospace, additive manufacturing, and complex castings. Migration from film to digital remains pivotal; film units now represent less than 15% of new sales and are largely confined to legacy defense depots.
Portable CT innovations are dissolving historical barriers tied to fixed, lead-lined enclosures. Units integrating 450 kV sources, carbon-fiber support frames, and vibration-isolated turntables are operating from ISO containers at launch sites and pipeline rights-of-way. As resolution climbs to sub-50 micron voxel grids, CT also assumes metrology duties, validating additively manufactured titanium parts against CAD models. These capabilities help OEMs close first-article inspection loops within 24 hours, reducing costly iteration cycles. Consequently, CT's share of the radiography test equipment market is expected to break the 20% threshold before 2031, with most gains drawn from retiring film installations.
Hardware captured 48.40% of 2025 revenues, reflecting the capital intensity of X-ray sources, manipulators, and detectors essential for any inspection cell. Yet software revenues are advancing faster at 12.05% CAGR as AI engines transform raw image stacks into quantified flaw assessments, cutting interpretive labor up to 60%. Service contracts, ranging from annual calibration to on-demand evaluation of CT datasets, sustain a stable mid-single-digit growth, especially among manufacturers lacking in-house analysts.
The radiography test equipment industry is converging around integrated ecosystems where detectors, control electronics, and analytics share a common firmware layer. Vendors bundle subscription-based algorithms that classify porosity, lack of fusion, or wall-thickness deviations, delivering dashboard-ready outputs to quality managers in real time. This tight coupling increases switching costs and elevates lifetime value. Over the forecast period, software is expected to account for nearly one-third of incremental dollar growth, underlining its strategic weight in future procurement cycles.
Complete Report Scope:
- By Technology
- Film Radiography
- Computed Radiography
- Direct Radiography
- Computed Tomography
- By Component
- Hardware/Equipment
- Software
- Services
- By Application
- Weld Inspection
- Corrosion and Erosion Monitoring
- Casting and Forging Inspection
- Composite Material Inspection
- Other Applications
- By End-user Industry
- Aerospace and Defense
- Energy and Power
- Oil and Gas
- Automotive
- Construction and Infrastructure
- Manufacturing and Heavy Engineering
- Other End-User Industries
- By Geography
- North America
- United States
- Canada
- Mexico
- South America
- Brazil
- Argentina
- Chile
- Rest of South America
- Europe
- Germany
- United Kingdom
- France
- Italy
- Netherlands
- Rest of Europe
- Asia-Pacific
- China
- India
- Japan
- South Korea
- Rest of Asia-Pacific
- Middle East and Africa
- Middle East
- Saudi Arabia
- United Arab Emirates
- Turkey
- Rest of Middle East
- Africa
- South Africa
- Nigeria
- Rest of Africa
- Middle East
- North America
Geography Analysis
North America held 38.50% of 2025 revenues, anchored by the world's densest pipeline network and a dominant share of global composite aircraft production capacity. The radiography test equipment market size in the region is expected to reach USD 1.12 billion by 2031, expanding steadily on the back of FAA-mandated composite airframe inspections and life-extension programs for aging nuclear assets. Canada's oil-sands expansions and Mexico's reform-driven midstream investments add incremental pull.
Asia-Pacific is the fastest-growing theater, charting a 12.30% CAGR amid China's multi-trillion-dollar infrastructure pipeline and India's surge in thermal-plant upgrades. Local aerospace clusters in Tianjin, Bengaluru, and Nagoya are installing CT bays to win Tier-1 positions on global airframe programs. Government incentives in South Korea and Singapore further drive adoption through tax credits linked to Industry 4.0 modernization.
Europe exhibits balanced drivers: renewable-energy rollouts, particularly offshore wind, necessitate large-component RT, while extending the operational life of 100-plus nuclear reactors secures base-load demand. Stringent Euratom radiation standards push users toward digital dose-reduction technologies, creating technology-upgrade pull rather than pure volume growth. Middle East and Africa leverage hydrocarbon megaprojects, though adoption rates trail due to CT's capital intensity. South America, led by Brazil's deepwater initiatives, is a rising but still niche revenue pool.
- Baker Hughes Co. (Waygate Technologies)
- GE Vernova - Measurement and Control
- Canon Inc.
- Nikon Metrology Inc.
- Comet AG (Yxlon International)
- Teledyne DALSA Inc.
- Hitachi Ltd.
- Fujifilm Holdings Corp.
- Hamamatsu Photonics K.K.
- Shimadzu Corp.
- Carestream NDT (Carestream Health)
- Rigaku Corp.
- North Star Imaging Inc.
- Vidisco Ltd.
- DURR NDT GmbH and Co. KG
- Sonatest Ltd.
- Varex Imaging Corp.
- Bosello High Technology srl
- DIONDO GmbH
- Pexraytech Oy
- Industrial Control X-Ray (ICXR) Inc.
- Mistras Group Inc.
- Olympus Corporation
- Tuboscope NDT Services (NOV Inc.)
- Zetec Inc.
Additional Benefits:
- The market estimate (ME) sheet in Excel format
- 3 months of analyst support
TABLE OF CONTENTS
1 INTRODUCTION
- 1.1 Study Assumptions and Market Definition
- 1.2 Scope of the Study
2 RESEARCH METHODOLOGY
3 EXECUTIVE SUMMARY
4 MARKET LANDSCAPE
- 4.1 Market Overview
- 4.2 Market Drivers
- 4.2.1 Growing adoption of portable digital RT systems
- 4.2.2 Surge in aerospace composite-materials inspection volumes
- 4.2.3 Regulatory mandates for weld integrity across oil and gas pipelines
- 4.2.4 Aging global energy infrastructure demanding life-extension NDT
- 4.2.5 AI-driven defect-recognition software bundled with RT hardware
- 4.2.6 SpaceX-type private launch programs spawning new RT use cases
- 4.3 Market Restraints
- 4.3.1 High ownership cost, particularly for CT scanners
- 4.3.2 Radiation exposure risk and tightening safety clearances
- 4.3.3 Deficit of certified Level-III RT personnel
- 4.3.4 Cyber-security vulnerabilities in networked RT systems
- 4.4 Industry Value Chain Analysis
- 4.5 Impact of Macro Trends on the Market
- 4.6 Regulatory Landscape
- 4.7 Technological Outlook
- 4.8 Porter's Five Forces Analysis
- 4.8.1 Bargaining Power of Suppliers
- 4.8.2 Bargaining Power of Buyers
- 4.8.3 Threat of New Entrants
- 4.8.4 Threat of Substitutes
- 4.8.5 Intensity of Competitive Rivalry
5 MARKET SIZE AND GROWTH FORECASTS (VALUE)
- 5.1 By Technology
- 5.1.1 Film Radiography
- 5.1.2 Computed Radiography
- 5.1.3 Direct Radiography
- 5.1.4 Computed Tomography
- 5.2 By Component
- 5.2.1 Hardware/Equipment
- 5.2.2 Software
- 5.2.3 Services
- 5.3 By Application
- 5.3.1 Weld Inspection
- 5.3.2 Corrosion and Erosion Monitoring
- 5.3.3 Casting and Forging Inspection
- 5.3.4 Composite Material Inspection
- 5.3.5 Other Applications
- 5.4 By End-user Industry
- 5.4.1 Aerospace and Defense
- 5.4.2 Energy and Power
- 5.4.3 Oil and Gas
- 5.4.4 Automotive
- 5.4.5 Construction and Infrastructure
- 5.4.6 Manufacturing and Heavy Engineering
- 5.4.7 Other End-User Industries
- 5.5 By Geography
- 5.5.1 North America
- 5.5.1.1 United States
- 5.5.1.2 Canada
- 5.5.1.3 Mexico
- 5.5.2 South America
- 5.5.2.1 Brazil
- 5.5.2.2 Argentina
- 5.5.2.3 Chile
- 5.5.2.4 Rest of South America
- 5.5.3 Europe
- 5.5.3.1 Germany
- 5.5.3.2 United Kingdom
- 5.5.3.3 France
- 5.5.3.4 Italy
- 5.5.3.5 Netherlands
- 5.5.3.6 Rest of Europe
- 5.5.4 Asia-Pacific
- 5.5.4.1 China
- 5.5.4.2 India
- 5.5.4.3 Japan
- 5.5.4.4 South Korea
- 5.5.4.5 Rest of Asia-Pacific
- 5.5.5 Middle East and Africa
- 5.5.5.1 Middle East
- 5.5.5.1.1 Saudi Arabia
- 5.5.5.1.2 United Arab Emirates
- 5.5.5.1.3 Turkey
- 5.5.5.1.4 Rest of Middle East
- 5.5.5.2 Africa
- 5.5.5.2.1 South Africa
- 5.5.5.2.2 Nigeria
- 5.5.5.2.3 Rest of Africa
- 5.5.5.1 Middle East
- 5.5.1 North America
6 COMPETITIVE LANDSCAPE
- 6.1 Market Concentration
- 6.2 Strategic Moves
- 6.3 Market Share Analysis
- 6.4 Vendor Ranking Analysis
- 6.5 Company Profiles (includes Global level Overview, Market level overview, Core Segments, Financials as available, Strategic Information, Market Rank/Share for key companies, Products and Services, and Recent Developments)
- 6.5.1 Baker Hughes Co. (Waygate Technologies)
- 6.5.2 GE Vernova - Measurement and Control
- 6.5.3 Canon Inc.
- 6.5.4 Nikon Metrology Inc.
- 6.5.5 Comet AG (Yxlon International)
- 6.5.6 Teledyne DALSA Inc.
- 6.5.7 Hitachi Ltd.
- 6.5.8 Fujifilm Holdings Corp.
- 6.5.9 Hamamatsu Photonics K.K.
- 6.5.10 Shimadzu Corp.
- 6.5.11 Carestream NDT (Carestream Health)
- 6.5.12 Rigaku Corp.
- 6.5.13 North Star Imaging Inc.
- 6.5.14 Vidisco Ltd.
- 6.5.15 DURR NDT GmbH and Co. KG
- 6.5.16 Sonatest Ltd.
- 6.5.17 Varex Imaging Corp.
- 6.5.18 Bosello High Technology srl
- 6.5.19 DIONDO GmbH
- 6.5.20 Pexraytech Oy
- 6.5.21 Industrial Control X-Ray (ICXR) Inc.
- 6.5.22 Mistras Group Inc.
- 6.5.23 Olympus Corporation
- 6.5.24 Tuboscope NDT Services (NOV Inc.)
- 6.5.25 Zetec Inc.
7 MARKET OPPORTUNITIES AND FUTURE OUTLOOK
- 7.1 White-space and Unmet-need Assessment

 X光檢測系統市場:全球市場預測,2026-2032年射線照相檢測設備市場-全球市場預測(2026-2032年)
 全球X光檢測設備市場:市場規模、佔有率、趨勢和成長分析(2026-2034年)全球X光檢測系統市場(2025-2030年)
 X光檢測設備市場:市場規模、佔有率和趨勢分析(按技術、尺寸、最終用途和地區分類),細分市場預測(2026-2033年)全球X光檢測系統市場規模、佔有率、趨勢和成長分析報告(2026-2034年)X光檢測系統市場規模、佔有率、成長率及全球產業分析:按類型、應用和地區分類,並提供2026-2034年的洞察和預測
 放射影像設備市場分析及預測(至2035年):依類型、產品類型、服務、技術、應用、最終用戶、組件、製程及設備分類
 2026年全球X光檢測設備市場報告2026年全球X光食品檢測設備市場報告