


 |
市場調查報告書
商品編碼
2073466
燃料電池:市場佔有率分析、行業趨勢和統計數據、成長預測(2026-2031)Fuel Cell - Market Share Analysis, Industry Trends & Statistics, Growth Forecasts (2026 - 2031) |
||||||

※ 本網頁內容可能與最新版本有所差異。詳細情況請與我們聯繫。
據 Mordor Intelligence 稱,燃料電池市場在 2025 年的價值為 81.9 億美元,預計到 2031 年將達到 506.4 億美元,而 2026 年為 104.2 億美元,預測期(2026-2031 年)的複合年成長率為 37.19%。
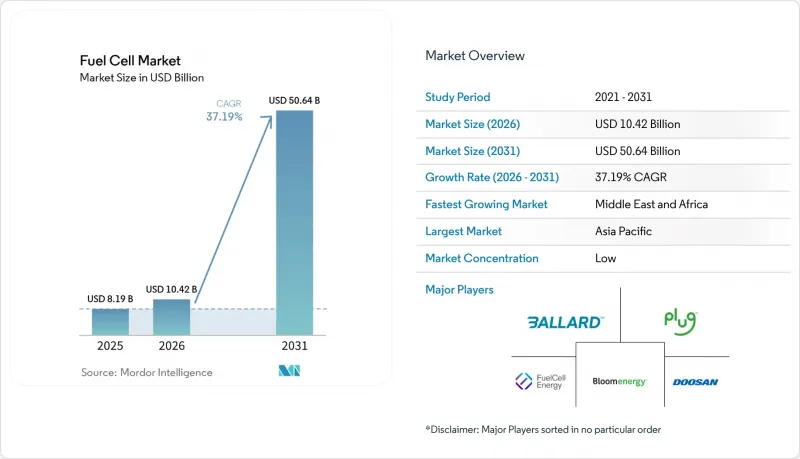
本報告按技術(聚合物電解質膜燃料電池、固體氧化物燃料電池、鹼性燃料電池、其他)、燃料類型(氫氣、天然氣、氨氣、其他)、應用(汽車和非汽車)、最終用戶行業(交通運輸、公共產業、商業和工業、其他)以及地區(北美、歐洲、亞太地區、南美、中東和非洲)進行分類。
全球燃料電池市場趨勢及洞察
降低綠氫和藍氫的生產成本
預計到2025年,電解槽的資本支出將降至每千瓦2100美元,到2030年將降至每千瓦1494美元,這將使太陽能資源豐富的地區氫氣的平準化價格低於每公斤2美元。這一趨勢將縮小氫氣與柴油和天然氣的價格差距,為堆高機、通訊塔和分散式發電等領域創造新的機會。藍氫的價格在每公斤1.50美元至2.50美元之間,在低成本天然氣供應充足的地區仍將獲利能力,可作為可再生能源供應擴大前的過渡能源。政府支持的項目,例如沙烏地阿拉伯日產能600噸的NEOM綜合體,降低了早期超大規模設施的風險,並建立了出口基準。此外,可再生能源發電量的削減(加州在2024年削減了2.4太瓦時)將導致電力價格為負值,從而進一步降低氫氣的成本。這些趨勢結合起來,將增強燃料電池市場在行動和固定應用領域的經濟可行性。
亞太地區汽車製造商在燃料電池汽車領域的努力
豐田的目標是到2030年實現年產7.5萬輛燃料電池汽車,而現代汽車則投資9,300億韓元建造一座工廠,目標是到2027年實現年產3萬輛。儘管零售市場短期低迷(預計2025年上半年韓國燃料電池電動車銷量將下降27.2%),但這些措施顯示了企業對燃料電池汽車市場的長期信心。豐田的第三代燃料電池堆壽命加倍,達到1萬小時,鉑金用量減少了30%,從而降低了重型卡車的總擁有成本。在中國,地方政府對每輛車最高30萬元人民幣的獎勵在一定程度上抵消了國家補貼逐步取消的影響,從而維持了自有公車和物流車輛的普及。總體而言,充足的產能支撐著供應鏈的投資,並推動了燃料電池市場的擴張。
日本和韓國以外地區缺乏氫氣加註基礎設施
日本擁有160座運作站,韓國擁有200座,而美國僅有60座(主要集中在加州),歐洲則有250座(其中40%位於德國)。這種基礎設施分佈不均限制了乘用車的使用,使其僅限於車隊和示範區,阻礙了加氫技術的更廣泛應用。中國擁有500座加氫站,但這些加氫站主要集中在沿海地區,內陸省份的服務嚴重不足。每座加氫站200萬至400萬美元的建設成本,加上高昂的氫氣供應價格,使得私人投資者持謹慎態度。 2024年,加州因供不應求而暫時關閉了15座加氫站,不僅打擊了消費者的信心,也凸顯了加氫技術在早期部署階段的脆弱性。
細分市場分析
由於在汽車領域的領先地位,聚合物電解質膜(PEM)技術預計在2025年將佔70.1%的銷售額。然而,隨著電力公司優先考慮60%的電力效率和燃料柔軟性,固體氧化物(SOX)技術預計到2031年將實現48.1%的複合年成長率,是PEM技術的兩倍。 Bloom Energy的平台目前以天然氣為運作,但能夠過渡到100%氫能,從而降低基礎設施建設的門檻。鹼性燃料電池系統佔4.2%的市場佔有率,但其應用僅限於航太和潛艦計畫。磷酸鹽燃料電池、熔融碳酸鹽燃料電池和直接甲醇燃料電池佔據剩餘的市場佔有率,但它們面臨來自燃氣引擎和鋰離子電池的競爭。諸如Ceres Power的鋼製電池結構等創新技術,可將製造成本降低40%,進而拓展燃料電池市場的技術選擇。
預計到2025年,氫氣將滿足65.3%的需求,這得益於現有的生產基礎設施和廣泛的電堆相容性。天然氣製氫佔部署量的26.9%,其中大部分用於北美地區的固定式固體氧化物燃料電池(SOFC)陣列,由於管道供應充足,該地區的供應成本較低。氨的基準為8%,但隨著航運公司轉向零碳燃料,預計其年複合成長率將達到51.8%。日本郵船(NYK)和三星重工計畫在2028年前投入使用氨燃料SOFC船舶,並利用全球氨貿易網。甲醇和沼氣目前佔據一定的市場佔有率,但兩者都需要克服效率和雜質的挑戰,才能在更廣泛的燃料電池市場中實現規模化發展。
區域分析
預計到2025年,亞太地區將佔全球氫燃料電池銷售額的57.5%,並在2031年之前以36.8%的複合年成長率持續成長。在日本,160座加氫站和40萬戶住宅正在推動氫燃料電池的普及;而在韓國,一項5,000億韓元的氫能藍圖正在扶持國內供應商。在中國,儘管零售市場成長緩慢,但500座加氫站的網路和省級補貼正在推動公車和物流車輛的氫燃料電池應用。印度和東南亞在基礎設施方面相對落後,但澳洲憑藉其豐富的可再生能源資源,正在崛起成為未來的出口中心。各汽車製造商(OEM)採取的策略各不相同,例如豐田正在擴張業務而本田則在縮減規模,這凸顯了市場信心的不平衡,但總體而言,這鞏固了亞太地區在燃料電池市場的領先地位。
預計到2025年,北美將佔全球氫氣銷售額的22.3%,年複合成長率(CAGR)為34.2%。加州正在建造約60座加氫站,並提供24萬美元的購車補貼,同時聯邦政府也提供每公斤氫氣3美元的稅額扣抵。 Plug Power的堆高機生態系統在物料運輸領域佔據主導地位,而Nicola則專注於長途貨運。在加拿大,40%的投資稅額扣抵鼓勵利用水力資源生產綠色氫氣,但除溫哥華和多倫多以外,加氫站網路仍然稀少。墨西哥的初期工作重點是跨境卡車走廊。這些措施的永續性以及電解槽成本的下降預計將決定該地區的未來發展。
到2025年,歐洲的市佔率將達到15.8%。德國的主導地位得益於其100座加氫站以及IPCEI Hy2Tech項目的資金支持,而2024/1610號法規正在加速氫能在卡車上的應用。北歐國家正利用剩餘的可再生能源生產出口導向綠色氫能。阿爾斯通在下薩克森州和Lombardia大區的列車正在展示氫能在鐵路牽引領域的應用。英國和法國的部署密度落後於其他國家,這反映出兩國採取了不同的策略。中東和非洲目前佔4.4%的市場佔有率,但預計將以38.7%的複合年成長率實現最快成長,這主要得益於價值84億美元的NEOM項目和價值10億美元的Masdar-阿布扎比國家石油公司(ADNOC)聯合項目,這兩個項目都計劃在2026-2027年投入運作。南美洲仍處於起步階段,市佔率僅2.5%。智利和巴西正日益將自身定位為出口和供應國,而非國內消費國。
其他好處
- Excel格式的市場預測(ME)表
- 3個月的分析師支持
目錄
第1章:引言
- 研究假設和市場定義
- 調查範圍
第2章:調查方法
第3章執行摘要
第4章 市場狀況
- 市場概覽
- 近期趨勢與發展
- 市場促進因素
- 降低綠氫和藍氫的生產成本
- 亞太地區汽車製造商在燃料電池汽車領域的努力
- 政府針對重型運輸領域的零排放法規(北美和歐盟)
- 資料中心對長期備用電源的需求
- 航運業的脫碳目標正在加速燃料電池的普及應用。
- 企業對現場分散式發電的淨零投資
- 市場限制因素
- 除日本和韓國以外,其他地區缺乏氫氣加註基礎設施。
- 鉑族金屬和鎳價格的波動推高了堆疊成本。
- 高硫含量環境下固態氧化物燃料電池的性能劣化
- 美國建築規範中認證不足,延緩了固定式設備的採用。
- 供應鏈分析
- 監理展望
- 技術展望
- 波特的五力模型
- 供應商的議價能力
- 消費者議價能力
- 新進入者的威脅
- 替代產品和服務的威脅
- 競爭公司之間的競爭
第5章 市場規模與成長預測
- 透過技術
- 聚合物電解質膜燃料電池(PEMFC)
- 固體氧化物燃料電池(SOFC)
- 鹼性燃料電池(AFC)
- 其他類型的燃料電池:磷酸鹽燃料電池(PAFC)、熔融碳酸鹽燃料電池(MCFC)、直接甲醇燃料電池(DMFC)
- 按燃料類型
- 氫
- 天然氣/甲烷
- 氨
- 其他(甲醇、沼氣)
- 透過使用
- 汽車應用(乘用車、巴士/長途客車、卡車、物料搬運設備、鐵路、船舶)
- 非汽車應用(固定式電源、可攜式電源、微型汽電共生)
- 按最終用戶行業分類
- 運輸
- 公共產業
- 商業和工業
- 其他(國防、住宅)
- 按地區
- 北美洲
- 美國
- 加拿大
- 墨西哥
- 歐洲
- 英國
- 德國
- 法國
- 西班牙
- 北歐國家
- 俄羅斯
- 其他歐洲國家
- 亞太地區
- 中國
- 印度
- 日本
- 韓國
- 馬來西亞
- 泰國
- 印尼
- 越南
- 澳洲
- 其他亞太國家
- 南美洲
- 巴西
- 阿根廷
- 哥倫比亞
- 其他南美國家
- 中東和非洲
- 阿拉伯聯合大公國
- 沙烏地阿拉伯
- 南非
- 其他中東和非洲國家
- 北美洲
第6章 競爭情勢
- 市場集中度
- 策略趨勢(併購、聯盟、購電協議)
- 市場佔有率分析(主要公司的市場排名和佔有率)
- 公司簡介
- Ballard Power Systems Inc.
- Plug Power Inc.
- FuelCell Energy Inc.
- Bloom Energy Corporation
- Doosan Fuel Cell Co., Ltd.
- Cummins Inc.(Hydrogenics)
- Toshiba Energy Systems & Solutions Corp.
- Panasonic Corporation
- Horizon Fuel Cell Technologies Pte. Ltd.
- Intelligent Energy Ltd.
- Nuvera Fuel Cells, LLC
- SFC Energy AG
- Mitsubishi Power Ltd.
- Hyundai Mobis Co., Ltd.
- Toyota Motor Corporation
- Nikola Corporation
- Ceres Power Holdings plc
- Ballard Motive Solutions Ltd.
- PowerCell Sweden AB
- AFC Energy plc
- Advent Technologies Holdings Inc.
- Gencell Ltd.
- Proton Motor Power Systems plc
第7章 市場機會與未來展望
According to Mordor Intelligence, the fuel cell market size was valued at USD 8.19 billion in 2025 and is estimated to grow from USD 10.42 billion in 2026 to reach USD 50.64 billion by 2031, at a CAGR of 37.19% during the forecast period (2026-2031).
This report is Segmented by Technology (Polymer Electrolyte Membrane Fuel Cell, Solid Oxide Fuel Cell, Alkaline Fuel Cell, and Others), Fuel Type (Hydrogen, Natural Gas, Ammonia, and Others), Application (Vehicular and Non-Vehicular), End-User Industry (Transportation, Utilities, Commercial and Industrial, and Others), and Geography (North America, Europe, Asia-Pacific, South America, and Middle East and Africa).
Global Fuel Cell Market Trends and Insights
Falling Costs of Green & Blue Hydrogen Generation
Electrolyzer capital expenditure declined to USD 2,100 per kilowatt in 2025 and is projected to hit USD 1,494 by 2030, pushing levelized hydrogen prices below USD 2 per kilogram in solar-rich zones. This trajectory narrows the parity gap with diesel and natural gas, unlocking new opportunities for forklifts, telecom towers, and distributed generation. Blue hydrogen at USD 1.50-2.50 per kilogram remains viable where low-cost gas is available, offering a bridge until renewable supply scales. Sovereign-backed projects such as Saudi Arabia's 600-tons-per-day NEOM complex de-risk early giga-scale facilities and create export benchmarks. Complementary renewable curtailment (California shed 2.4 TWh in 2024) provides negative-priced electricity windows that further lower hydrogen costs. Together, these trends strengthen fuel cell market economics across mobility and stationary use cases.
Automaker Commitments to FCEVs in Asia-Pacific
Toyota targets 75,000 annual fuel cell units by 2030, and Hyundai is building a KRW 930 billion plant aiming for 30,000 units a year by 2027. These moves signal long-term confidence despite near-term retail softness; South Korean FCEV sales fell 27.2% in H1 2025. Third-generation Toyota stacks doubled durability to 10,000 hours and cut platinum loadings by 30%, trimming total cost of ownership for heavy trucks. Chinese provincial incentives of up to RMB 300,000 per vehicle partially offset the national subsidy phase-out, keeping captive bus and logistics fleets in play. Overall, committed production capacity anchors supply-chain investment and propels the fuel cell market toward scale.
Scarcity of Hydrogen Refueling Infrastructure Outside Japan & South Korea
Japan operates 160 stations and South Korea 200, while the United States fields just 60, nearly all in California, and Europe tallies 250, with 40% in Germany. This uneven build-out confines passenger cars to fleet and pilot regions, suppressing broader adoption. China has 500 stations, but geography skews to coastal hubs, leaving inland provinces underserved. Capital costs of USD 2-4 million per site and high delivered hydrogen prices keep private investors cautious. California's temporary closure of 15 stations during supply shortages in 2024 damaged consumer confidence, illustrating fragility at early rollout stages.
Other drivers and restraints analyzed in the detailed report include:
- Government Zero-Emission Mandates in Heavy-Duty Transport
- Demand for Long-Duration Backup Power in Data Centers
- PGM & Nickel Price Volatility Inflating Stack Costs
For complete list of drivers and restraints, kindly check the Table Of Contents.
Segment Analysis
Polymer electrolyte membrane designs delivered 70.1% of 2025 revenue by virtue of automotive dominance. However, solid oxide solutions are expected to realize a 48.1% CAGR to 2031, twice the pace of PEM, as utilities value 60% electrical efficiency and fuel flexibility. Bloom Energy's platform operates on natural gas today and can transition to 100% hydrogen, lowering infrastructure hurdles. Alkaline systems hold a 4.2% share, confined to aerospace and submarine projects. Phosphoric acid, molten carbonate, and direct-methanol cells comprise the remainder but face competition from gas engines and lithium-ion storage. Innovations such as Ceres Power's steel-cell architecture, which reduces manufacturing cost by 40%, are widening technology choices in the fuel cell market.
Hydrogen supplied 65.3% of 2025 demand, undergirded by existing production infrastructure and broad stack compatibility. Natural-gas-derived hydrogen supports 26.9% of installations, mostly within North American stationary SOFC arrays, where pipeline availability lowers delivered costs. Ammonia, at an 8% baseline, is positioned for a 51.8% CAGR as maritime operators pivot toward zero-carbon bunkers. NYK Line and Samsung Heavy Industries expect to deploy ammonia-fueled SOFC vessels by 2028, leveraging a global ammonia trade network. Methanol and biogas occupy niche roles; each must overcome efficiency and impurity challenges before scaling within the wider fuel cell market.
Complete Report Scope:
- By Technology
- Polymer Electrolyte Membrane Fuel Cell (PEMFC)
- Solid Oxide Fuel Cell (SOFC)
- Alkaline Fuel Cell (AFC)
- Others [Phosphoric Acid Fuel Cell (PAFC), Molten Carbonate Fuel Cell (MCFC), Direct Methanol Fuel Cell (DMFC)]
- By Fuel Type
- Hydrogen
- Natural Gas/Methane
- Ammonia
- Others (Methanol, Biogas)
- By Application
- Vehicular (Passenger Cars, Buses & Coaches, Trucks, Material Handling Equipment, Rail, Marine Vessels)
- Non-Vehicular (Stationary Power, Portable Power, Micro-Combined Heat & Power)
- By End-User Industry
- Transportation
- Utilities
- Commercial and Industrial
- Others (Defense, Residential)
- By Geography
- North America
- United States
- Canada
- Mexico
- Europe
- United Kingdom
- Germany
- France
- Spain
- NORDIC Countries
- Russia
- Rest of Europe
- Asia-Pacific
- China
- India
- Japan
- South Korea
- Malaysia
- Thailand
- Indonesia
- Vietnam
- Australia
- Rest of Asia-Pacific
- South America
- Brazil
- Argentina
- Colombia
- Rest of South America
- Middle East and Africa
- United Arab Emirates
- Saudi Arabia
- South Africa
- Rest of Middle East and Africa
- North America
Geography Analysis
Asia-Pacific secured 57.5% of revenue in 2025 and is forecast to compound at a 36.8% CAGR through 2031. Japan's 160 refueling stations and 400,000 residential units spearhead adoption, while South Korea's KRW 500 billion hydrogen roadmap backs domestic suppliers. China's 500-station network and provincial subsidies sustain bus and logistics fleets amid retail softness. India and Southeast Asia trail in infrastructure, yet Australia's renewable surplus positions it as a future export hub. Divergent OEM strategies - with Toyota expanding while Honda scales back - underscore uneven market confidence but collectively reinforce regional leadership within the fuel cell market.
North America accounted for 22.3% revenue in 2025 and is expected to grow at a 34.2% CAGR. California anchors infrastructure with 60 stations and USD 240,000 vehicle vouchers, complemented by the federal USD 3-per-kilogram hydrogen production credit. Plug Power's forklift ecosystem dominates material handling, while Nikola targets long-haul freight. Canada's 40% investment credit leverages hydro resources for green hydrogen, yet station networks outside Vancouver and Toronto remain sparse. Mexico's early initiatives focus on cross-border trucking corridors. Policy continuity and electrolyzer cost declines will shape the region's trajectory.
Europe held a 15.8% share in 2025. Germany's 100 stations and IPCEI Hy2Tech funding underpin leadership, while Regulation 2024/1610 accelerates truck adoption. Nordic countries leverage renewable surpluses for export-oriented green hydrogen. Alstom's trains in Lower Saxony and Lombardy validate rail traction. The UK and France trail in deployment density, reflecting fragmented strategies. The Middle East and Africa, at 4.4% share, will grow fastest at 38.7% CAGR, propelled by the USD 8.4 billion NEOM and USD 1 billion Masdar-ADNOC complexes that target 2026-2027 commissioning. South America, at a 2.5% share, remains an early stage, with Chile and Brazil positioning as export suppliers rather than domestic consumers.
- Ballard Power Systems Inc.
- Plug Power Inc.
- FuelCell Energy Inc.
- Bloom Energy Corporation
- Doosan Fuel Cell Co., Ltd.
- Cummins Inc. (Hydrogenics)
- Toshiba Energy Systems & Solutions Corp.
- Panasonic Corporation
- Horizon Fuel Cell Technologies Pte. Ltd.
- Intelligent Energy Ltd.
- Nuvera Fuel Cells, LLC
- SFC Energy AG
- Mitsubishi Power Ltd.
- Hyundai Mobis Co., Ltd.
- Toyota Motor Corporation
- Nikola Corporation
- Ceres Power Holdings plc
- Ballard Motive Solutions Ltd.
- PowerCell Sweden AB
- AFC Energy plc
- Advent Technologies Holdings Inc.
- Gencell Ltd.
- Proton Motor Power Systems plc
Additional Benefits:
- The market estimate (ME) sheet in Excel format
- 3 months of analyst support
TABLE OF CONTENTS
1 Introduction
- 1.1 Study Assumptions & Market Definition
- 1.2 Scope of the Study
2 Research Methodology
3 Executive Summary
4 Market Landscape
- 4.1 Market Overview
- 4.2 Recent Trends & Developments
- 4.3 Market Drivers
- 4.3.1 Falling Costs of Green & Blue Hydrogen Generation
- 4.3.2 Automaker Commitments to FCEVs in Asia-Pacific
- 4.3.3 Government Zero-Emission Mandates in Heavy-Duty Transport (NA & EU)
- 4.3.4 Demand for Long-Duration Backup Power in Data Centers
- 4.3.5 Maritime Decarbonization Targets Accelerating Fuel Cell Adoption
- 4.3.6 Corporate Net-Zero Investment into On-Site Distributed Generation
- 4.4 Market Restraints
- 4.4.1 Scarcity of Hydrogen Refueling Infrastructure Outside JP & KR
- 4.4.2 PGM & Nickel Price Volatility Inflating Stack Costs
- 4.4.3 SOFC Performance Degradation in Maritime High-Sulfur Environments
- 4.4.4 Certification Gaps in US Building Codes Slowing Stationary Installations
- 4.5 Supply-Chain Analysis
- 4.6 Regulatory Outlook
- 4.7 Technological Outlook
- 4.8 Porte's Five Forces
- 4.8.1 Bargaining Power of Suppliers
- 4.8.2 Bargaining Power of Consumers
- 4.8.3 Threat of New Entrants
- 4.8.4 Threat of Substitute Products & Services
- 4.8.5 Intensity of Competitive Rivalry
5 Market Size & Growth Forecasts
- 5.1 By Technology
- 5.1.1 Polymer Electrolyte Membrane Fuel Cell (PEMFC)
- 5.1.2 Solid Oxide Fuel Cell (SOFC)
- 5.1.3 Alkaline Fuel Cell (AFC)
- 5.1.4 Others [Phosphoric Acid Fuel Cell (PAFC), Molten Carbonate Fuel Cell (MCFC), Direct Methanol Fuel Cell (DMFC)]
- 5.2 By Fuel Type
- 5.2.1 Hydrogen
- 5.2.2 Natural Gas/Methane
- 5.2.3 Ammonia
- 5.2.4 Others (Methanol, Biogas)
- 5.3 By Application
- 5.3.1 Vehicular (Passenger Cars, Buses & Coaches, Trucks, Material Handling Equipment, Rail, Marine Vessels)
- 5.3.2 Non-Vehicular (Stationary Power, Portable Power, Micro-Combined Heat & Power)
- 5.4 By End-User Industry
- 5.4.1 Transportation
- 5.4.2 Utilities
- 5.4.3 Commercial and Industrial
- 5.4.4 Others (Defense, Residential)
- 5.5 By Geography
- 5.5.1 North America
- 5.5.1.1 United States
- 5.5.1.2 Canada
- 5.5.1.3 Mexico
- 5.5.2 Europe
- 5.5.2.1 United Kingdom
- 5.5.2.2 Germany
- 5.5.2.3 France
- 5.5.2.4 Spain
- 5.5.2.5 NORDIC Countries
- 5.5.2.6 Russia
- 5.5.2.7 Rest of Europe
- 5.5.3 Asia-Pacific
- 5.5.3.1 China
- 5.5.3.2 India
- 5.5.3.3 Japan
- 5.5.3.4 South Korea
- 5.5.3.5 Malaysia
- 5.5.3.6 Thailand
- 5.5.3.7 Indonesia
- 5.5.3.8 Vietnam
- 5.5.3.9 Australia
- 5.5.3.10 Rest of Asia-Pacific
- 5.5.4 South America
- 5.5.4.1 Brazil
- 5.5.4.2 Argentina
- 5.5.4.3 Colombia
- 5.5.4.4 Rest of South America
- 5.5.5 Middle East and Africa
- 5.5.5.1 United Arab Emirates
- 5.5.5.2 Saudi Arabia
- 5.5.5.3 South Africa
- 5.5.5.4 Rest of Middle East and Africa
- 5.5.1 North America
6 Competitive Landscape
- 6.1 Market Concentration
- 6.2 Strategic Moves (M&A, Partnerships, PPAs)
- 6.3 Market Share Analysis (Market Rank/Share for key companies)
- 6.4 Company Profiles (includes Global level Overview, Market level overview, Core Segments, Financials as available, Strategic Information, Products & Services, and Recent Developments)
- 6.4.1 Ballard Power Systems Inc.
- 6.4.2 Plug Power Inc.
- 6.4.3 FuelCell Energy Inc.
- 6.4.4 Bloom Energy Corporation
- 6.4.5 Doosan Fuel Cell Co., Ltd.
- 6.4.6 Cummins Inc. (Hydrogenics)
- 6.4.7 Toshiba Energy Systems & Solutions Corp.
- 6.4.8 Panasonic Corporation
- 6.4.9 Horizon Fuel Cell Technologies Pte. Ltd.
- 6.4.10 Intelligent Energy Ltd.
- 6.4.11 Nuvera Fuel Cells, LLC
- 6.4.12 SFC Energy AG
- 6.4.13 Mitsubishi Power Ltd.
- 6.4.14 Hyundai Mobis Co., Ltd.
- 6.4.15 Toyota Motor Corporation
- 6.4.16 Nikola Corporation
- 6.4.17 Ceres Power Holdings plc
- 6.4.18 Ballard Motive Solutions Ltd.
- 6.4.19 PowerCell Sweden AB
- 6.4.20 AFC Energy plc
- 6.4.21 Advent Technologies Holdings Inc.
- 6.4.22 Gencell Ltd.
- 6.4.23 Proton Motor Power Systems plc
7 Market Opportunities & Future Outlook
- 7.1 White-space & Unmet-Need Assessment

 航太與國防燃料電池市場:2026-2032年全球市場預測燃料電池市場:按類型、組件、燃料類型、冷卻方式、系統配置、分銷管道和最終用戶分類-2026-2032年全球市場預測
 全球燃料電池航太應用市場:機會與策略展望(至2035年)
 燃料電池技術市場規模、佔有率和成長分析:按燃料電池類型、組件、尺寸、應用、最終用戶和地區分類-2026-2033年產業預測
 燃料電池市場規模、佔有率、趨勢和預測:按類型、應用和地區分類,2026-2034年
 燃料電池膜-2026-2032 年全球市場佔有率和排名、總銷售額和需求預測。
 主電源固定式燃料電池市場:商業機會、成長要素、產業趨勢分析及2026-2035年預測
 全球石墨烯燃料電池市場研究報告(2026版)
 燃料電池市場規模、佔有率、成長及全球產業分析:按類型、應用和地區分類-2026-2034年洞察與預測
 燃料電池市場:依應用、技術、區域分類