


 |
市場調查報告書
商品編碼
2073420
模組化UPS:市場佔有率分析、產業趨勢與統計、成長預測(2026-2031年)Modular UPS - Market Share Analysis, Industry Trends & Statistics, Growth Forecasts (2026 - 2031) |
||||||

※ 本網頁內容可能與最新版本有所差異。詳細情況請與我們聯繫。
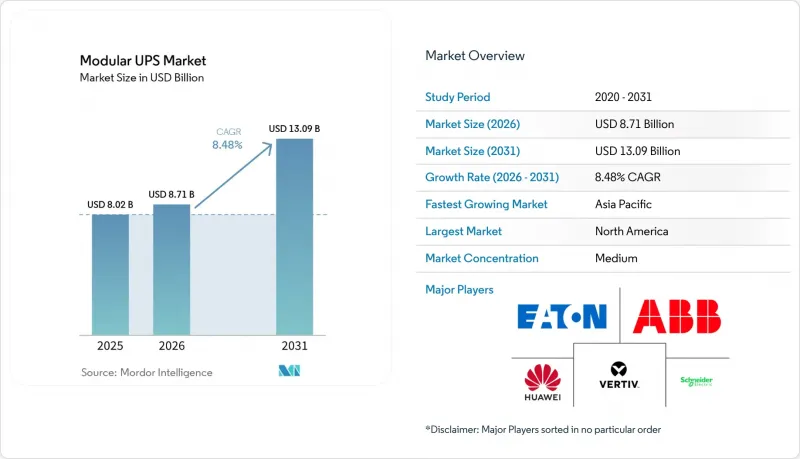
根據 Mordor Intelligence 預測,模組化 UPS 市場規模將從 2025 年的 80.2 億美元和 2026 年的 87.1 億美元成長到 2031 年的 130.9 億美元,2026 年至 2031 年的年複合成長率(CAGR)為 8.48%。
本報告按輸出容量(50千伏安以下、51-100千伏安、101-300千伏安、301-500千伏安和500千伏安以上)、終端用戶行業(資料中心、工業製造、電信、商業建築、銀行、金融服務和單相(BFSI)、單位機構、醫療保健等)、細分服務市場預測以美元 (USD) 為單位。
全球模組化UPS市場趨勢與洞察
超大規模和託管資料中心的擴張
超大規模雲端服務供應商正在採用模組化拓撲結構,以便僅在部署GPU叢集時才擴展電力基礎架構。微軟已預留1.5吉瓦的AI訓練容量用於分階段部署,並強制要求採用可依需求擴充模組的框架式UPS系統。領先的託管公司也在相應地改變其新建設的標準,一家運營商確認,2025年投入運作的設施中,超過三分之二將採用模組化電源框架,從而將1.8億美元的初始投資推遲到租戶合約最終確定之後。這種投資延期可以提高投資回報率(ROIC),並防止開發商在租賃需求放緩時因資產過時而遭受損失。
透過模組化擴充性降低總體擁有成本 (TCO)。
模組化框架設計只需添加一個模組即可實現 N+1 冗餘,而無需大幅增加整個 UPS 的體積,從而可降低約 15-20% 的硬體成本。由於技術人員可在 30 分鐘內完成熱插拔,維護工作也得以簡化。這避免了旁路操作所耗費的時間,而旁路操作在大型資料中心可能導致每小時高達 9,000 美元的停機損失。Schneider Electric的 EcoStruxure 平台將 UPS 運行與建築管理軟體整合,並根據分時電價最佳化充電,在多站點試點項目中實現了 8% 的電費降低。
與整體式UPS系統相比,初始投資成本較高。
模組化機櫃,如果配置齊全,其購置成本會高出25%至35%。如此高昂的價格往往會讓那些優先考慮初始成本而非生命週期經濟效益的買家望而卻步。新興市場的調查始終顯示,62%的資料中心開發人員認為資金籌措是採用模組化設計的最大障礙。 「電力即服務」(PaaS)提供了一種將資本支出(Capex)轉化為營運支出(OpEx)的方法,但其使用需要投資合格信用評級。遺憾的是,許多區域業者難以達到這些標準,這進一步阻礙了他們利用這些解決方案的能力。
細分市場分析
預計到2031年,容量超過500 kVA的大型安裝項目將以11.53%的複合年成長率成長,成為模組化UPS市場中成長最快的領域。營運商正在部署貨櫃式電源模組,該模組整合了UPS、開關設備和液冷母線槽,使得10兆瓦的受保護負載能夠以單一ISO貨櫃的形式從工廠出貨。這種方法將建設週期從18個月縮短至6個月,非常適合機架密度可能逐年翻倍的AI訓練叢集。 51-100 kVA細分市場在2025年將佔據模組化UPS市場佔有率的38.14%,對於負載成長遵循可預測的年度週期的中型託管資料中心和企業系統升級專案而言,該細分市場仍然是基本之選。
向高容量模組的轉變反映了數位基礎設施的整合趨勢。新建超大規模資料中心的平均機架密度已超過15千瓦,預計2027年將達到20度。基於IEC 62040-3性能等級的標準化允許營運商在單一機架中混合使用來自多個供應商的模組,從而促進組件之間的競爭,同時避免供應商鎖定。
預計到2025年,資料中心將佔模組化UPS市場規模的62.14%,以鞏固其在該市場的主導地位。然而,由於土地徵用限制和電網連接延遲導致開發週期延長,該領域的成長正在放緩。相比之下,預計到2031年,醫療保健產業將以每年9.12%的速度成長。醫院集團正從集中式整體系統轉向安裝在更靠近臨床負荷的分散式模組化單元,這可以將電池室佔用的面積減少三分之二,從而釋放出寶貴的占地面積用於放置能夠產生收益的醫療設備。
工業製造、電信和銀行業等領域的應用正在推動二次成長。在電信領域,模組化UPS系統確保5G核心節點的持續運作;在製造業,它們為工業4.0組裝提供基礎支持,這些裝配線無法承受意外的電壓驟降。商業建築和政府設施也逐步採用這項技術來保護邊緣運算和公共安全系統,儘管這些領域的採用率仍低於15%。
區域分析
預計亞太地區將成為模組化UPS市場增量價值成長最大的地區,到2031年將以10.32%的複合年成長率成長。中國國家發展和改革委員會已批准2024年價值136億美元的計算基礎設施項目,其中78%的項目指定採用模組化UPS機架以實現分階段部署。印度的「數位印度」舉措正在二線城市投資12億美元用於人工智慧賦能的數據盲區建設,同樣強調「按需收費」的電力保護方案。在日本和韓國,支援自動駕駛汽車和混合實境(MR)生態系統的邊緣微站點正在不斷增加,所有這些都需要高容錯性的三相UPS來保證延遲低於10毫秒。
北美地區憑藉已公佈的資料中心專案(總裝置容量達2.8吉瓦),預計到2025年仍將維持42.53%的市場佔有率。然而,由於平均併網等待時間長達24至36個月,維吉尼亞、德克薩斯州和加州的成長速度正在放緩。營運商正透過部署併網UPS系統來降低延遲風險,以便在等待永久供電期間,透過批發電力市場獲得收益。
歐洲一直是可再生能源與電網融合技術的試驗場。在德國,到2025年底,將有47兆瓦時的模組化UPS容量在輔助服務市場註冊,旨在將太陽能發電在中午過剩時段的電池使用貨幣化。中東也正在崛起成為新的中心。沙烏地阿拉伯公共投資基金已資助建造四個託管園區,專門用於部署適用於50°C環境溫度的磷酸鋰鐵模組化UPS系統,預計2025年投入使用。儘管由於企劃案融資的限制和電網的不穩定性,南美和非洲的部署進展緩慢,但巴西和南非的試點部署表明,即使在頻繁的電壓波動下,這種架構也具有很強的穩健性。
其他好處:
- Excel格式的市場預測(ME)表
- 3個月的分析師支持
目錄
第1章:引言
- 研究假設和市場定義
- 調查範圍
第2章:調查方法
第3章執行摘要
第4章 市場狀況
- 市場概覽
- 市場促進因素
- 超大規模和託管資料中心的擴張
- 透過模組化擴充性降低總體擁有成本 (TCO)。
- 快速部署邊緣運算和5G微型資料中心
- 利用需量反應實現併網UPS系統的商業化
- 採用鋰離子電池組件可提高功率密度。
- 循環經濟中的再生與搬遷模式
- 市場限制因素
- 高初始投資與整體式UPS相比
- 在資訊科技密集型產業之外,人們對IT密集型產業以外的認知度較低
- 電力電子元件的供應波動
- 網路化UPS架構中的網路安全風險
- 產業價值鏈分析
- 監理情勢
- 技術展望
- 波特五力分析
第5章 市場規模與成長預測
- 按產能
- 50千伏安或以下
- 51~100 kVA
- 101~300 kVA
- 301~500 kVA
- 超過500千伏安
- 按最終用戶行業分類
- 資料中心
- 工業製造
- 電訊
- 商業建築
- 銀行業、金融服務業及保險業
- 政府和公共基礎設施
- 衛生保健
- 其他終端用戶產業
- 依階段數
- 單相
- 三相
- 按組件
- 解決方案(硬體)
- 服務
- 按地區
- 北美洲
- 美國
- 加拿大
- 墨西哥
- 南美洲
- 巴西
- 阿根廷
- 其他南美國家
- 歐洲
- 德國
- 英國
- 法國
- 義大利
- 西班牙
- 其他歐洲國家
- 亞太地區
- 中國
- 日本
- 韓國
- 印度
- 澳洲
- 紐西蘭
- 其他亞太國家
- 中東和非洲
- 中東
- 阿拉伯聯合大公國
- 沙烏地阿拉伯
- 土耳其
- 其他中東國家
- 非洲
- 南非
- 奈及利亞
- 肯亞
- 其他非洲國家
- 中東
- 北美洲
第6章 競爭情勢
- 市場集中度
- 策略趨勢
- 市佔率分析
- 公司簡介
- Schneider Electric SE
- Huawei Technologies Co. Ltd.
- Vertiv Holdings Co.
- Eaton Corporation plc
- ABB Ltd.
- Delta Electronics Inc.
- Riello UPS(Riello Elettronica)
- AEG Power Solutions
- Socomec Group
- Borri SpA
- Kehua Data Co. Ltd.
- KSTAR Science and Technology
- CyberPower Systems Inc.
- Tripp Lite(by Eaton)
- Gamatronic(SolarEdge)
- Salicru SA
- Piller Power Systems
- Centiel SA
- Hitec Power Protection
- Statron AG
- PowerShield Ltd.
- Fuji Electric Co. Ltd.
- Mitsubishi Electric Corp.
- Toshiba Energy Systems and Solutions
- Shenzhen Zhicheng Champion Co. Ltd.
- Zhongheng Electric
第7章 市場機會與未來展望
According to Mordor Intelligence, the modular UPS market size is projected to expand from USD 8.02 billion in 2025 and USD 8.71 billion in 2026 to USD 13.09 billion by 2031, registering a CAGR of 8.48% between 2026 and 2031.
This report is Segmented by Power Capacity (<=50 KVA, 51-100 KVA, 101-300 KVA, 301-500 KVA, and >500 KVA), End User Industry (Data Centers, Industrial Manufacturing, Telecommunications, Commercial Buildings, BFSI, Government, Healthcare, and More), Phase Type (Single-Phase, and Three-Phase), Component (Solutions, and Services), and Geography. The Market Forecasts are Provided in Value (USD).
Global Modular UPS Market Trends and Insights
Expansion of Hyperscale and Colocation Data Centers
Hyperscale cloud providers are specifying modular topologies so that power infrastructure scales only when GPU clusters are installed. Microsoft earmarked 1.5 gigawatts of AI-training capacity for phased rollout, stipulating frame-based UPS systems that accept additional modules on demand. Leading colocation firms likewise shifted new-build standards, with one operator confirming that more than two-thirds of facilities commissioned in 2025 used modular power frames to defer USD 180 million in initial outlay until tenant contracts closed. Such deferral improves return on invested capital and shields developers from stranded assets when leasing momentum softens.
Lower Total Cost of Ownership Through Modular Scalability
A modular frame achieves N+1 redundancy by adding one extra module rather than oversizing the entire UPS, trimming hardware expense by roughly 15-20%. Routine maintenance becomes simpler because technicians hot-swap units in under 30 minutes, eliminating bypass windows that can cost large data centers USD 9,000 per hour in downtime penalties. Schneider Electric's EcoStruxure platform links UPS operations with building-management software, optimizing charging based on time-of-use tariffs and reducing electricity bills by 8% in multi-site pilots.
High Up-Front Capital Expenditure Versus Monolithic UPS
When fully populated, modular frames come with a 25-35% purchase premium. This higher price tag often discourages buyers who focus more on the initial cost rather than considering the long-term benefits of lifecycle economics. In emerging markets, surveys consistently reveal that 62% of data-center developers identify limited access to project financing as the primary obstacle to adopting modular designs. While power-as-a-service offerings provide a way to shift capital expenditures (capex) into operational expenditures (opex), they come with the requirement of investment-grade credit ratings. Unfortunately, many regional operators find it challenging to meet this benchmark, further hindering their ability to leverage such solutions.
Other drivers and restraints analyzed in the detailed report include:
- Rapid Edge and 5G Micro-Data-Center Deployment
- Grid-Interactive UPS Monetization via Demand-Response
- Limited Awareness Beyond IT-Intensive Verticals
For complete list of drivers and restraints, kindly check the Table Of Contents.
Segment Analysis
Large-scale installations above 500 kVA are projected to post an 11.53% CAGR to 2031, the fastest within the Modular UPS market. Operators deploy containerized power blocks that combine UPS, switchgear, and liquid-cooled busways, allowing 10 megawatts of protected load to leave the factory in a single ISO container. This approach compresses construction schedules from 18 to 6 months and aligns well with AI training clusters that can double rack density year-over-year. The 51-100 kVA bracket, which held 38.14% of the Modular UPS market share in 2025, remains the baseline choice for mid-tier colocation and enterprise refresh projects where load ramps follow predictable annual cycles.
The pivot toward high-capacity modules mirrors consolidation trends across the digital-infrastructure landscape. Average rack density in new hyperscale halls already exceeds 15 kilowatts and is projected to reach 20 kilowatts by 2027. Standardization around IEC 62040-3 performance classes enables operators to mix modules from several suppliers inside one frame, avoiding vendor lock-in and maintaining components in competitive tension.
Data centers captured 62.14% of 2025 value, underscoring their historical dominance in the Modular UPS market size. Growth within this segment is moderating, however, as land constraints and utility interconnection queues elongate development timelines. Healthcare, by contrast, is forecast to expand at 9.12% through 2031. Hospital groups are migrating from centralized, monolithic systems to distributed modular units that sit nearer to clinical loads, trimming battery-room footprint by two-thirds and freeing expensive floor space for revenue-generating medical equipment.
Industrial manufacturing, telecommunications, and banking installations represent secondary growth engines. In telecommunications, modular UPS secures always-on operation of 5G core nodes, while in manufacturing the architecture underpins Industry 4.0 assembly lines that cannot tolerate unexpected voltage sags. Commercial buildings and government facilities are also incrementally adopting the technology to protect edge compute and public-safety systems, although penetration here remains below 15%.
Complete Report Scope:
- By Power Capacity
- <= 50 kVA
- 51 - 100 kVA
- 101 - 300 kVA
- 301 - 500 kVA
- > 500 kVA
- By End User Industry
- Data Centers
- Industrial Manufacturing
- Telecommunications
- Commercial Buildings
- Banking, Financial Services and Insurance
- Government and Public Infrastructure
- Healthcare
- Rest of End User Industries
- By Phase Type
- Single-Phase
- Three-Phase
- By Component
- Solutions (Hardware)
- Services
- By Geography
- North America
- United States
- Canada
- Mexico
- South America
- Brazil
- Argentina
- Rest of South America
- Europe
- Germany
- United Kingdom
- France
- Italy
- Spain
- Rest of Europe
- Asia Pacific
- China
- Japan
- South Korea
- India
- Australia
- New Zealand
- Rest of Asia-Pacific
- Middle East and Africa
- Middle East
- United Arab Emirates
- Saudi Arabia
- Turkey
- Rest of Middle East
- Africa
- South Africa
- Nigeria
- Kenya
- Rest of Africa
- Middle East
- North America
Geography Analysis
Asia-Pacific is forecast to add the greatest incremental value to the Modular UPS market size, expanding at a 10.32% CAGR through 2031. China's National Development and Reform Commission cleared USD 13.6 billion of computing-infrastructure projects during 2024, with 78% specifying modular UPS frames to enable staged rollout. India's Digital India initiative is channeling USD 1.2 billion toward AI-ready data halls in Tier 2 cities, likewise favoring pay-as-you-grow power protection. Japan and South Korea are adding edge micro-sites that anchor autonomous-vehicle and mixed-reality ecosystems, all of which demand resilient three-phase UPS to guarantee sub-10-millisecond latency.
North America retained a commanding 42.53% share in 2025 thanks to a 2.8-gigawatt pipeline of announced U.S. data-center projects. Growth is slowing, however, as queue times for grid interconnection average 24-36 months in Virginia, Texas, and California. Operators are mitigating delay risk by incorporating grid-interactive UPS systems capable of earning revenue in wholesale power markets while awaiting permanent feeds.
Europe remains a technology test-bed for renewable-grid integration. Germany registered 47 megawatt-hours of modular UPS capacity in ancillary-services markets by end-2025, monetizing batteries during solar-induced midday oversupply. The Middle East is another emerging node; Saudi Arabia's Public Investment Fund financed four colocation campuses in 2025 that specified lithium-iron-phosphate-based modular UPS suitable for 50 °C ambient temperatures. South America and Africa trail on adoption, hampered by limited project finance and weaker grid stability, yet pilot deployments in Brazil and South Africa are demonstrating the architecture's resilience during frequent voltage excursions.
- Schneider Electric SE
- Huawei Technologies Co. Ltd.
- Vertiv Holdings Co.
- Eaton Corporation plc
- ABB Ltd.
- Delta Electronics Inc.
- Riello UPS (Riello Elettronica)
- AEG Power Solutions
- Socomec Group
- Borri S.p.A.
- Kehua Data Co. Ltd.
- KSTAR Science and Technology
- CyberPower Systems Inc.
- Tripp Lite (by Eaton)
- Gamatronic (SolarEdge)
- Salicru S.A.
- Piller Power Systems
- Centiel SA
- Hitec Power Protection
- Statron AG
- PowerShield Ltd.
- Fuji Electric Co. Ltd.
- Mitsubishi Electric Corp.
- Toshiba Energy Systems and Solutions
- Shenzhen Zhicheng Champion Co. Ltd.
- Zhongheng Electric
Additional Benefits:
- The market estimate (ME) sheet in Excel format
- 3 months of analyst support
TABLE OF CONTENTS
1 INTRODUCTION
- 1.1 Study Assumptions and Market Definition
- 1.2 Scope of the Study
2 RESEARCH METHODOLOGY
3 EXECUTIVE SUMMARY
4 MARKET LANDSCAPE
- 4.1 Market Overview
- 4.2 Market Drivers
- 4.2.1 Expansion of Hyperscale and Colocation Data Centers
- 4.2.2 Lower Total Cost of Ownership Through Modular Scalability
- 4.2.3 Rapid Edge and 5G Micro-Data-Center Deployment
- 4.2.4 Grid-Interactive UPS Monetization via Demand-Response
- 4.2.5 Lithium-ion Module Adoption Boosting Power Density
- 4.2.6 Circular-Economy Refurbishment and Redeployment Models
- 4.3 Market Restraints
- 4.3.1 High Up-Front Capital Expenditure Versus Monolithic UPS
- 4.3.2 Limited Awareness Beyond IT-Intensive Verticals
- 4.3.3 Power-Electronics Component Supply Volatility
- 4.3.4 Cyber-Security Exposure in Networked UPS Architectures
- 4.4 Industry Value-Chain Analysis
- 4.5 Regulatory Landscape
- 4.6 Technological Outlook
- 4.7 Porter's Five Forces Analysis
- 4.7.1 Bargaining Power of Buyers
- 4.7.2 Bargaining Power of Suppliers
- 4.7.3 Threat of New Entrants
- 4.7.4 Threat of Substitutes
- 4.7.5 Competitive Rivalry
5 MARKET SIZE AND GROWTH FORECASTS (VALUE)
- 5.1 By Power Capacity
- 5.1.1 <= 50 kVA
- 5.1.2 51 - 100 kVA
- 5.1.3 101 - 300 kVA
- 5.1.4 301 - 500 kVA
- 5.1.5 > 500 kVA
- 5.2 By End User Industry
- 5.2.1 Data Centers
- 5.2.2 Industrial Manufacturing
- 5.2.3 Telecommunications
- 5.2.4 Commercial Buildings
- 5.2.5 Banking, Financial Services and Insurance
- 5.2.6 Government and Public Infrastructure
- 5.2.7 Healthcare
- 5.2.8 Rest of End User Industries
- 5.3 By Phase Type
- 5.3.1 Single-Phase
- 5.3.2 Three-Phase
- 5.4 By Component
- 5.4.1 Solutions (Hardware)
- 5.4.2 Services
- 5.5 By Geography
- 5.5.1 North America
- 5.5.1.1 United States
- 5.5.1.2 Canada
- 5.5.1.3 Mexico
- 5.5.2 South America
- 5.5.2.1 Brazil
- 5.5.2.2 Argentina
- 5.5.2.3 Rest of South America
- 5.5.3 Europe
- 5.5.3.1 Germany
- 5.5.3.2 United Kingdom
- 5.5.3.3 France
- 5.5.3.4 Italy
- 5.5.3.5 Spain
- 5.5.3.6 Rest of Europe
- 5.5.4 Asia Pacific
- 5.5.4.1 China
- 5.5.4.2 Japan
- 5.5.4.3 South Korea
- 5.5.4.4 India
- 5.5.4.5 Australia
- 5.5.4.6 New Zealand
- 5.5.4.7 Rest of Asia-Pacific
- 5.5.5 Middle East and Africa
- 5.5.5.1 Middle East
- 5.5.5.1.1 United Arab Emirates
- 5.5.5.1.2 Saudi Arabia
- 5.5.5.1.3 Turkey
- 5.5.5.1.4 Rest of Middle East
- 5.5.5.2 Africa
- 5.5.5.2.1 South Africa
- 5.5.5.2.2 Nigeria
- 5.5.5.2.3 Kenya
- 5.5.5.2.4 Rest of Africa
- 5.5.5.1 Middle East
- 5.5.1 North America
6 COMPETITIVE LANDSCAPE
- 6.1 Market Concentration
- 6.2 Strategic Moves
- 6.3 Market Share Analysis
- 6.4 Company Profiles (includes Global Level Overview, Market Level Overview, Core Segments, Financials as available, Strategic Information, Market Rank/Share, Products and Services, Recent Developments)
- 6.4.1 Schneider Electric SE
- 6.4.2 Huawei Technologies Co. Ltd.
- 6.4.3 Vertiv Holdings Co.
- 6.4.4 Eaton Corporation plc
- 6.4.5 ABB Ltd.
- 6.4.6 Delta Electronics Inc.
- 6.4.7 Riello UPS (Riello Elettronica)
- 6.4.8 AEG Power Solutions
- 6.4.9 Socomec Group
- 6.4.10 Borri S.p.A.
- 6.4.11 Kehua Data Co. Ltd.
- 6.4.12 KSTAR Science and Technology
- 6.4.13 CyberPower Systems Inc.
- 6.4.14 Tripp Lite (by Eaton)
- 6.4.15 Gamatronic (SolarEdge)
- 6.4.16 Salicru S.A.
- 6.4.17 Piller Power Systems
- 6.4.18 Centiel SA
- 6.4.19 Hitec Power Protection
- 6.4.20 Statron AG
- 6.4.21 PowerShield Ltd.
- 6.4.22 Fuji Electric Co. Ltd.
- 6.4.23 Mitsubishi Electric Corp.
- 6.4.24 Toshiba Energy Systems and Solutions
- 6.4.25 Shenzhen Zhicheng Champion Co. Ltd.
- 6.4.26 Zhongheng Electric
7 MARKET OPPORTUNITIES AND FUTURE OUTLOOK
- 7.1 White-Space and Unmet-Need Assessment


