


 |
市場調查報告書
商品編碼
2073385
人工智慧供應鏈:市場佔有率分析、產業趨勢與統計、成長預測(2026-2031)Artificial Intelligence Supply Chain - Market Share Analysis, Industry Trends & Statistics, Growth Forecasts (2026 - 2031) |
||||||

※ 本網頁內容可能與最新版本有所差異。詳細情況請與我們聯繫。
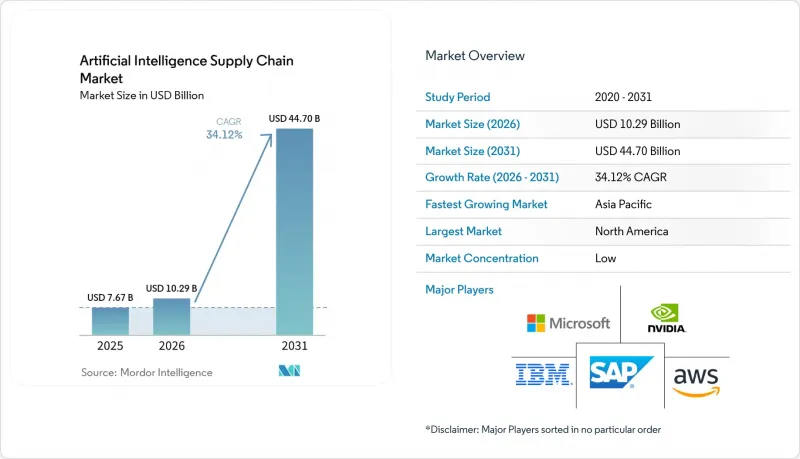
根據 Mordor Intelligence 預測,人工智慧驅動的供應鏈市場預計將從 2025 年的 76.7 億美元成長到 2026 年的 102.9 億美元,然後在 2031 年達到 447 億美元,2026 年至 2031 年的複合年成長率為 34.12%。
本報告以「交付方式」(硬體、軟體、服務)、「技術」(機器學習、電腦視覺等)、「應用」(供應鏈計畫和銷售與營運計畫、倉儲和庫存管理等)、「最終用戶產業」(製造業、汽車業等)及「地區」對產業進行分類。市場預測以美元計價。
全球人工智慧供應鏈市場趨勢與洞察
降低營運成本,減少錯誤
企業透過實施人工智慧進行預測性維護、動態路線規劃和智慧分配,實現了15-20%的成本降低和近乎完美的訂單準確率,使其能夠將由此產生的盈餘資金再投資於其他人工智慧專案。利用電腦視覺技術的汽車製造商已將缺陷率降低了30%,這項經濟效益正在加速離散產業和流程產業的平台普及。隨著規模經濟在多個工廠間協同擴展,人工智慧已成為在經濟波動中維持獲利能力的關鍵手段。
利用自主移動機器人提升倉庫處理能力
生產力提升25%至50%,事故率降低高達60%,充分證明了機器人系統能帶來即時的投資報酬率。此外,新興的人形機器人無需對現有設施進行大規模維修,即可實現獨立於任務的柔軟性。機器人部署在人事費用較高的地區進展最為迅速,預計到2030年,英國大部分履約中心都將自動化。這些成果將縮短投資回收期,並有助於應對蓬勃發展的電子商務需求。
AI加速器GPU供不應求與集中
頂級GPU的前置作業時間長達數週,價格接近4萬美元,迫使企業重新分配運算資源並採用更有效率的架構。 PCB基板的地理集中加劇了供應風險,迫使企業提前數年預訂產能,並重新思考其AI工作負載部署策略。
細分市場分析
到2025年,軟體平台將佔據人工智慧供應鏈市場47.02%的佔有率,這反映出企業傾向於選擇涵蓋規劃、執行和分析的整合套件。然而,隨著企業將實施、模型訓練和持續最佳化外包給專業合作夥伴,業務收益正以18.92%的複合年成長率成長。實施和託管服務供應商正受益於技能短缺和多供應商生態系統的複雜性。
硬體仍是市佔率最小的細分市場,但由於GPU瓶頸持續存在,其影響力遠超過整體市場。在供不應求的情況下,人們對TPU和FPGA等替代加速器的興趣日益濃厚,從而推動了程式碼移植和模型壓縮服務的需求。能夠整合異質運算堆疊而不犧牲效能的公司,正在整個人工智慧供應鏈中擴大其市場佔有率。
預計到2025年,機器學習將維持37.30%的市場佔有率,鞏固其作為需求預測和庫存補貨預設分析引擎的地位。自然語言處理透過將合約文字轉化為結構化洞察,加速了採購自動化進程;而電腦視覺的應用範圍正在從品質檢測擴展到機器人導航。
同時,情境感知運算正以22.15%的複合年成長率快速成長,物聯網遙測資料被輸入到即時最佳化引擎中。這些系統能夠根據環境溫度、設備狀態和交通模式調整決策,從而實現近乎瞬時的路線修正。隨著感測器價格的下降和邊緣人工智慧框架的日益成熟,與情境感知解決方案相關的人工智慧供應鏈市場預計將快速擴張。
區域分析
北美地區擁有雄厚的創業融資支持,並聚集了眾多科技巨頭,他們將人工智慧、雲端運算和邊緣運算服務整合為承包解決方案,預計到2025年,北美將佔據全球人工智慧供應鏈市場41.25%的佔有率。諸如Blue Yonder以8.39億美元收購One Network Enterprises等策略收購,清晰地展現了由客戶對端到端解決方案的需求所驅動的平台整合浪潮。此外,區域性企業也受益於監管政策的早期明確,這加速了試點計畫的實施和規模化推廣。
亞太地區是成長最快的地區,預計到2031年複合年成長率將達到17.9%。中國、日本和韓國正透過國家計畫為人工智慧基礎設施提供津貼,而主要製造業國家正在部署基於代理的人工智慧以應對勞動力短缺問題。此外,各國政府正資助半導體自給自足項目,以降低對海外GPU供應風險的依賴,這項措施正加速人工智慧在國內的普及應用。
在歐洲,有關永續性和可靠人工智慧的法規正在推動對透明且可審計的人工智慧工作流程的需求,並保持著穩定的成長勢頭。企業正在投資人工智慧,用於追蹤範圍3排放、最佳化逆向物流以及遵守歐盟人工智慧法律。同時,拉丁美洲和非洲的早期應用主要集中在基本視覺化和需求預測等用例上,這些用例通常透過降低准入門檻的雲端訂閱模式提供。
其他好處:
- Excel格式的市場預測(ME)表
- 3個月的分析師支持
目錄
第1章:引言
- 研究假設和市場定義
- 調查範圍
第2章:調查方法
第3章執行摘要
第4章 市場狀況
- 市場概覽
- 市場促進因素
- 降低營運成本,減少錯誤
- 利用自主移動機器人提升倉庫處理能力
- 通用人工智慧輔助駕駛技術在需求預測方面激增。
- 基於代理的人工智慧能夠實現供應鏈的端到端自主編配
- 利用合成數據提高供應計畫的準確性
- 整合人工智慧和物聯網的工業級雲端平台,可快速部署。
- 市場限制因素
- AI加速器GPU供不應求與集中
- 分散、低品質的遺留資料孤島
- 人工智慧特有的網路威脅和邊緣模型投毒的威脅日益加劇。
- 全球和國家層級都在製定可靠的人工智慧法規。
- 重要法規結構的評估
- 技術展望
- 波特五力模型
- 對關鍵相關人員的影響評估
- 主要用例和案例研究
- 宏觀經濟因素對市場的影響
- 投資分析
第5章 市場規模與成長預測
- 報價
- 硬體
- AI加速晶片(GPU、TPU、ASIC)
- 邊緣設備和感測器
- 機器人和自主移動機器人
- 軟體
- 人工智慧供應鏈平台
- 預測分析套件
- 服務
- 實施與整合
- 託管服務和支援服務
- 硬體
- 透過技術
- 機器學習
- 電腦視覺
- 自然語言處理
- 情境感知計算
- 其他人工智慧技術(圖、生成對抗網路)
- 透過使用
- 供應鏈計劃和SANDOP
- 倉儲和庫存管理
- 交通/車路線規劃
- 應對風險和干擾
- 虛擬助理和聊天機器人
- 最佳化採購和供應商
- 按最終用戶行業分類
- 製造業
- 車
- 食品/飲料
- 醫療保健和生命科學
- 零售與電子商務
- 航太/國防
- 消費品
- 其他產業(能源、化工)
- 按地區
- 北美洲
- 美國
- 加拿大
- 墨西哥
- 南美洲
- 巴西
- 阿根廷
- 其他南美國家
- 歐洲
- 英國
- 德國
- 法國
- 義大利
- 西班牙
- 北歐的
- 其他歐洲國家
- 中東和非洲
- GCC
- 以色列
- 南非
- 其他中東和非洲國家
- 亞太地區
- 中國
- 印度
- 日本
- 韓國
- ASEAN
- 澳洲
- 紐西蘭
- 其他亞太國家
- 北美洲
第6章 競爭情勢
- 市場集中度
- 策略趨勢
- 市佔率分析
- 公司簡介
- Amazon Web Services, Inc.
- Microsoft Corporation
- IBM Corporation
- SAP SE
- NVIDIA Corporation
- Intel Corporation
- Oracle Corporation
- Alibaba Group Holding Limited
- Deutsche Post DHL Group
- Logility, Inc.
- Blue Yonder Group, Inc.
- Kinaxis Inc.
- C3.ai, Inc.
- Google LLC(Google Cloud)
- Palantir Technologies Inc.
- Zebra Technologies Corporation
- Llamasoft(a Coupa company)
- Salesforce, Inc.
- Accenture plc(supply-chain AI services)
- Snowflake Inc.
第7章 市場機會與未來展望
According to Mordor Intelligence, the artificial intelligence supply chain market size is expected to grow from USD 7.67 billion in 2025 to USD 10.29 billion in 2026 and is forecast to reach USD 44.7 billion by 2031 at 34.12% CAGR over 2026-2031.
This report Segments the Industry Into by Offering (Hardware, Software, and Services), Technology (Machine Learning, Computer Vision, and More), Application (Supply-Chain Planning and SandOP, Warehouse and Inventory Management, and More), End-User Industry (Manufacturing, Automotive, and More), and Geography. The Market Forecasts are Provided in Terms of Value (USD).
Global Artificial Intelligence Supply Chain Market Trends and Insights
Lower operating costs and error reduction
Enterprises deploying AI for predictive maintenance, dynamic routing, and intelligent allocation report 15-20% cost savings and near-perfect order accuracy, gains that free capital for additional AI projects. Automotive manufacturers using computer vision have cut defect rates by 30%, reinforcing a financial case that accelerates platform rollouts across discrete and process industries. Scaling benefits compound over multiple facilities, positioning AI as an essential lever for margin protection during economic volatility.
Enhanced warehouse throughput via autonomous mobile robots
Productivity jumps of 25-50% and incident reductions up to 60% demonstrate robotic systems' immediate ROI, while emerging humanoid designs promise task-agnostic flexibility without large facility retrofits. Uptake is strongest in high labor-cost regions, with projections that most UK fulfillment centers will add robots by 2030. These gains shorten payback periods and support the growing e-commerce demand surge.
Shortage and concentration of AI accelerator GPUs
Lead times for top-tier GPUs have reached double digits in weeks, with list prices nearing USD 40,000, prompting enterprises to ration compute and adopt more efficient architectures. Supply risk is magnified by geographic clustering of substrate manufacturing, compelling firms to pre-order capacity years ahead and rethink AI workload placement strategies.
Other drivers and restraints analyzed in the detailed report include:
- Surge in Gen-AI copilots for demand forecasting
- Agentic AI for end-to-end self-orchestration
- Expanding AI-specific cyber and model-poisoning threats at the edge
For complete list of drivers and restraints, kindly check the Table Of Contents.
Segment Analysis
Software platforms held 47.02% artificial intelligence supply chain market share in 2025, reflecting enterprises' preference for integrated suites that span planning, execution, and analytics. Yet services revenue is increasing at 18.92% CAGR as organizations outsource implementation, model training, and continuous optimization to specialized partners. Implementation and managed-service providers benefit from skills shortages and the complexity of multi-vendor ecosystems.
Hardware remains the smallest slice but exerts outsized influence due to the ongoing GPU bottleneck. Scarcity has sparked interest in alternative accelerators such as TPUs and FPGAs, which in turn drives demand for code-porting and model-compression services. Firms that can integrate heterogeneous compute stacks without sacrificing performance are capturing share across the artificial intelligence supply chain market.
Machine learning retained 37.30% share in 2025, cementing its status as the default analytic engine for demand prediction and replenishment. Natural language processing accelerates procurement automation by translating contract text into structured insights, while computer vision expands from quality inspection to robotic navigation.
Context-aware computing, however, is scaling fastest at 22.15% CAGR as IoT telemetry feeds real-time optimization engines. These systems adjust decisions based on ambient temperature, equipment health, and traffic patterns, delivering near-instant course corrections. The artificial intelligence supply chain market size linked to context-aware solutions is projected to climb sharply as sensor prices decline and edge-AI frameworks mature.
Complete Report Scope:
- By Offering
- Hardware
- AI accelerator chips (GPU, TPU, ASIC)
- Edge devices and sensors
- Robotics and AMRs
- Software
- AI supply-chain platforms
- Predictive analytics suites
- Services
- Implementation and integration
- Managed and support services
- Hardware
- By Technology
- Machine Learning
- Computer Vision
- Natural Language Processing
- Context-Aware Computing
- Other AI Techniques (Graph, GANs)
- By Application
- Supply-chain planning and SandOP
- Warehouse and inventory management
- Transportation / fleet routing
- Risk and disruption management
- Virtual assistants and chatbots
- Procurement and sourcing optimisation
- By End-User Industry
- Manufacturing
- Automotive
- Food and Beverages
- Healthcare and Life-Sciences
- Retail and E-commerce
- Aerospace and Defence
- Consumer-Packaged Goods
- Other Industries (Energy, Chemicals)
- By Geography
- North America
- United States
- Canada
- Mexico
- South America
- Brazil
- Argentina
- Rest of South America
- Europe
- United Kingdom
- Germany
- France
- Italy
- Spain
- Nordics
- Rest of Europe
- Middle East and Africa
- GCC
- Israel
- South Africa
- Rest of Middle East and Africa
- Asia-Pacific
- China
- India
- Japan
- South Korea
- ASEAN
- Australia
- New Zealand
- Rest of Asia-Pacific
- North America
Geography Analysis
North America captured the highest artificial intelligence supply chain market share at 41.25% in 2025, buoyed by robust venture funding and the presence of technology giants that bundle AI, cloud, and edge services into turnkey offerings. Strategic acquisitions such as Blue Yonder's USD 839 million purchase of One Network Enterprises illustrate a platform-consolidation wave driven by customer demand for end-to-end solutions. Regional enterprises also benefit from early regulatory clarity, supporting faster pilots and scaleouts.
Asia-Pacific is the fastest growing region with an 17.9% CAGR through 2031. National programs in China, Japan, and South Korea subsidize AI infrastructure, while manufacturing powerhouses deploy agentic AI to counter labor shortages. Governments are additionally funding semiconductor self-sufficiency projects to reduce exposure to overseas GPU supply risks, an incentive that accelerates domestic AI adoption.
Europe maintains a steady growth path as sustainability and trustworthy-AI regulations spur demand for transparent, auditable AI workflows. Enterprises invest in AI to track Scope 3 emissions, optimize reverse logistics, and comply with the EU Artificial Intelligence Act. Elsewhere, early-stage deployments in Latin America and Africa focus on basic visibility and demand-planning use cases, often delivered via cloud-based subscription models that lower entry barriers.
- Amazon Web Services, Inc.
- Microsoft Corporation
- IBM Corporation
- SAP SE
- NVIDIA Corporation
- Intel Corporation
- Oracle Corporation
- Alibaba Group Holding Limited
- Deutsche Post DHL Group
- Logility, Inc.
- Blue Yonder Group, Inc.
- Kinaxis Inc.
- C3.ai, Inc.
- Google LLC (Google Cloud)
- Palantir Technologies Inc.
- Zebra Technologies Corporation
- Llamasoft (a Coupa company)
- Salesforce, Inc.
- Accenture plc (supply-chain AI services)
- Snowflake Inc.
Additional Benefits:
- The market estimate (ME) sheet in Excel format
- 3 months of analyst support
TABLE OF CONTENTS
1 INTRODUCTION
- 1.1 Study Assumptions and Market Definition
- 1.2 Scope of the Study
2 RESEARCH METHODOLOGY
3 EXECUTIVE SUMMARY
4 MARKET LANDSCAPE
- 4.1 Market Overview
- 4.2 Market Drivers
- 4.2.1 Lower operating costs and error reduction
- 4.2.2 Enhanced warehouse throughput via autonomous mobile robots
- 4.2.3 Surge in Gen-AI copilots for demand forecasting
- 4.2.4 Agentic AI for end-to-end self-orchestration of supply chains
- 4.2.5 Synthetic data improving supply-planning accuracy
- 4.2.6 Industry-cloud platforms bundling AI and IoT for quick deployment
- 4.3 Market Restraints
- 4.3.1 Shortage and concentration of AI accelerator GPUs
- 4.3.2 Fragmented, poor-quality legacy data silos
- 4.3.3 Expanding AI-specific cyber and model-poisoning threats at the edge
- 4.3.4 Emerging global and state-level trustworthy-AI regulations
- 4.4 Evaluation of Critical Regulatory Framework
- 4.5 Technological Outlook
- 4.6 Porter's Five Forces
- 4.6.1 Bargaining Power of Suppliers
- 4.6.2 Bargaining Power of Buyers
- 4.6.3 Threat of New Entrants
- 4.6.4 Threat of Substitutes
- 4.6.5 Competitive Rivalry
- 4.7 Impact Assessment of Key Stakeholders
- 4.8 Key Use Cases and Case Studies
- 4.9 Impact on Macroeconomic Factors of the Market
- 4.10 Investment Analysis
5 MARKET SIZE AND GROWTH FORECAST (VALUE)
- 5.1 By Offering
- 5.1.1 Hardware
- 5.1.1.1 AI accelerator chips (GPU, TPU, ASIC)
- 5.1.1.2 Edge devices and sensors
- 5.1.1.3 Robotics and AMRs
- 5.1.2 Software
- 5.1.2.1 AI supply-chain platforms
- 5.1.2.2 Predictive analytics suites
- 5.1.3 Services
- 5.1.3.1 Implementation and integration
- 5.1.3.2 Managed and support services
- 5.1.1 Hardware
- 5.2 By Technology
- 5.2.1 Machine Learning
- 5.2.2 Computer Vision
- 5.2.3 Natural Language Processing
- 5.2.4 Context-Aware Computing
- 5.2.5 Other AI Techniques (Graph, GANs)
- 5.3 By Application
- 5.3.1 Supply-chain planning and SandOP
- 5.3.2 Warehouse and inventory management
- 5.3.3 Transportation / fleet routing
- 5.3.4 Risk and disruption management
- 5.3.5 Virtual assistants and chatbots
- 5.3.6 Procurement and sourcing optimisation
- 5.4 By End-User Industry
- 5.4.1 Manufacturing
- 5.4.2 Automotive
- 5.4.3 Food and Beverages
- 5.4.4 Healthcare and Life-Sciences
- 5.4.5 Retail and E-commerce
- 5.4.6 Aerospace and Defence
- 5.4.7 Consumer-Packaged Goods
- 5.4.8 Other Industries (Energy, Chemicals)
- 5.5 By Geography
- 5.5.1 North America
- 5.5.1.1 United States
- 5.5.1.2 Canada
- 5.5.1.3 Mexico
- 5.5.2 South America
- 5.5.2.1 Brazil
- 5.5.2.2 Argentina
- 5.5.2.3 Rest of South America
- 5.5.3 Europe
- 5.5.3.1 United Kingdom
- 5.5.3.2 Germany
- 5.5.3.3 France
- 5.5.3.4 Italy
- 5.5.3.5 Spain
- 5.5.3.6 Nordics
- 5.5.3.7 Rest of Europe
- 5.5.4 Middle East and Africa
- 5.5.4.1 GCC
- 5.5.4.2 Israel
- 5.5.4.3 South Africa
- 5.5.4.4 Rest of Middle East and Africa
- 5.5.5 Asia-Pacific
- 5.5.5.1 China
- 5.5.5.2 India
- 5.5.5.3 Japan
- 5.5.5.4 South Korea
- 5.5.5.5 ASEAN
- 5.5.5.6 Australia
- 5.5.5.7 New Zealand
- 5.5.5.8 Rest of Asia-Pacific
- 5.5.1 North America
6 COMPETITIVE LANDSCAPE
- 6.1 Market Concentration
- 6.2 Strategic Moves
- 6.3 Market Share Analysis
- 6.4 Company Profiles (includes Global level Overview, Market level overview, Core Segments, Financials as available, Strategic Information, Market Rank/Share for key companies, Products and Services, and Recent Developments)
- 6.4.1 Amazon Web Services, Inc.
- 6.4.2 Microsoft Corporation
- 6.4.3 IBM Corporation
- 6.4.4 SAP SE
- 6.4.5 NVIDIA Corporation
- 6.4.6 Intel Corporation
- 6.4.7 Oracle Corporation
- 6.4.8 Alibaba Group Holding Limited
- 6.4.9 Deutsche Post DHL Group
- 6.4.10 Logility, Inc.
- 6.4.11 Blue Yonder Group, Inc.
- 6.4.12 Kinaxis Inc.
- 6.4.13 C3.ai, Inc.
- 6.4.14 Google LLC (Google Cloud)
- 6.4.15 Palantir Technologies Inc.
- 6.4.16 Zebra Technologies Corporation
- 6.4.17 Llamasoft (a Coupa company)
- 6.4.18 Salesforce, Inc.
- 6.4.19 Accenture plc (supply-chain AI services)
- 6.4.20 Snowflake Inc.
7 MARKET OPPORTUNITIES AND FUTURE OUTLOOK
- 7.1 White-space and Unmet-need Assessment

 2026年全球人工智慧供應鏈規劃軟體市場報告2026年全球供應鏈視覺與人工智慧市場報告2026年全球供應鏈預測人工智慧(AI)市場報告2026年全球庫存最佳化人工智慧(AI)市場報告
 循環庫存最佳化市場:預測至 2034 年 - 按最佳化類型、庫存類型、循環策略、部署模式、最終用戶和地區分類的全球分析
 供應鏈人工智慧市場:按組件、技術類型、部署模式、組織規模、應用和最終用戶分類-2026-2032年全球市場預測2034年財務規劃與分析軟體市場預測-按解決方案類型、部署模式、功能、應用、企業規模和地區分類的全球分析採購自動化市場預測至2034年-按組件、部署模式、採購類型、應用、最終用戶和地區分類的全球分析下一代化學最佳化平台市場預測至2034年—按組件、部署模式、應用、最終用戶和地區分類的全球分析人工智慧市場預測:供應鏈最佳化(2034 年)—按組件、技術、應用、最終用戶和地區分類的全球分析