

 |
市場調查報告書
商品編碼
2073094
排放因子庫和碳情報軟體:市場佔有率分析、行業趨勢和統計數據、成長預測(2026-2031 年)Emissions Factor Library and Carbon Intelligence Software - Market Share Analysis, Industry Trends & Statistics, Growth Forecasts (2026 - 2031) |
||||||

※ 本網頁內容可能與最新版本有所差異。詳細情況請與我們聯繫。
據 Mordor Intelligence 稱,排放因子庫和碳情報軟體的市場規模預計將從 2025 年的 18.6 億美元成長到 2026 年的 21.9 億美元,到 2031 年達到 49.3 億美元,預計 2026 年至 2031 年的複合成長率為 17.62%。
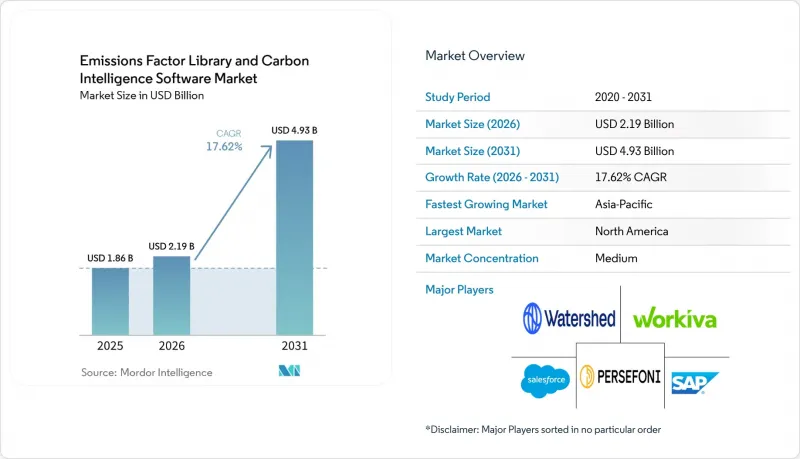
本報告按組件(軟體和服務)、部署類型(雲端、本地部署、混合部署)、應用(碳核算、報告、合規、排放追蹤和監測等)、最終用戶產業(製造業、能源和公共產業等)以及地區進行細分。市場預測以價值(美元)表示。
全球排放因子庫與碳情報軟體市場趨勢與洞察
氣候相關資訊揭露義務及審計準備
由於報告期限直接要求結構化的資料收集和有據可查的計算方法,資訊揭露義務仍然是排放因子庫和碳排放智慧軟體短期發展的最強驅動力。這種壓力不僅限於揭露總排放,保證要求還要求提供可追溯的記錄,以便審計人員能夠核實資訊來源數據、調查方法和排放因子。這正推動排放因子庫和碳排放智慧軟體市場朝向具有更強大的審計日誌、受控的工作流程以及與溫室氣體 (GHG) 運算標準更清晰整合的平台發展。此外,隨著 ISO 14064-3 不斷影響保證工作的實際進行方式,驗證和檢驗的角色也變得日益重要。因此,排放因子庫和碳排放智慧軟體市場的買家不再僅僅尋求資訊揭露成果,而是尋求能夠經受有限保證和未來更嚴格報告審查的系統。
整個供應商網路範圍內的範圍 3 資料品質面臨壓力
範圍 3 的排放持續改變軟體需求格局,因為供應商和價值鏈的排放通常占公司碳足跡的很大一部分。儘管企業正在擴大其在所有三個排放範圍的報告範圍,但供應商數據的可用性和內部數據的品質仍然是日常實施的主要障礙。這種情況正促使排放因子庫和碳智慧軟體市場從單純的資訊揭露工具轉向能夠支援供應商參與、源級證據和更可控分配的系統。建議的範圍 3 指南修訂案降低了基於支出的常用方法的永續性,增加了對主要供應商數據和更強力的數據管治的需求。在排放因子庫和碳智慧軟體市場,這有利於那些能夠在單一環境中整合資料收集、因子管理和工作流程控制的供應商。
排放因子調查方法分散且不一致
由於溫室氣體會計系統、ISO 14064、PCAF 和 ESRS 等相關報告要求存在重疊,以及各行業的具體方法,排放因子庫和碳資訊軟體市場持續面臨挑戰。供應商必須使其計算引擎與多個框架相容,同時還要幫助客戶在不同的合規要求下報告單一排放清單。這增加了產品的複雜性,標準修訂也為排放因子庫和碳資訊軟體市場的供應商和買家都帶來了更大的衝擊。此外,這也給沒有專門負責選擇、管理和定期更新研究調查方法的內部技術人員的中型企業用戶帶來了額外的負擔。因此,調查方法的細分正在減緩排放因子庫和碳資訊軟體市場中某些用戶的採用速度,這些用戶需要的是簡單的工具,但卻面臨著複雜的揭露要求。
細分市場分析
到2025年,軟體收入將佔總收入的78.41%,這一排放因子庫和碳智慧軟體市場細分領域主要由平台訂閱和企業軟體部署驅動。軟體類別保持主導地位,因為大多數大型買家仍然傾向於選擇管理功能更強大、能夠將碳數據整合到財務、採購和供應鏈工作流程中的系統。在碳會計軟體產業,軟體的優勢在於,一旦平台整合到ERP和報告流程中,切換成本就會降低。這確保了穩定的收入基礎,即使買家需要更多的實施支援和領域支援。
預計2026年至2031年間,服務板塊的複合年成長率將達到19.67%,成為排放因子庫和碳情報軟體市場中成長最快的板塊。由於缺乏內部專業團隊的公司在設計清單、準備保證文件和調整調查方法面臨許多挑戰,因此對服務的需求不斷成長。因此,將軟體存取與諮詢支援相結合的託管服務模式在排放因子庫和碳情報軟體市場中日益普及。這一趨勢在Normative公司發布的「碳清單託管服務」報告中得到了印證。該公司計劃於2026年推出該服務,並在上線六週內提供超過1000小時的專屬客戶支持,並完成溫室氣體會計系統認證。未來,收入結構預計將轉向捆綁式服務,同時不會影響軟體平台的核心功能。
預計到2025年,基於雲端的部署將佔總收入的69.94%。這反映了排放因子庫和碳智慧軟體市場以SaaS主導的結構,以及處理跨站點和供應商的大量活動數據的需求。雲端系統之所以仍然具有吸引力,是因為它們易於擴展和更新,並且可以輕鬆整合用於揭露和審計準備的外部資料流。這在排放因子庫和碳智慧軟體市場尤其重要,因為該市場的報告週期固定,數據量持續成長。與完全本地部署相比,買家也繼續看重雲端工具更輕的設定負擔。
預計2026年至2031年間,混合部署的複合年成長率將達到18.83%,這反映了規模和可管理性之間更為現實的平衡。儘管跨國公司通常需要基於雲端的分析功能,但內部政策和特定司法管轄區的資料處理要求又使得部分資料必須保留在本地或現有企業環境中。排放因子庫和碳智慧軟體市場正透過建構跨多個環境的運算、數據管理和報告架構來應對這項挑戰。 Sweep將於2026年發布一款與AWS整合的雲端排放測解決方案,顯示供應商正致力於將雲端資料流整合到可追溯的報告結構中。隨著保障和資料處理歷程要求日益嚴格,這將進一步推動混合部署的擴展。
區域分析
到2025年,北美將佔據36.44%的銷售佔有率,成為排放因子庫和碳情報軟體市場最大的區域板塊。該地區受益於許多大型企業的集中佈局,這些企業已擁有成熟的報告、採購和財務系統,從而促進了平台整合。此外,加州的揭露時間表將於2026年要求企業提交結構化的範圍1和範圍2報告,隨後將要求提交範圍3報告,這將增加企業短期採購的緊迫性。在排放因子庫和碳情報軟體市場,這在北美形成了合規需求與企業準備度高度契合的局面。
預計到2031年,亞太地區將以22.81%的複合年成長率成長,成為排放因子庫和碳情報軟體市場成長最快的地區。這一成長主要得益於日本、澳大利亞、新加坡、韓國和中國強制性或分階段披露政策的推行,這些政策擴大了該地區對正式碳數據系統的需求。此外,亞太地區在全球製造業供應鏈中的重要地位也為其發展提供了助力,因為對供應商層級排放資訊的需求已深入亞太地區的生產網路。這使得排放因子庫和碳情報軟體市場不僅對大型上市公司至關重要,而且對服務於有範圍3報告需求的國際客戶的供應商也同樣重要。印度也正透過企業社會責任和永續發展報告(BRSR)框架獲得發展動力,該框架正在推動人們對溫室氣體(GHG)清單工具產生更有系統的興趣。
預計到2025年,歐洲仍將是第二大區域市場,需求主要集中在面臨更高氣候報告預期和鑑證需求的大型企業。即使2026年CSRD的覆蓋範圍有所縮小,但仍受其約束的公司構成了一個高容量的客戶群,足以支撐企業級支出的持續成長。南美洲仍然是一個新興市場,其應用主要集中在採礦、農業和消費品行業,這與跨國公司的報告要求密切相關。中東和非洲的排放因子庫和碳情報軟體市場仍處於起步階段,其應用更多地受到國家淨零排放計劃、跨國公司子公司以及與外部合作夥伴合作的資訊揭露需求的驅動,而非完全成熟的本地需求。
其他好處
- Excel格式的市場預測(ME)表
- 3個月的分析師支持
目錄
第1章:引言
- 研究假設和市場定義
- 調查範圍
第2章:調查方法
第3章執行摘要
第4章 市場狀況
- 市場概覽
- 市場促進因素
- 氣候變遷資訊揭露義務和審計準備
- 確保整個供應商網路範圍 3 資料品質的壓力
- 對排放因子庫進行版本控制和可追溯性的必要性。
- 人工智慧驅動的因子匹配活動
- 與ERP、採購和財務營運系統整合
- 制定產品和工廠層面的詳細脫碳計畫。
- 市場限制因素
- 排放因子調查方法零散且不一致
- 範圍 3 映射中供應商活動資料品質低下
- 中型企業實施負擔沉重
- 小眾材料和新興市場的因素覆蓋範圍有限
- 宏觀經濟因素對市場的影響
- 產業價值鏈分析
- 監理情勢
- 技術展望
- 波特五力分析
第5章 市場規模與成長預測
- 按組件
- 軟體
- 服務
- 按實現類型
- 基於雲端的
- 本地部署
- 混合型
- 透過使用
- 碳核算、報告和合規性
- 排放追蹤與監測
- 排放因子庫的管理
- 永續性資料管理
- 碳情報與分析
- 按最終用戶行業分類
- 製造業
- 能源與公共產業
- 運輸/物流
- 銀行、金融服務和保險(BFSI)
- 零售和消費品
- 醫療保健和生命科學
- IT/通訊
- 政府/公共部門
- 其他
- 按地區
- 北美洲
- 美國
- 加拿大
- 墨西哥
- 南美洲
- 巴西
- 阿根廷
- 智利
- 其他南美國家
- 歐洲
- 德國
- 英國
- 法國
- 義大利
- 西班牙
- 其他歐洲國家
- 亞太地區
- 中國
- 日本
- 印度
- 澳洲
- 韓國
- 新加坡
- 其他亞太國家
- 中東
- 沙烏地阿拉伯
- 阿拉伯聯合大公國
- 土耳其
- 其他中東國家
- 非洲
- 南非
- 埃及
- 奈及利亞
- 其他非洲地區
- 北美洲
第6章 競爭情勢
- 市場集中度
- 策略趨勢
- 市佔率分析
- 公司簡介
- Salesforce, Inc.
- Workiva Inc.
- Persefoni AI, Inc.
- Watershed Technology, Inc.
- SAP SE
- IBM Corporation
- Microsoft Corporation
- ENGIE Impact
- Schneider Electric SE
- Sphera Solutions, Inc.
- Cority Software Inc.
- Normative AB
- Sweep SAS
- Position Green AB
- Greenly SAS
- Enablon North America Corporation
- Diligent Corporation
- IsoMetrix Software LLC
- Emitwise Ltd.
第7章 市場機會與未來展望
According to Mordor Intelligence, the emissions factor library and carbon intelligence software market size is expected to increase from USD 1.86 billion in 2025 to USD 2.19 billion in 2026 and reach USD 4.93 billion by 2031, growing at a CAGR of 17.62% over 2026 to 2031.
This report is Segmented by Component (Software, and Services), Deployment (Cloud-Based, On-Premises, and Hybrid), Application (Carbon Accounting, Reporting, and Compliance, Emissions Tracking and Monitoring, and More), End User Industry (Manufacturing, Energy and Utilities, and More), and Geography. The Market Forecasts are Provided in Terms of Value (USD).
Global Emissions Factor Library and Carbon Intelligence Software Market Trends and Insights
Mandatory Climate Disclosure and Audit Readiness
Mandatory disclosure remains the strongest near-term trigger for the emissions factor library and carbon intelligence software market because reporting deadlines create a direct need for structured data collection and documented calculation methods. The pressure is not limited to publishing emissions totals, because assurance requirements also require traceable records that auditors can review across source data, methodologies, and emissions factors. This is pushing the emissions factor library and carbon intelligence software market toward platforms with stronger audit logs, controlled workflows, and clearer linkage to GHG accounting standards. The role of validation and verification has also become more important as ISO 14064-3 continues to shape how assurance work is carried out in practice. As a result, buyers in the emissions factor library and carbon intelligence software market are no longer looking only for disclosure outputs, they are also looking for systems that can stand up to limited assurance and future upgrades in reporting scrutiny.
Scope 3 Data Quality Pressure Across Supplier Networks
Scope 3 emissions continue to reshape software demand because supplier and value chain emissions often make up the largest part of a company's footprint. Companies are expanding reporting across all 3 emissions scopes, but supplier data availability and internal data quality remain major barriers in day-to-day implementation. This is moving the emissions factor library and carbon intelligence software market away from narrow disclosure tools and toward systems that can support supplier engagement, source-level evidence, and more controlled allocations. Proposed revisions to Scope 3 guidance are also making generic spend-based approaches less durable, which increases the need for primary supplier data and stronger data governance. In the emissions factor library and carbon intelligence software market, this favors vendors that can connect data collection, factor management, and workflow control in a single environment.
Fragmented and Inconsistent Emissions Factor Methodologies
The emissions factor library and carbon intelligence software market still faces friction from the overlap between GHG Protocol, ISO 14064, PCAF, ESRS-linked reporting needs, and sector-specific methods. Vendors must keep calculation engines aligned with more than one framework, while also helping customers report a single emissions inventory across different compliance settings. This increases product complexity and makes standard revisions more disruptive for both suppliers and buyers in the emissions factor library and carbon intelligence software market. It also creates a heavier burden for midmarket users that do not have internal technical staff focused on methodology choices, controls, and periodic updates. The result is that methodology fragmentation slows adoption in parts of the emissions factor library and carbon intelligence software market where buyers need simple tools but face complex disclosure expectations.
Other drivers and restraints analyzed in the detailed report include:
- Emissions Factor Library Version Control and Traceability Demand
- AI-Enabled Activity-to-Factor Matching
- Low Quality Supplier Activity Data for Scope 3 Mapping
For complete list of drivers and restraints, kindly check the Table Of Contents.
Segment Analysis
Software held 78.41% of total revenue in 2025, which kept this part of the emissions factor library and carbon intelligence software market centered on platform subscriptions and enterprise software deployments. The software category remained dominant because most large buyers still prefer systems that can bring carbon data into finance, procurement, and supply chain workflows with stronger controls. In the carbon accounting software industry, software also benefits from higher switching costs once a platform is connected to ERP and reporting processes. This keeps the revenue base stable even as buyers ask for more implementation help and domain support.
Services are projected to grow at a 19.67% CAGR from 2026 to 2031, which makes it the fastest-moving component in the emissions factor library and carbon intelligence software market. Demand is rising because inventory design, assurance preparation, and methodology alignment are difficult for companies that lack trained in-house teams. The emissions factor library and carbon intelligence software market is, therefore, seeing more managed service models that combine access to software with advisory and support layers. That pattern was visible when Normative introduced Carbon Inventory Managed Services in 2026 and reported more than 1,000 hours of dedicated GHG Protocol-certified client support in the first 6 weeks. Over time, this should shift revenue mix toward bundled offerings without displacing the central role of software platforms.
Cloud-Based deployment held 69.94% of revenue in 2025, which reflected the SaaS-led structure of the emissions factor library and carbon intelligence software market and the need to process large volumes of activity data across sites and suppliers. Cloud systems remain attractive because they are easier to scale, update, and connect to external data flows used in disclosure and audit preparation. This is especially relevant in the emissions factor library and carbon intelligence software market, where reporting cycles are recurring, and data volumes are still rising. Buyers also continue to value the lower setup burden of cloud tools when compared with fully local implementations.
Hybrid deployment is expected to grow at an 18.83% CAGR from 2026 to 2031, and that growth reflects a more practical balance between scale and control. Multinational companies often need cloud-based analytics, but they also need to keep some data within local or existing enterprise environments because of internal policy or jurisdiction-specific data handling needs. The emissions factor library and carbon intelligence software market is responding with architectures that allow calculations, data custody, and reporting outputs to sit across more than one environment. Sweep's 2026 launch of an AWS-integrated cloud emissions measurement solution showed how vendors are trying to unify cloud data flows within traceable reporting structures. This should help hybrid deployments expand further as assurance and data lineage requirements become stricter.
Complete Report Scope:
- By Component
- Software
- Services
- By Deployment
- Cloud-Based
- On-Premises
- Hybrid
- By Application
- Carbon Accounting, Reporting, and Compliance
- Emissions Tracking and Monitoring
- Emissions Factor Library Management
- Sustainability Data Management
- Carbon Intelligence and Analytics
- By End User Industry
- Manufacturing
- Energy and Utilities
- Transportation and Logistics
- Banking, Financial Services, and Insurance (BFSI)
- Retail and Consumer Goods
- Healthcare and Life Sciences
- Information Technology and Telecommunications
- Government and Public Sector
- Other End User Industries
- By Geography
- North America
- United States
- Canada
- Mexico
- South America
- Brazil
- Argentina
- Chile
- Rest of South America
- Europe
- Germany
- United Kingdom
- France
- Italy
- Spain
- Rest of Europe
- Asia-pacific
- China
- Japan
- India
- Australia
- South Korea
- Singapore
- Rest of Asia-pacific
- Middle East
- Saudi Arabia
- United Arab Emirates
- Turkey
- Rest of Middle East
- Africa
- South Africa
- Egypt
- Nigeria
- Rest of Africa
- North America
Geography Analysis
North America held 36.44% revenue share in 2025, which made it the largest regional block in the emissions factor library and carbon intelligence software market. The region benefits from a high concentration of large enterprises that already run mature reporting, procurement, and finance systems, which makes platform integration easier. California's disclosure timetable is also reinforcing near-term buying urgency among companies that need structured Scope 1 and Scope 2 reporting in 2026, with Scope 3 requirements following after that. In the emissions factor library and carbon intelligence software market, this gives North America a strong mix of compliance demand and enterprise readiness.
Asia-Pacific is projected to grow at a 22.81% CAGR through 2031, which makes it the fastest-growing region in the emissions factor library and carbon intelligence software market. Growth is being supported by mandatory or phased disclosure moves in Japan, Australia, Singapore, South Korea, and China, which together widen the regional need for formal carbon data systems. The region also benefits from its role in global manufacturing supply chains because supplier-level emissions requests are moving deeper into Asia-Pacific production networks. This makes the emissions factor library and carbon intelligence software market relevant not only for large listed companies, but also for suppliers serving international customers with Scope 3 reporting needs. India is also adding momentum through its Business Responsibility and Sustainability Reporting framework, which is supporting more structured interest in GHG inventory tools.
Europe remained the second-largest regional market in 2025, with demand centered on large enterprises that face more advanced climate reporting expectations and assurance needs. Even with the narrowed CSRD scope in 2026, the remaining in-scope companies represent the more procurement-capable part of the buyer base, which supports continued enterprise-grade spending. South America remains an emerging opportunity, with adoption concentrated in extractive, agricultural, and consumer-facing sectors that are tied to multinational reporting expectations. The Middle East and Africa remain earlier-stage parts of the emissions factor library and carbon intelligence software market, with adoption driven more by national net-zero programs, multinational subsidiaries, and externally linked disclosure needs than by fully mature local demand.
- Salesforce, Inc.
- Workiva Inc.
- Persefoni AI, Inc.
- Watershed Technology, Inc.
- SAP SE
- IBM Corporation
- Microsoft Corporation
- ENGIE Impact
- Schneider Electric SE
- Sphera Solutions, Inc.
- Cority Software Inc.
- Normative AB
- Sweep SAS
- Position Green AB
- Greenly SAS
- Enablon North America Corporation
- Diligent Corporation
- IsoMetrix Software LLC
- Emitwise Ltd.
Additional Benefits:
- The market estimate (ME) sheet in Excel format
- 3 months of analyst support
TABLE OF CONTENTS
1 INTRODUCTION
- 1.1 Study Assumptions and Market Definition
- 1.2 Scope of the Study
2 RESEARCH METHODOLOGY
3 EXECUTIVE SUMMARY
4 MARKET LANDSCAPE
- 4.1 Market Overview
- 4.2 Market Drivers
- 4.2.1 Mandatory Climate Disclosure and Audit Readiness
- 4.2.2 Scope 3 Data Quality Pressure Across Supplier Networks
- 4.2.3 Emissions Factor Library Version Control and Traceability Demand
- 4.2.4 AI Enabled Activity to Factor Matching
- 4.2.5 Integration With ERP, Procurement, and FinOps Stacks
- 4.2.6 Granular Product and Facility Level Decarbonization Planning
- 4.3 Market Restraints
- 4.3.1 Fragmented and Inconsistent Emissions Factor Methodologies
- 4.3.2 Low Quality Supplier Activity Data for Scope 3 Mapping
- 4.3.3 High Implementation Burden for Midmarket Buyers
- 4.3.4 Limited Assured Factor Coverage for Niche Materials and Emerging Markets
- 4.4 Impact of Macroeconomic Factors on the Market
- 4.5 Industry Value-Chain Analysis
- 4.6 Regulatory Landscape
- 4.7 Technological Outlook
- 4.8 Porter's Five Forces Analysis
- 4.8.1 Bargaining Power of Buyers
- 4.8.2 Bargaining Power of Suppliers
- 4.8.3 Threat of New Entrants
- 4.8.4 Threat of Substitutes
- 4.8.5 Competitive Rivalry
5 MARKET SIZE AND GROWTH FORECASTS (VALUE)
- 5.1 By Component
- 5.1.1 Software
- 5.1.2 Services
- 5.2 By Deployment
- 5.2.1 Cloud-Based
- 5.2.2 On-Premises
- 5.2.3 Hybrid
- 5.3 By Application
- 5.3.1 Carbon Accounting, Reporting, and Compliance
- 5.3.2 Emissions Tracking and Monitoring
- 5.3.3 Emissions Factor Library Management
- 5.3.4 Sustainability Data Management
- 5.3.5 Carbon Intelligence and Analytics
- 5.4 By End User Industry
- 5.4.1 Manufacturing
- 5.4.2 Energy and Utilities
- 5.4.3 Transportation and Logistics
- 5.4.4 Banking, Financial Services, and Insurance (BFSI)
- 5.4.5 Retail and Consumer Goods
- 5.4.6 Healthcare and Life Sciences
- 5.4.7 Information Technology and Telecommunications
- 5.4.8 Government and Public Sector
- 5.4.9 Other End User Industries
- 5.5 By Geography
- 5.5.1 North America
- 5.5.1.1 United States
- 5.5.1.2 Canada
- 5.5.1.3 Mexico
- 5.5.2 South America
- 5.5.2.1 Brazil
- 5.5.2.2 Argentina
- 5.5.2.3 Chile
- 5.5.2.4 Rest of South America
- 5.5.3 Europe
- 5.5.3.1 Germany
- 5.5.3.2 United Kingdom
- 5.5.3.3 France
- 5.5.3.4 Italy
- 5.5.3.5 Spain
- 5.5.3.6 Rest of Europe
- 5.5.4 Asia-pacific
- 5.5.4.1 China
- 5.5.4.2 Japan
- 5.5.4.3 India
- 5.5.4.4 Australia
- 5.5.4.5 South Korea
- 5.5.4.6 Singapore
- 5.5.4.7 Rest of Asia-pacific
- 5.5.5 Middle East
- 5.5.5.1 Saudi Arabia
- 5.5.5.2 United Arab Emirates
- 5.5.5.3 Turkey
- 5.5.5.4 Rest of Middle East
- 5.5.6 Africa
- 5.5.6.1 South Africa
- 5.5.6.2 Egypt
- 5.5.6.3 Nigeria
- 5.5.6.4 Rest of Africa
- 5.5.1 North America
6 COMPETITIVE LANDSCAPE
- 6.1 Market Concentration
- 6.2 Strategic Moves
- 6.3 Market Share Analysis
- 6.4 Company Profiles (includes Global Level Overview, Market Level Overview, Core Segments, Financials as available, Strategic Information, Market Rank/Share, Products and Services, Recent Developments)
- 6.4.1 Salesforce, Inc.
- 6.4.2 Workiva Inc.
- 6.4.3 Persefoni AI, Inc.
- 6.4.4 Watershed Technology, Inc.
- 6.4.5 SAP SE
- 6.4.6 IBM Corporation
- 6.4.7 Microsoft Corporation
- 6.4.8 ENGIE Impact
- 6.4.9 Schneider Electric SE
- 6.4.10 Sphera Solutions, Inc.
- 6.4.11 Cority Software Inc.
- 6.4.12 Normative AB
- 6.4.13 Sweep SAS
- 6.4.14 Position Green AB
- 6.4.15 Greenly SAS
- 6.4.16 Enablon North America Corporation
- 6.4.17 Diligent Corporation
- 6.4.18 IsoMetrix Software LLC
- 6.4.19 Emitwise Ltd.
7 MARKET OPPORTUNITIES AND FUTURE OUTLOOK
- 7.1 White-Space and Unmet-Need Assessment

 IT維運人工智慧(AIOps)市場:按組件、部署類型、組織、應用、國家和地區分類-全球產業分析、市場規模、市場佔有率及2026年至2033年預測電力分配領域人工智慧市場:按組件、應用、部署方式、國家和地區分類-全球產業分析、市場規模及佔有率、未來預測(2026-2033)
 全球具身人工智慧市場:機會與策略展望(至2035年)
 深度科技市場規模、佔有率和成長分析:按核心技術、部署模式、企業規模、最終用戶領域和地區分類-2026-2033年產業預測
 人工智慧維運市場預測至2034年-按組件、部署模型、資料來源、應用、最終使用者和地區分類的全球分析人工智慧驅動的通訊服務自動化市場預測至2034年:按解決方案類型、部署模式、技術、應用、最終用戶和地區分類的全球分析人工智慧驅動的通訊資源管理市場預測至2034年:按組件、部署模式、技術、應用、最終用戶和地區分類的全球分析數位執行功能障礙管理市場預測至2034年-全球分析(按組件、功能、產品模式、目標受眾、最終用戶和區域分類)機器推理軟體市場預測至2034年—按軟體類型、部署模式、技術、應用、最終用戶和地區分類的全球分析聯邦機器智慧市場預測至2034年—按組件、部署模式、技術、應用、最終用戶和地區分類的全球分析