


 |
市場調查報告書
商品編碼
2073092
碳意識型應用程式介面 (API) 和軟體開發工具包 (SDK) 平台:市場佔有率分析、行業趨勢和統計數據以及成長預測 (2026-2031)Carbon-Aware Application Programming Interface (API) and Software Development Kit (SDK) Platform - Market Share Analysis, Industry Trends & Statistics, Growth Forecasts (2026 - 2031) |
||||||

※ 本網頁內容可能與最新版本有所差異。詳細情況請與我們聯繫。
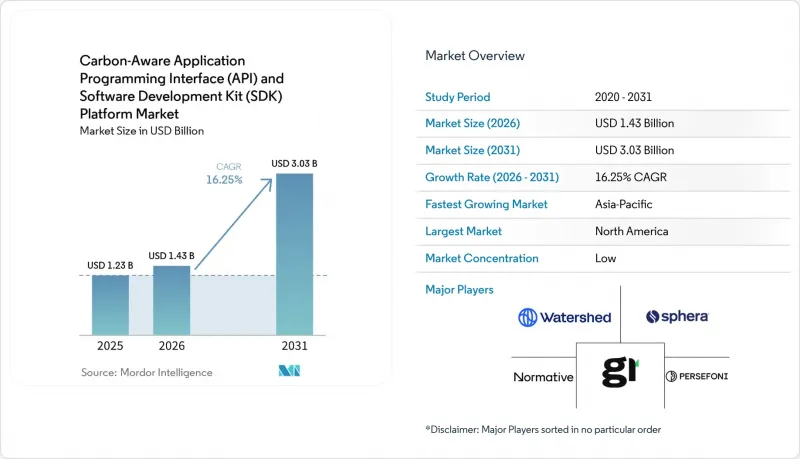
根據 Mordor Intelligence 預測,碳感知應用程式介面 (API) 和軟體開發工具包 (SDK) 平台的市場規模預計將在 2025 年達到 12.3 億美元,2026 年達到 14.3 億美元,到 2031 年達到 30.3 億美元,2026 年至 2031 年的複合年成長率為 16125 年。
本報告按組件(平台、服務)、應用程式(碳感知 Kubernetes 調度、其他)、部署類型(雲端、其他)、組織規模(大型企業、其他)、最終用戶(零售/電商、其他)和地區進行細分。市場預測以美元 (USD) 為單位。
全球碳感知應用程式介面 (API) 與軟體開發工具包 (SDK) 平台市場趨勢及洞察
提高碳排放資訊揭露要求,並允許進行審計。
在碳感知型應用程式介面 (API) 和軟體開發工具包 (SDK) 平台市場,最強勁的商業性驅動力是日益完善的資訊揭露框架,該框架要求提供更多可追溯的軟體排放資料。預計歐洲許多組織將在 2026 年提交首份 CSRD 報告,這一過程對符合保證要求的結構化、機器可讀的排放資訊提出了更高的要求。 「軟體碳強度」方法將軟體活動映射到一致的報告結構中,使買家能夠更清晰地要求供應商和內部工程團隊提供可比較的碳數據。這項轉變意義重大,因為當採購團隊尋求的是應用層級的證據而非寬泛的年度平均值時,手動估計值就大大降低了。因此,碳感知型 API 和 SDK 平台市場正逐漸成為企業(尤其是歐洲軟體銷售公司)的核心報告基礎設施。州級法規,例如加州的 SB 253 法案,與聯邦政策並行,進一步擴大了這些平台所涵蓋的合規範圍。
Carbon 對人工智慧和高效能運算 (HPC) 工作負載的可視化
碳感知型應用程式介面 (API) 和軟體開發工具包 (SDK) 平台市場也受到人工智慧基礎設施快速擴張以及更精確地衡量其營運碳足跡的需求的推動。預計到 2025 年,全球資料中心的電力消耗量將達到 448 太瓦時 (TWh),而目前預測到 2030 年將達到 945 太瓦時,因此碳視覺化仍然是基礎設施藍圖的關鍵要素。此外,能源需求結構正在發生變化,推理過程佔人工智慧總能耗的 80% 至 90%,測量挑戰如今已從模型訓練實驗室擴展到生產環境。綠色軟體基金會於 2025 年下半年批准了人工智慧碳強度指數 (SCI for AI),為開發人員提供了一種標準方法,用於評估 GPU 密集型工作負載中每次推理請求的碳強度。同行評審的研究表明,碳感知型 AI 調度可以將碳使用量減少高達 41%,同時將延遲增加控制在 1.1% 至 1.7% 以內。這削弱了「減少排放必然會導致性能顯著下降」的觀點。因此,在人工智慧營運堆疊中,碳感知型 API 和 SDK 平台的市場變得越來越重要,因為團隊既需要可見性也需要控制力。
不同供應商提供的碳訊號數據品質參差不齊。
由於不同碳訊號供應商和地區之間的資料品質存在差異,碳感知型應用程式介面 (API) 和軟體開發工具包 (SDK) 平台市場仍面臨巨大的推廣障礙。數據缺口在南亞和東南亞部分地區、撒哈拉以南非洲以及南美洲最為顯著,這些地區即時邊際排放數據有限或缺失,迫使買家依賴準確度較低的年度平均值作為替代數據。即使在成熟市場,平均排放強度與邊際排放排放之間的差異也會對電網調度產生重大影響,尤其是在可再生能源採用率較高的電網中。儘管 WattTime 和 REsurety 於 2025 年 3 月推出了免費的全球「電網排放數據」平台,提高了合格用戶獲取小時邊際數據的便利性,但受限地區的即時預測品質問題仍未解決。因此,買家在比較看似針對相同用例但基於不同基本假設的供應商時,仍面臨調查方法風險。這限制了碳意識 API 和 SDK 平台市場從定向部署轉變為更廣泛的企業標準化的速度。
細分市場分析
2025年,平台解決方案將佔據碳感知型應用程式介面(API)和軟體開發工具包(SDK)市場62.51%的佔有率,整合交付模式將成為企業早期採用的首選。買家青睞捆綁式平台,因為它們可以減少跨多個團隊管理API、規範碳訊號以及整合報告儀表板所需的工作量。這一趨勢在大型企業中尤其明顯,這些企業能夠以更快的價值實現和更低的整合負擔為代價,承擔更高的授權成本。早期採用者也傾向於技術成熟、擁有強大內部平台工程能力的客戶,例如超大規模資料中心業者、全球銀行和領先的科技公司。在此背景下,能夠提供託管式營運環境而非功能有限的單一工具的供應商在碳感知型API和SDK平台市場中更受青睞。
預計到2031年,服務市場將以18.15%的複合年成長率成長,這表明僅靠工具不足以滿足許多新買家的需求。下一批客戶將包括那些需要協助將符合ISO標準的軟體碳計量方法整合到其特定流程和營運計畫中的組織。 2026年1月,Amadeus將其營運碳計量引擎Carmen轉讓給了綠色軟體基金會。這表明,儘管取得核心計量工具變得越來越容易,但實施方面的專業知識仍然具有很高的商業性價值。因此,碳感知應用程式介面(API)和軟體開發工具包(SDK)平台產業正在向一種授權收入和服務收入相互補充而非相互競爭的模式轉變。
到 2025 年,碳強度 API 將佔碳感知應用程式介面 (API) 和軟體開發工具包 (SDK) 平台市場 54.23% 的佔有率,這反映了它們作為下游調度和報告工具的主要資料層的作用。這種地位是結構性的,而非暫時的,因為大多數其他應用類別在進行最佳化之前仍然依賴可靠的碳強度資料流。雖然碳感知 Kubernetes 調度和 CI/CD 工作流程整合已經是重要的用例,但由於雲端、叢集和軟體交付實踐中部署邏輯的差異,它們仍然各自獨立。因此,碳感知 API 和 SDK 平台市場仍然圍繞著支撐所有其他應用程式操作的資料層。與僅提供有限編配功能的供應商相比,擁有可靠訊號品質和強大標準化能力的供應商在買家決策中仍然佔據著更為重要的地位。
人工智慧和高效能運算 (HPC) 工作負載最佳化預計到 2031 年將以 17.31% 的複合年成長率成長,成為成長最快的應用領域。這一成長主要得益於人工智慧能源需求向即時推理的轉變,在即時推理中,調度決策可以在高頻生產工作負載上大規模迭代。綠色軟體基金會的人工智慧碳洞察指數 (SCI) 為這種用例提供了一個更正式的衡量框架,使企業團隊更容易證明其在工作負載級碳管理方面的投資是合理的。其他應用,例如邊緣調度和物聯網遙測,仍處於早期階段,但隨著碳數據在互聯系統和開發者工具中日益普及,它們也將從中受益。
區域分析
2025年,北美繼續保持其區域需求中心的地位,佔據碳意識API和SDK平台市場37.29%的佔有率。該地區受益於高密度超大規模基礎設施、大規模的雲端原生開發團體以及對碳意識開放原始碼工具的早期獲取。加州的SB 253和SB 261法案擴大了合規範圍,透過建立獨立於聯邦氣候法規的資訊揭露壓力,增強了合規性。儘管美國證券交易委員會(SEC)提案在2026年5月廢除氣候資訊揭露規則,但這項變更並未取消州級義務,也未能滿足那些在更嚴格的國際報告環境下繼續營運的公司的需求。雖然南美市場規模仍然較小,但巴西憑藉其大規模的IT產業和遵守歐洲報告標準的子公司,在短期內展現出最明顯的訊號。
儘管提交的文件中並未披露歐洲的區域佔有率數據,但歐洲仍然是碳感知應用程式介面 (API) 和軟體開發工具包 (SDK) 平台市場中最具活力的地區。 2026 年企業永續性報告指令 (CSRD) 的報告要求正在推動對應用層級軟體排放資料的需求,這些資料需要以更一致、更可審計的形式進行結構化。德國、英國和法國憑藉其成熟的企業報告體係以及大規模的開發者和雲端生態系,成為最大的國家級需求中心。中東地區仍處於起步階段,但沙烏地阿拉伯和阿拉伯聯合大公國政府主導的雲端專案正開始為資料中心和數位基礎設施規劃中的碳排放計量創造主導機會。
預計到2031年,亞太地區將以17.04%的複合年成長率成長,成為碳意識型應用程式介面(API)和軟體開發工具包(SDK)平台市場成長最快的地區。這一成長動能主要得益於日本不斷完善的軟體安全局(SSBJ)資訊揭露指南以及NTT於2026年3月發布的關於「從製造到處置的軟體生命週期」的二氧化碳排放規則。韓國正在引進一項新的政策支柱:強制大型上市公司提交ESG(環境、社會和治理)報告。同時,印度的成長更受到其出口導向IT服務產業的推動,而非國內法規的影響。中國正透過參與標準化和製定更廣泛的碳政策,為長遠發展奠定基礎。另一方面,非洲仍處於發展階段,需求集中在少數跨國企業相關業務領域。
其他好處
- Excel格式的市場預測(ME)表
- 3個月的分析師支持
目錄
第1章:引言
- 研究假設和市場定義
- 調查範圍
第2章:調查方法
第3章執行摘要
第4章 市場狀況
- 市場概覽
- 市場促進因素
- 加強碳排放資訊揭露要求,以便進行審計。
- 財務營運和碳成本的聯合最佳化
- 人工智慧和高效能運算工作負載中的碳排放可見性
- 在運行時調度中採用高碳排放 API
- 軟體碳指標和工具的標準化
- 將永續性管理融入工程工作流程
- 市場限制因素
- 不同供應商提供的碳訊號數據品質參差不齊。
- 跨雲端、DevOps 和應用程式堆疊整合帶來的負擔
- 主動式碳排放意識調度中的效能權衡
- 買家尚未做好充分準備,為開發商實施碳排放工作流程。
- 產業價值鏈分析
- 監理情勢
- 技術展望
- 宏觀經濟因素對市場的影響
- 波特五力分析
第5章 市場規模與成長預測
- 按組件
- 平台
- 服務
- 實施整合服務
- 支援和維護服務
- 透過使用
- 碳感知 Kubernetes 調度
- 碳密集型 API
- 人工智慧和高效能運算工作負載最佳化
- 持續整合 (CI) / 持續交付 (CD) 和開發人員工作流程整合
- 其他
- 按實現類型
- 基於雲端的
- 現場
- 混合
- 按組織規模
- 大公司
- 小型企業
- 最終用戶
- IT/通訊
- 銀行業、金融服務業及保險業
- 能源與公共產業
- 製造業
- 零售與電子商務
- 醫療保健和生命科學
- 其他
- 按地區
- 北美洲
- 美國
- 加拿大
- 墨西哥
- 南美洲
- 巴西
- 阿根廷
- 其他南美國家
- 歐洲
- 德國
- 英國
- 法國
- 義大利
- 西班牙
- 俄羅斯
- 其他歐洲國家
- 亞太地區
- 中國
- 印度
- 日本
- 韓國
- 澳洲
- 其他亞太國家
- 中東
- 沙烏地阿拉伯
- 阿拉伯聯合大公國
- 土耳其
- 其他中東國家
- 非洲
- 南非
- 奈及利亞
- 其他非洲地區
- 北美洲
第6章 競爭情勢
- 市場集中度
- 策略趨勢
- 市佔率分析
- 公司簡介
- Watershed Technology, Inc.
- Persefoni AI, Inc.
- Normative AB
- Plan A Earth GmbH
- Sweep SAS
- Greenly SAS
- Emitwise Limited
- Asuene Inc.
- 51toCarbonZero Limited
- Key ESG Limited
- FigBytes Inc.
- Novisto Inc.
- Sphera Solutions, Inc.
- Measurabl, Inc.
- Sinai Technologies, Inc.
- CarbonTrail Ltd.
- Brightest GmbH
- Unravel Carbon Pte. Ltd.
- Climatiq GmbH
- CarbonChain Ltd.
第7章 市場機會與未來展望
According to Mordor Intelligence, the carbon-aware application programming interface (API) and software development kit (SDK) platform market size is projected to be USD 1.23 billion in 2025, USD 1.43 billion in 2026, and reach USD 3.03 billion by 2031, growing at a CAGR of 16.25% from 2026 to 2031.
This report is Segmented by Component (Platform, and Services), Application (Carbon-Aware Kubernetes Scheduling, and More), Deployment Mode (Cloud-Based, and More), Organization Size (Large Enterprises, and More), End User (Retail and E-Commerce, and More), and Geography. The Market Forecasts are Provided in Terms of Value (USD).
Global Carbon-Aware Application Programming Interface (API) and Software Development Kit (SDK) Platform Market Trends and Insights
Increasing Audit-Ready Carbon Disclosure Requirements
The carbon-aware application programming interface (API) and software development kit (SDK) platform market is seeing its strongest commercial pull from mandatory disclosure frameworks that now require more traceable software emissions data. In 2026, many organizations across Europe are filing their first CSRD reports, and this process is raising pressure for structured, machine-readable emissions information that meets assurance requirements. The Software Carbon Intensity method maps software activity into a consistent reporting structure, which gives buyers a clearer way to request comparable carbon data from vendors and internal engineering teams. That shift matters because manual estimates are less useful when procurement teams seek application-level evidence rather than broad annual averages. The carbon-aware API and SDK platform market is therefore moving closer to core enterprise reporting infrastructure, especially for companies that sell software into Europe. State-level obligations, such as California SB 253, are adding a parallel reporting stream outside federal policy, which further broadens the compliance base addressed by these platforms.
AI and High-Performance Compute Workload Carbon Visibility
The carbon-aware application programming interface (API) and software development kit (SDK) platform market is also being driven by the rapid expansion of AI infrastructure and the need to measure its operating footprint with greater precision. Worldwide data center electricity use reached 448TWh in 2025, and current projections point to 945TWh by 2030, which keeps carbon visibility high on infrastructure roadmaps. The mix of energy demand is also changing because inference accounts for 80-90% of total AI energy consumption, so the measurement problem now sits in live production environments rather than only in model training labs. The Green Software Foundation ratified SCI for AI in late 2025, providing developers with a standard way to evaluate per-inference-request carbon intensity across GPU-heavy workloads. Peer-reviewed research also showed that carbon-aware AI scheduling can cut carbon use by up to 41% while keeping latency increases within 1.1-1.7%, which weakens the argument that lower emissions must come with a material performance penalty. As a result, the carbon-aware API and SDK platform market is gaining greater prominence in AI operations stacks where teams need both visibility and control.
Fragmented Carbon Signal Data Quality across Providers
The carbon-aware application programming interface (API) and software development kit (SDK) platform market still faces a major deployment barrier due to uneven data quality across carbon signal providers and regions. Coverage gaps are most visible in parts of South and Southeast Asia, Sub-Saharan Africa, and South America, where real-time marginal emissions data are limited or absent, forcing buyers to fall back on weaker annual-average proxies. Even in mature markets, the difference between average and marginal emissions intensity can lead to materially different scheduling decisions, especially in grids with high renewable penetration. WattTime and REsurety launched a free global Grid Emissions Data platform in March 2025, which improved access to hourly marginal data for qualified users but did not fully address real-time forecast quality in constrained regions. Buyers are therefore still exposed to methodology risk when they compare vendors that appear to address the same use case but differ in their underlying assumptions. This limits the pace at which the carbon-aware API and SDK platform market can move from targeted deployments to broader enterprise standardization.
Other drivers and restraints analyzed in the detailed report include:
- FinOps and Carbon Cost Co-Optimization
- Carbon Intensity API Adoption for Runtime Scheduling
- Integration Burden Across Cloud, DevOps, and Application Stacks
For complete list of drivers and restraints, kindly check the Table Of Contents.
Segment Analysis
Platform solutions held 62.51% of the carbon-aware application programming interface (API) and software development kit (SDK) market in 2025, making the integrated delivery model the preferred choice for early enterprise adoption. Buyers favored bundled platforms because they reduce the work needed to connect API management, carbon signal normalization, and reporting dashboards across multiple teams. This preference was strongest among large organizations that could justify higher license costs in exchange for faster time-to-value and lower integration effort. Early adoption also leaned toward technically mature customers, such as hyperscalers, global banks, and large technology firms, that already had strong internal platform engineering capabilities. In that context, the carbon-aware API and SDK platform market rewarded vendors that could deliver a managed operating environment rather than a narrow point tool.
Services are projected to expand at a 18.15% CAGR through 2031, indicating that tooling alone is not enough for many new buyers. The next wave of customers includes organizations that need help translating ISO-compliant software carbon methods into client-specific pipelines and operating policies. Amadeus transferred Carmen, its production-grade carbon measurement engine, to the Green Software Foundation in January 2026, which signals that core measurement tooling is becoming easier to access while implementation expertise remains commercially valuable. The carbon-aware application programming interface (API) and software development kit (SDK) platform industry is therefore moving toward a model where license revenue and services revenue reinforce each other rather than compete.
Carbon intensity APIs accounted for 54.23% of the carbon-aware application programming interface (API) and software development kit (SDK) platform market in 2025, reflecting their role as the primary data layer for downstream scheduling and reporting tools. This position is structural rather than temporary because most other application categories still depend on a reliable stream of carbon-intensity data before any optimization can happen. Carbon-aware Kubernetes scheduling and CI/CD workflow integration are already meaningful use cases, but they remain more fragmented because deployment logic changes across clouds, clusters, and software delivery practices. The carbon-aware API and SDK platform market, therefore, continues to center on the data layer that feeds all other application behavior. Vendors with dependable signal quality and strong normalization capabilities remain closer to the center of buyer decision-making than those that offer only narrower orchestration features.
AI and high-performance computing workload optimization is projected to grow at a 17.31% CAGR through 2031, making it the fastest-growing application area. That growth follows the shift in AI energy demand toward live inference, where scheduling decisions can be repeated at scale across high-frequency production workloads. The Green Software Foundation's SCI for AI work provides a more formal measurement framework for that use case, making it easier for enterprise teams to justify investment in workload-level carbon controls. Other applications, such as edge scheduling and IoT telemetry, remain early, but they benefit as carbon data becomes more ambient across connected systems and developer tools.
Complete Report Scope:
- By Component
- Platform
- Services
- Implementation and Integration Services
- Support and Maintenance Services
- By Application
- Carbon-Aware Kubernetes Scheduling
- Carbon Intensity APIs
- AI and High-Performance Computing Workload Optimization
- Continuous Integration (CI)/Continuous Delivery (CD) and Developer Workflow Integration
- Other Applications
- By Deployment Mode
- Cloud-Based
- On-Premises
- Hybrid
- By Organization Size
- Large Enterprises
- Small and Medium Enterprises
- By End User
- Information Technology and Telecom
- Banking, Financial Services, and Insurance
- Energy and Utilities
- Manufacturing
- Retail and E-Commerce
- Healthcare and Life Sciences
- Other End Users
- By Geography
- North America
- United States
- Canada
- Mexico
- South America
- Brazil
- Argentina
- Rest of South America
- Europe
- Germany
- United Kingdom
- France
- Italy
- Spain
- Russia
- Rest of Europe
- Asia-Pacific
- China
- India
- Japan
- South Korea
- Australia
- Rest of Asia-Pacific
- Middle East
- Saudi Arabia
- United Arab Emirates
- Turkey
- Rest of Middle East
- Africa
- South Africa
- Nigeria
- Rest of Africa
- North America
Geography Analysis
North America held 37.29% of the carbon-aware API and SDK platform market share in 2025, maintaining its position as the leading regional demand center. The region benefits from dense hyperscale infrastructure, large cloud-native developer communities, and early exposure to carbon-aware open-source tooling. California SB 253 and SB 261 broadened the compliance base by creating disclosure pressure that does not depend on federal climate rule continuity. The SEC proposed rescinding its climate disclosure rules in May 2026, but that change did not remove state-level obligations or address the needs of companies that still operate in stricter overseas reporting environments. South America remained smaller, with Brazil providing the clearest near-term signal through its large IT sector and through subsidiaries tied to European reporting expectations.
Europe did not have a disclosed regional share figure in the input, yet it remained the most policy-dense part of the carbon-aware application programming interface (API) and software development kit (SDK) platform market. CSRD reporting in 2026 is increasing demand for application-level software emissions data that can be structured in a more consistent and auditable form. Germany, the United Kingdom, and France stood out as the largest national demand centers because they combine strong enterprise reporting maturity with large developer and cloud ecosystems. The Middle East is still early, but sovereign cloud programs in Saudi Arabia and the UAE are beginning to create a policy-led opening for carbon measurement in data center and digital infrastructure planning.
Asia-Pacific is projected to grow at a 17.04% CAGR through 2031, making it the fastest-growing regional market for the carbon-aware application programming interface and software development kit platform market. Japan is shaping much of that momentum through its evolving SSBJ disclosure guidance and NTT's March 2026 publication of CO2 rules for the cradle-to-grave software lifecycle. South Korea adds another policy anchor with mandatory ESG reporting for large listed companies, while India's growth is led more by export-oriented IT services exposure than by domestic regulation. China is building a longer-term pathway through standards participation and broader carbon policy development, while Africa remains nascent, with demand concentrated in a small number of multinational-linked operations.
- Watershed Technology, Inc.
- Persefoni AI, Inc.
- Normative AB
- Plan A Earth GmbH
- Sweep SAS
- Greenly SAS
- Emitwise Limited
- Asuene Inc.
- 51toCarbonZero Limited
- Key ESG Limited
- FigBytes Inc.
- Novisto Inc.
- Sphera Solutions, Inc.
- Measurabl, Inc.
- Sinai Technologies, Inc.
- CarbonTrail Ltd.
- Brightest GmbH
- Unravel Carbon Pte. Ltd.
- Climatiq GmbH
- CarbonChain Ltd.
Additional Benefits:
- The market estimate (ME) sheet in Excel format
- 3 months of analyst support
TABLE OF CONTENTS
1 INTRODUCTION
- 1.1 Study Assumptions and Market Definition
- 1.2 Scope of the Study
2 RESEARCH METHODOLOGY
3 EXECUTIVE SUMMARY
4 MARKET LANDSCAPE
- 4.1 Market Overview
- 4.2 Market Drivers
- 4.2.1 Increasing Audit-Ready Carbon Disclosure Requirements
- 4.2.2 FinOps and Carbon Cost Co-Optimization
- 4.2.3 AI and High-Performance Compute Workload Carbon Visibility
- 4.2.4 Carbon Intensity API Adoption For Runtime Scheduling
- 4.2.5 Standardization of Software Carbon Metrics and Tooling
- 4.2.6 Embedded Sustainability Controls In Engineering Workflows
- 4.3 Market Restraints
- 4.3.1 Fragmented Carbon Signal Data Quality Across Providers
- 4.3.2 Integration Burden Across Cloud, DevOps, and Application Stacks
- 4.3.3 Performance Tradeoffs in Aggressive Carbon-Aware Scheduling
- 4.3.4 Limited Buyer Readiness to Operationalize Developer-Facing Carbon Workflows
- 4.4 Industry Value Chain Analysis
- 4.5 Regulatory Landscape
- 4.6 Technological Outlook
- 4.7 Impact of Macroeconomic Factors on the Market
- 4.8 Porter's Five Forces Analysis
- 4.8.1 Threat of New Entrants
- 4.8.2 Bargaining Power of Suppliers
- 4.8.3 Bargaining Power of Buyers
- 4.8.4 Threat of Substitutes
- 4.8.5 Intensity of Competitive Rivalry
5 MARKET SIZE AND GROWTH FORECASTS (VALUE)
- 5.1 By Component
- 5.1.1 Platform
- 5.1.2 Services
- 5.1.2.1 Implementation and Integration Services
- 5.1.2.2 Support and Maintenance Services
- 5.2 By Application
- 5.2.1 Carbon-Aware Kubernetes Scheduling
- 5.2.2 Carbon Intensity APIs
- 5.2.3 AI and High-Performance Computing Workload Optimization
- 5.2.4 Continuous Integration (CI)/Continuous Delivery (CD) and Developer Workflow Integration
- 5.2.5 Other Applications
- 5.3 By Deployment Mode
- 5.3.1 Cloud-Based
- 5.3.2 On-Premises
- 5.3.3 Hybrid
- 5.4 By Organization Size
- 5.4.1 Large Enterprises
- 5.4.2 Small and Medium Enterprises
- 5.5 By End User
- 5.5.1 Information Technology and Telecom
- 5.5.2 Banking, Financial Services, and Insurance
- 5.5.3 Energy and Utilities
- 5.5.4 Manufacturing
- 5.5.5 Retail and E-Commerce
- 5.5.6 Healthcare and Life Sciences
- 5.5.7 Other End Users
- 5.6 By Geography
- 5.6.1 North America
- 5.6.1.1 United States
- 5.6.1.2 Canada
- 5.6.1.3 Mexico
- 5.6.2 South America
- 5.6.2.1 Brazil
- 5.6.2.2 Argentina
- 5.6.2.3 Rest of South America
- 5.6.3 Europe
- 5.6.3.1 Germany
- 5.6.3.2 United Kingdom
- 5.6.3.3 France
- 5.6.3.4 Italy
- 5.6.3.5 Spain
- 5.6.3.6 Russia
- 5.6.3.7 Rest of Europe
- 5.6.4 Asia-Pacific
- 5.6.4.1 China
- 5.6.4.2 India
- 5.6.4.3 Japan
- 5.6.4.4 South Korea
- 5.6.4.5 Australia
- 5.6.4.6 Rest of Asia-Pacific
- 5.6.5 Middle East
- 5.6.5.1 Saudi Arabia
- 5.6.5.2 United Arab Emirates
- 5.6.5.3 Turkey
- 5.6.5.4 Rest of Middle East
- 5.6.6 Africa
- 5.6.6.1 South Africa
- 5.6.6.2 Nigeria
- 5.6.6.3 Rest of Africa
- 5.6.1 North America
6 COMPETITIVE LANDSCAPE
- 6.1 Market Concentration
- 6.2 Strategic Moves
- 6.3 Market Share Analysis
- 6.4 Company Profiles (includes Global Level Overview, Market Level Overview, Core Segments, Financials as available, Strategic Information, Market Rank/Share, Products and Services, Recent Developments)
- 6.4.1 Watershed Technology, Inc.
- 6.4.2 Persefoni AI, Inc.
- 6.4.3 Normative AB
- 6.4.4 Plan A Earth GmbH
- 6.4.5 Sweep SAS
- 6.4.6 Greenly SAS
- 6.4.7 Emitwise Limited
- 6.4.8 Asuene Inc.
- 6.4.9 51toCarbonZero Limited
- 6.4.10 Key ESG Limited
- 6.4.11 FigBytes Inc.
- 6.4.12 Novisto Inc.
- 6.4.13 Sphera Solutions, Inc.
- 6.4.14 Measurabl, Inc.
- 6.4.15 Sinai Technologies, Inc.
- 6.4.16 CarbonTrail Ltd.
- 6.4.17 Brightest GmbH
- 6.4.18 Unravel Carbon Pte. Ltd.
- 6.4.19 Climatiq GmbH
- 6.4.20 CarbonChain Ltd.
7 MARKET OPPORTUNITIES AND FUTURE OUTLOOK
- 7.1 White-Space and Unmet-Need Assessment

 歐洲 SOCaaS(安全營運中心即服務):市場佔有率分析、產業趨勢與統計資料、成長預測(2026-2031 年)
 應用程式管理服務市場:按服務、部署模式、應用程式和最終用戶產業分類-2026-2032年全球市場預測
 EMEA電子製造服務業(2024-2029):歐洲、中東和北非(EMEA)EMS產業策略調查(第23版)
 AI合規SaaS市場:按組件、部署類型、應用、產業、國家及地區分類-產業分析、市場規模、市場佔有率及2026年至2033年預測
 2026年全球基於應用程式介面(API)的薪資核算技術市場報告2026年全球應用程式介面(API)經濟市場報告2026年基於SaaS(軟體即服務)的人力資源管理(HRM)全球市場報告2026年全球應用程式介面(API)即服務市場報告
 2026-2030年全球應用管理服務市場2026年全球應用管理服務市場報告