


 |
市場調查報告書
商品編碼
2073000
IT資產生命週期軟體中的隱含碳排放:市場佔有率分析、產業趨勢與統計數據、成長預測(2026-2031年)Embodied Carbon IT Asset Lifecycle Software - Market Share Analysis, Industry Trends & Statistics, Growth Forecasts (2026 - 2031) |
||||||

※ 本網頁內容可能與最新版本有所差異。詳細情況請與我們聯繫。
據 Mordor Intelligence 稱,2025 年隱含碳 IT 資產生命週期軟體市場價值為 6.5 億美元,預計到 2031 年將達到 23.3 億美元,2026 年至 2031 年的複合年成長率為 24.15%。
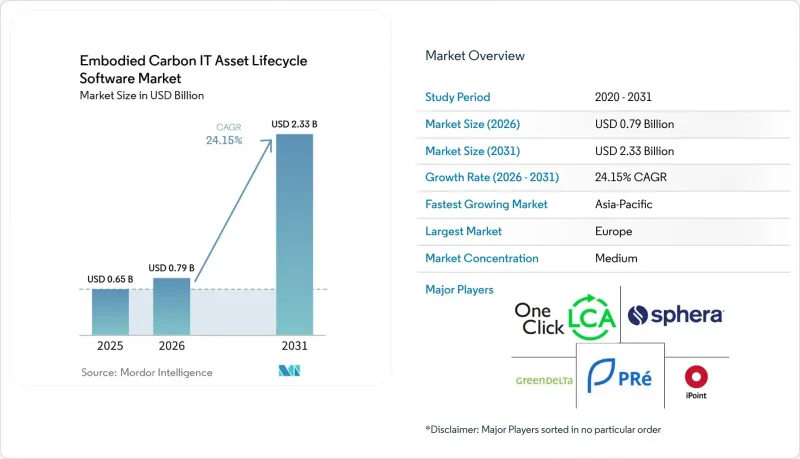
本報告按組件(軟體和服務)、部署模式(雲端和本地部署)、企業規模(大型企業和中小企業)、應用(嵌入式碳排放計算等)、最終用戶(IT和電信、銀行、金融服務和保險、工業製造等)以及地區進行細分。市場預測以美元計價。
全球嵌入式碳IT資產生命週期軟體市場趨勢與洞察
嚴格的範圍 3 和 IT 永續性揭露要求正在推動平台需求。
監管壓力正促使IT硬體的碳排放數據納入正式的報告週期。 ESRS E1將購買的商品和服務整合到結構化的氣候揭露框架中,這意味著與設備相關的排放不再能被視為概括性匯總中的偶然估計值。德國的CSRD實施進程也加劇了大型企業為2025會計年度相關報告做好準備的必要性,促使合規工作轉向積極的預算編制和系統規劃階段。這項轉變意義重大,因為IT資產生命週期內隱含碳量的軟體市場不僅受品牌目標驅動,也受審計預期驅動。隨著財務、永續發展和內部控制團隊同時參與揭露審查,實施能夠連接採購記錄、資產數據和排放計算邏輯的軟體的必要性也日益凸顯。類似的合規壓力也延伸至供應商網路,即使直接硬體採購模式保持不變,也要求報告實體在上游工程收集更可靠的數據。
IT 採購中對可供審計的隱含碳資料的需求日益成長,進一步加深了對資料來源追蹤的需求。
採購團隊在評估IT採購時,面臨越來越大的壓力,需要使用產品級的碳排放數據,而不是粗略的估算值。聯想利用Makersite平台,在2025年實現了ThinkPad配置級產品碳足跡的發布,這表明OEM廠商的透明度正在成為企業採購談判中一項切實可行的差異化因素。這一轉變意義重大,因為買家不再僅僅需要數字;他們需要的是能夠追溯到特定產品配置且供應商之間通用認可的數字。因此,用於管理IT資產生命週期內隱含碳量的軟體市場正在從簡單的報告儀錶板轉向能夠攝取、標準化和比較來自多個OEM廠商的原始數據的平台。這也提升了能夠跨採購週期、設備更新和資訊揭露期間保持記錄一致性的軟體的價值。能夠處理供應商數據差異而不影響報告品質的供應商將吸引更多企業的注意。
不同原始設備製造商和設備類別中嵌入碳係數的差異限制了數據的可靠性。
數據品質仍然參差不齊,因為並非所有硬體製造商和設備類別都以相同詳細程度發布其產品的碳排放資訊。聯想在配置級碳足跡方面的努力就是一個提高透明度的例子,但這種詳細程度尚未在整個供應鏈中實現標準化。儘管 Ecoinvent 擁有目前最大的生命週期清單資料庫之一,但沒有任何資料集能夠完全涵蓋企業 IT 資產中部署的所有新型特定硬體配置。這意味著許多平台仍然需要結合供應商特定數值、模型假設和二次係數來計算。當企業比較不同品牌、外形規格和更新週期的 IT 資產時,這可能會影響結果的一致性。市場對用於計算 IT 資產整個生命週期內隱含碳排放的軟體需求仍然強勁,但上游數據的異質性是影響可靠性和部署速度的真正瓶頸。
細分市場分析
至2025年,軟體將佔IT資產生命週期軟體市場(涵蓋隱含碳排放)的69.74%,確立其在該領域的核心地位。這個市場定位反映了大多數買家首先需要在單一、可配置的系統中收集設備資訊、應用排放計算邏輯並產生一致的輸出結果。企業最初關注的問題通常是資料收集和報告的可重複性,因此在服務支出規模擴大之前,軟體在早期階段自然佔據優先地位。此外,由於自動化減少了許多內部團隊難以在多個報告週期內維護的手動碳會計任務,隱含碳IT資產生命週期軟體市場仍以軟體主導。成熟的生命週期和碳平台憑藉其成熟的資料結構進入市場,而新供應商則專注於使這些流程更快、更易於擴展。
這一領先地位並不意味著服務的重要性為遜色,因為預計到2031年,服務市場將以24.65%的複合年成長率成長。許多買家仍需要資料準備、調查方法選擇、系統映射以及永續發展團隊與IT維運部門之間的交接的協助。當企業希望快速獲得可執行的成果,但內部尚不具備足夠的生命週期評估(LCA)或碳會計能力時,對服務的需求會更大。 Sphera提供的託管LCA內容,每年擁有超過20,000個資料集(每年更新並經第三方檢驗),清晰地展示了為什麼在複雜的部署中,內容和實施支援通常以打包形式出售。從長遠來看,軟體產業(負責計算IT資產生命週期內的隱含碳排放)預計仍將主要由軟體收入驅動,而服務業將在整合、品管和持續的模型管治獲得更大的價值。
到2025年,雲端採用將佔嵌入式碳IT資產生命週期軟體市場66.12%的佔有率,在交付模式中佔據絕對領先地位。這一趨勢有其實際原因:雲端交付能夠實現快速部署、輕鬆更新,並減輕永續發展團隊的基礎設施負擔,而這些團隊通常無需管理大規模的內部軟體環境。雲端交付也適用於需要頻繁更新來自因子庫、供應商記錄和企業系統資料的平台。在這些平台上,定期更新的生命週期清單內容至關重要,而像ecoinvent這樣的大型資料庫則凸顯了集中式更新而非孤立的本地副本的價值。 IT資產生命週期中的嵌入式碳量管理軟體市場仍然以雲端為導向,這主要受買家在部署初期對速度、柔軟性和簡化維護的需求所驅動。
混合部署預計到2031年將以25.02%的複合年成長率成長,成為成長最快的部署模式。這一趨勢反映了受監管組織的需求,他們仍然希望對遙測資料、庫存細節或內部記錄進行更嚴格的控制,同時又需要基於雲端的建模功能。對於那些已經運行成熟的本地管治系統且不希望一次將所有相關資料遷移到共用環境的公司而言,混合配置也極具吸引力。 ISO/IEC TS 19770-13:2026 標準支援此方向,建議將永續性資訊結構化地整合到現有的IT資產管理(ITAM)系統中,而不是採用統一的架構。雖然對於軟體更換週期較長的組織而言,本地部署仍然至關重要,但隱含碳IT資產生命週期軟體市場顯然正在轉向結合雲端的柔軟性和對敏感資料更嚴格控制的模式。
區域分析
2025年,歐洲持續保持領先地位,在隱含碳IT資產生命週期軟體市場佔據34.56%的市佔率。德國、英國和法國憑藉其大規模的企業基礎、更高的報告要求和成熟的永續發展流程,仍然是關鍵的需求中心。尤其值得一提的是德國,隨著企業推動其企業永續性報告指令(CSRD)的實施計畫和準備工作,對採購商品和服務的系統化報告流程的需求日益成長,德國市場顯得尤為重要。 BITKOM發布的2025年指南也反映出,該地區的技術和軟體公司已將資源效率與採購和生命週期規劃結合。
預計到2031年,亞太地區將以25.45%的複合年成長率成長,成為IT資產生命週期軟體市場中隱含碳排放數據成長最快的地區。隨著主要經濟體資訊揭露實務的擴展,以及企業採購負責人對區域硬體供應商更高品質資料的需求,該地區正進入加速採用新資料的階段。日本、澳洲、印度、新加坡、中國和韓國都在推動這一趨勢,上市公司和大型企業在報告活動和氣候相關管治正日益制度化。另一個因素是該地區在硬體製造領域的重要地位,這往往導致供應商和買家同時面臨更大的壓力。因此,不僅報告實體需要更準確的碳排放數據,原始設備製造商(OEM)和零件供應商也需要更準確的數據來支援其全球客戶關係,從而產生需求。
到2025年,北美將在隱含碳IT資產生命週期軟體市場佔據第二大區域佔有率。美國仍將保持其核心地位,這得益於其眾多資金雄厚的供應商以及大量已實施系統性永續發展項目的企業。該地區的需求正向上游轉移,從資訊揭露結果轉向採購階段的評分、向供應商索取資料以及硬體升級決策。雖然南美洲的採用仍處於起步階段,但各地區的情況有所不同,中東和非洲地區,阿拉伯聯合大公國、沙烏地阿拉伯和南非的進展比該地區其他國家更為活躍。
其他好處:
- Excel格式的市場預測(ME)表
- 3個月的分析師支持
目錄
第1章:引言
- 研究假設和市場定義
- 調查範圍
第2章:調查方法
第3章執行摘要
第4章 市場狀況
- 市場概覽
- 市場促進因素
- 嚴格的範圍 3 和 IT 永續性揭露要求
- IT採購中對可用於審計的隱含碳資料的需求日益成長。
- 擴大循環IT實務、再利用和生命週期延長計畫。
- IT資產管理、ESG報告和FinOps工作流程的整合。
- 透過 API 和資料庫擴展設備級 LCA 資料的使用。
- 企業越來越關注其整個 IT 設備產品組合中的產品級碳排放。
- 市場限制因素
- 嵌入式碳係數因原始設備製造商和設備類別而異。
- ITAM、ERP、ESG 和採購系統整合的複雜性。
- 資產遙測相關的安全、隱私和資料管治問題
- IT資產碳計量調查方法標準化進程滯後
- 產業價值鏈分析
- 監理情勢
- 技術展望
- 波特五力分析
第5章 市場規模與成長預測
- 按組件
- 軟體
- 服務
- 部署模式
- 基於雲端的
- 現場
- 按公司規模
- 大公司
- 小型企業
- 透過使用
- 壓花碳的計算
- IT資產生命週期最佳化
- 循環使用和再利用規劃
- 合規與報告
- 最終用戶
- 資訊科技/通訊
- BFSI
- 工業製造
- 能源公用事業
- 石油和天然氣
- 零售與電子商務
- 建築和基礎設施
- 政府/公共部門
- 其他最終用戶
- 按地區
- 北美洲
- 美國
- 加拿大
- 墨西哥
- 南美洲
- 巴西
- 阿根廷
- 其他南美國家
- 歐洲
- 德國
- 英國
- 法國
- 義大利
- 西班牙
- 俄羅斯
- 其他歐洲國家
- 亞太地區
- 中國
- 印度
- 日本
- 韓國
- 澳洲
- 其他亞太國家
- 中東和非洲
- 中東
- 沙烏地阿拉伯
- 阿拉伯聯合大公國
- 土耳其
- 其他中東國家
- 非洲
- 南非
- 埃及
- 其他非洲國家
- 中東
- 北美洲
第6章 競爭情勢
- 市場集中度
- 策略趨勢
- 市佔率分析
- 公司簡介
- One Click LCA Ltd
- PRe Sustainability BV
- Sphera Solutions, Inc.
- GreenDelta GmbH
- iPoint-systems GmbH
- Makersite GmbH
- Ecochain Technologies BV
- Plan A Technologies GmbH
- Greenly SAS
- Normative AB
- Persefoni AI, Inc.
- Watershed Technology, Inc.
- Sweep SAS
- Dcycle, SL
- Sinai Technologies, Inc.
- Emitwise Limited
- Measurabl, Inc.
- Deepki SAS
- OpenLCA GmbH
- FigBytes Inc.
第7章 市場機會與未來展望
According to Mordor Intelligence, the embodied carbon IT asset lifecycle software market size was valued at USD 0.65 billion in 2025 and is forecast to reach USD 2.33 billion by 2031, expanding at a CAGR of 24.15% during 2026-2031.
This report is Segmented by Component (Software, and Services), Deployment Mode (Cloud-Based, and On-Premises), Enterprise Size (Large Enterprises, and Small and Medium Enterprises), Application (Embodied Carbon Accounting, and More), End User (IT and Telecom, BFSI, Industrial Manufacturing, and More), and Geography. The Market Forecasts are Provided in Terms of Value (USD).
Global Embodied Carbon IT Asset Lifecycle Software Market Trends and Insights
Stringent Scope 3 and IT Sustainability Disclosure Requirements Drive Platform Demand
Regulatory pressure is pushing carbon data for IT hardware into formal reporting cycles. ESRS E1 places purchased goods and services inside a structured climate disclosure framework, which means device-related emissions can no longer be handled as a side estimate inside broad sustainability summaries. Germany's CSRD implementation process also reinforced the need for large enterprises to prepare for reporting tied to fiscal year 2025, which moved compliance work into active budget and systems planning. This change matters because the embodied carbon IT asset lifecycle software market is being pulled by audit expectations rather than by branding goals alone. Software that connects procurement records, asset data, and emissions logic is becoming easier to justify when disclosure reviews involve finance, sustainability, and internal controls teams simultaneously. The same compliance pressure also extends to supplier networks, meaning reporting entities often need stronger upstream data collection even when their direct hardware purchasing patterns have not changed.
Rising Demand for Audit-Ready Embodied Carbon Data in IT Procurement Deepens Data Provenance Needs
Procurement teams are under growing pressure to use product-level carbon data instead of broad proxy values when they assess IT purchases. Lenovo's 2025 rollout of configuration-level product carbon footprints for ThinkPad, built with Makersite, showed that OEM transparency is becoming a practical differentiator in enterprise buying conversations. That shift matters because buyers do not just need a number; they need one that can be traced back to a specific product setup and understood across suppliers. As a result, the embodied carbon IT asset lifecycle software market is moving away from simple reporting dashboards and toward platforms that can ingest, normalize, and compare primary data from several OEM sources. This also increases the value of software that can maintain consistent records across purchasing cycles, device refreshes, and disclosure periods. Vendors that can handle supplier data variation without breaking reporting quality are likely to gain more enterprise attention.
Fragmented Embodied Carbon Factors Across OEMs And Device Classes Limit Data Fidelity
Data quality remains uneven because product carbon information is still not published with the same depth across all hardware makers and device categories. Lenovo's configuration-level footprint work is one example of stronger transparency, but that level of detail is not yet standard across the full supply base. Ecoinvent offers one of the largest lifecycle inventory bases available, yet no dataset library fully covers every new and specialized hardware profile entering enterprise fleets. This means many platforms still need to blend supplier-specific values with modeled assumptions and secondary factors. That can weaken consistency when enterprises compare fleets across brands, form factors, and refresh cycles. The embodied carbon IT asset lifecycle software market still has strong demand, but uneven upstream data remains a real brake on confidence and implementation speed.
Other drivers and restraints analyzed in the detailed report include:
- Expansion of Circular IT Practices, Reuse, and Lifecycle Extension Programs Extends Software's Role
- Convergence of IT Asset Management, ESG Reporting, and FinOps Workflows Creates A Broader Buying Center
- Integration Complexity Across ITAM, ERP, ESG, and Procurement Systems Raises Deployment Friction
For complete list of drivers and restraints, kindly check the Table Of Contents.
Segment Analysis
Software held 69.74% of the embodied carbon IT asset lifecycle software market in 2025, establishing it as the core delivery layer across the category. That position reflects how most buyers start by needing to collect device information, apply emissions logic, and produce consistent outputs within a single configurable system. The first enterprise question is usually about data capture and reporting repeatability, which naturally favors software before services spending expands. The embodied carbon IT asset lifecycle software market also remains software-led, as automation reduces manual carbon accounting work that many internal teams cannot sustain across multiple reporting periods. Established lifecycle and carbon platforms entered this space with proven data structures, while newer vendors focused on making those processes faster and easier to scale.
This lead does not imply that services are secondary in importance, as services are projected to expand at a 24.65% CAGR through 2031. Many buyers still need help with data preparation, methodology choices, system mapping, and the handoff between sustainability teams and IT operations. Service demand rises further when organizations want a faster route to usable outputs but do not yet have enough internal LCA or carbon accounting capacity. Sphera's managed LCA content offering, supported by more than 20,000 datasets annually updated and third-party verified, demonstrates why content and implementation support are often sold together in complex deployments. Over time, the embodied carbon IT asset lifecycle software industry is likely to remain anchored by software revenue, while services capture more value in integration, quality control, and ongoing model governance.
Cloud deployment accounted for 66.12% of the embodied carbon IT asset lifecycle software market in 2025, giving it a clear lead among delivery models. The preference is practical because cloud delivery supports faster onboarding, easier updates, and less infrastructure burden for sustainability teams that usually do not manage large internal software environments. It also works well for platforms that need frequent data refreshes from factor libraries, supplier records, and enterprise systems. Access to regularly updated lifecycle inventory content matters here, and broad databases such as ecoinvent reinforce the value of centrally managed updates rather than isolated local copies. The embodied carbon IT asset lifecycle software market still leans toward cloud because buyers want speed, flexibility, and simpler maintenance during early rollout phases.
Hybrid deployment is projected to grow at a 25.02% CAGR through 2031, which makes it the fastest-growing mode. This pattern reflects the needs of regulated organizations that want cloud-based modeling power but still prefer tighter control over telemetry, inventory detail, or internal records. Hybrid setups also appeal to enterprises that already run established governance systems on-site and do not want to move all connected data into a shared environment at once. ISO/IEC TS 19770-13:2026 supports this direction by encouraging the structured incorporation of sustainability information into existing ITAM systems rather than a one-size-fits-all architecture. On-premises deployment remains relevant in organizations with longer software replacement cycles, but the embodied carbon IT asset lifecycle software market is clearly shifting toward models that combine cloud flexibility with stronger control over sensitive data.
Complete Report Scope:
- By Component
- Software
- Services
- By Deployment Mode
- Cloud-Based
- On-Premises
- By Enterprise Size
- Large Enterprises
- Small and Medium Enterprises
- By Application
- Embodied Carbon Accounting
- IT Asset Lifecycle Optimization
- Circularity and Reuse Planning
- Compliance and Reporting
- By End User
- IT and Telecom
- BFSI
- Industrial Manufacturing
- Energy and Utilities
- Oil and Gas
- Retail and E-Commerce
- Construction and Infrastructure
- Government and Public Sector
- Other End Users
- By Geography
- North America
- United States
- Canada
- Mexico
- South America
- Brazil
- Argentina
- Rest of South America
- Europe
- Germany
- United Kingdom
- France
- Italy
- Spain
- Russia
- Rest of Europe
- Asia-Pacific
- China
- India
- Japan
- South Korea
- Australia
- Rest of Asia-Pacific
- Middle East and Africa
- Middle East
- Saudi Arabia
- United Arab Emirates
- Turkey
- Rest of Middle East
- Africa
- South Africa
- Egypt
- Rest of Africa
- Middle East
- North America
Geography Analysis
Europe held 34.56% of the embodied carbon IT asset lifecycle software market share in 2025, maintaining its leading position. Germany, the United Kingdom, and France remain the main demand centers because they combine large enterprise bases with stronger reporting expectations and more mature sustainability processes. Germany is especially important because CSRD implementation planning and corporate preparation have accelerated the need for structured reporting workflows for purchased goods and services. BITKOM's 2025 guidance also reflects the degree to which technology and software organizations in the region are already linking resource efficiency with procurement and lifecycle planning.
Asia-Pacific is projected to grow at a 25.45% CAGR through 2031, which makes it the fastest-growing region in the embodied carbon IT asset lifecycle software market. The region is entering a stronger adoption phase as disclosure practices expand across major economies and enterprise buyers demand better data from regional hardware suppliers. Japan, Australia, India, Singapore, China, and South Korea all contribute to this trend, as reporting activities and climate-related governance are becoming more formal across listed companies and large enterprises. Another factor is the region's weight in hardware manufacturing, which means supplier-side and buyer-side pressures often rise at the same time. This creates demand not only from reporting entities, but also from OEMs and component suppliers that need cleaner product carbon data to support global customer relationships.
North America held the second-largest regional share in the embodied carbon IT asset lifecycle software market in 2025. The United States remains central because it houses several well-funded vendors and a large base of enterprises that already run structured sustainability programs. Demand in this region is moving upstream from disclosure output into procurement-stage scoring, supplier data requests, and hardware refresh decisions. South America remains earlier in adoption, while the Middle East and Africa show a split pattern with stronger activity in the UAE, Saudi Arabia, and South Africa than in the rest of the region.
- One Click LCA Ltd
- PRe Sustainability B.V.
- Sphera Solutions, Inc.
- GreenDelta GmbH
- iPoint-systems GmbH
- Makersite GmbH
- Ecochain Technologies B.V.
- Plan A Technologies GmbH
- Greenly SAS
- Normative AB
- Persefoni AI, Inc.
- Watershed Technology, Inc.
- Sweep SAS
- Dcycle, S.L.
- Sinai Technologies, Inc.
- Emitwise Limited
- Measurabl, Inc.
- Deepki SAS
- OpenLCA GmbH
- FigBytes Inc.
Additional Benefits:
- The market estimate (ME) sheet in Excel format
- 3 months of analyst support
TABLE OF CONTENTS
1 INTRODUCTION
- 1.1 Study Assumptions and Market Definition
- 1.2 Scope of the Study
2 RESEARCH METHODOLOGY
3 EXECUTIVE SUMMARY
4 MARKET LANDSCAPE
- 4.1 Market Overview
- 4.2 Market Drivers
- 4.2.1 Stringent Scope 3 and IT Sustainability Disclosure Requirements
- 4.2.2 Rising Demand for Audit-Ready Embodied Carbon Data in IT Procurement
- 4.2.3 Expansion of Circular IT Practices, Reuse, and Lifecycle Extension Programs
- 4.2.4 Convergence of IT Asset Management, ESG Reporting, and FinOps Workflows
- 4.2.5 Wider Availability of Device-Level LCA Data Through APIs and Databases
- 4.2.6 Growing Enterprise Focus on Product-Level Carbon Hotspots Across IT Fleets
- 4.3 Market Restraints
- 4.3.1 Fragmented Embodied Carbon Factors Across OEMs and Device Classes
- 4.3.2 Integration Complexity Across ITAM, ERP, ESG, and Procurement Systems
- 4.3.3 Security, Privacy, and Data Governance Concerns Around Asset Telemetry
- 4.3.4 Limited Standardization of IT Asset Carbon Accounting Methodologies
- 4.4 Industry Value-Chain Analysis
- 4.5 Regulatory Landscape
- 4.6 Technological Outlook
- 4.7 Porter's Five Forces Analysis
- 4.7.1 Bargaining Power of Buyers
- 4.7.2 Bargaining Power of Suppliers
- 4.7.3 Threat of New Entrants
- 4.7.4 Threat of Substitutes
- 4.7.5 Intensity of Competitive Rivalry
5 MARKET SIZE AND GROWTH FORECASTS (VALUE)
- 5.1 By Component
- 5.1.1 Software
- 5.1.2 Services
- 5.2 By Deployment Mode
- 5.2.1 Cloud-Based
- 5.2.2 On-Premises
- 5.3 By Enterprise Size
- 5.3.1 Large Enterprises
- 5.3.2 Small and Medium Enterprises
- 5.4 By Application
- 5.4.1 Embodied Carbon Accounting
- 5.4.2 IT Asset Lifecycle Optimization
- 5.4.3 Circularity and Reuse Planning
- 5.4.4 Compliance and Reporting
- 5.5 By End User
- 5.5.1 IT and Telecom
- 5.5.2 BFSI
- 5.5.3 Industrial Manufacturing
- 5.5.4 Energy and Utilities
- 5.5.5 Oil and Gas
- 5.5.6 Retail and E-Commerce
- 5.5.7 Construction and Infrastructure
- 5.5.8 Government and Public Sector
- 5.5.9 Other End Users
- 5.6 By Geography
- 5.6.1 North America
- 5.6.1.1 United States
- 5.6.1.2 Canada
- 5.6.1.3 Mexico
- 5.6.2 South America
- 5.6.2.1 Brazil
- 5.6.2.2 Argentina
- 5.6.2.3 Rest of South America
- 5.6.3 Europe
- 5.6.3.1 Germany
- 5.6.3.2 United Kingdom
- 5.6.3.3 France
- 5.6.3.4 Italy
- 5.6.3.5 Spain
- 5.6.3.6 Russia
- 5.6.3.7 Rest of Europe
- 5.6.4 Asia-Pacific
- 5.6.4.1 China
- 5.6.4.2 India
- 5.6.4.3 Japan
- 5.6.4.4 South Korea
- 5.6.4.5 Australia
- 5.6.4.6 Rest of Asia-Pacific
- 5.6.5 Middle East and Africa
- 5.6.5.1 Middle East
- 5.6.5.1.1 Saudi Arabia
- 5.6.5.1.2 United Arab Emirates
- 5.6.5.1.3 Turkey
- 5.6.5.1.4 Rest of Middle East
- 5.6.5.2 Africa
- 5.6.5.2.1 South Africa
- 5.6.5.2.2 Egypt
- 5.6.5.2.3 Rest of Africa
- 5.6.5.1 Middle East
- 5.6.1 North America
6 COMPETITIVE LANDSCAPE
- 6.1 Market Concentration
- 6.2 Strategic Moves
- 6.3 Market Share Analysis
- 6.4 Company Profiles (includes Global Level Overview, Market Level Overview, Core Segments, Financials as available, Strategic Information, Market Rank/Share, Products and Services, Recent Developments)
- 6.4.1 One Click LCA Ltd
- 6.4.2 PRe Sustainability B.V.
- 6.4.3 Sphera Solutions, Inc.
- 6.4.4 GreenDelta GmbH
- 6.4.5 iPoint-systems GmbH
- 6.4.6 Makersite GmbH
- 6.4.7 Ecochain Technologies B.V.
- 6.4.8 Plan A Technologies GmbH
- 6.4.9 Greenly SAS
- 6.4.10 Normative AB
- 6.4.11 Persefoni AI, Inc.
- 6.4.12 Watershed Technology, Inc.
- 6.4.13 Sweep SAS
- 6.4.14 Dcycle, S.L.
- 6.4.15 Sinai Technologies, Inc.
- 6.4.16 Emitwise Limited
- 6.4.17 Measurabl, Inc.
- 6.4.18 Deepki SAS
- 6.4.19 OpenLCA GmbH
- 6.4.20 FigBytes Inc.
7 MARKET OPPORTUNITIES AND FUTURE OUTLOOK
- 7.1 White-Space and Unmet-Need Assessment

 數位資產管理市場:按組件類型、資產類型、整合能力、部署模式、組織規模、應用和產業分類-2026-2032年全球市場預測
 2026年全球基礎設施用壓紋碳追蹤材料市場報告
 全球數位資產管理軟體市場規模、佔有率、趨勢和成長分析報告(2026-2034年)2026年全球影像管理市場報告
 數位驗證市場規模、佔有率和趨勢分析報告:按組件、部署模式、技術、最終用途、地區和細分市場分類(2026-2033 年)
 數位資產管理市場規模、佔有率、趨勢和預測:按類型、組件、應用、部署模式、企業規模、最終用戶行業和地區分類,2026-2034 年
 全球數位資產管理市場(至2031年):依產品(解決方案與服務)、應用(品牌與行銷資產管理、媒體製作與廣播資產管理)、資產類型、組織規模、產業及地區分類2026年全球數位密鑰雲認證管理員市場報告2026年全球數位資產管理市場報告2026年全球數位資產管理(DAM)軟體市場報告