


 |
市場調查報告書
商品編碼
2072958
人工智慧驅動的能源管理軟體:市場佔有率分析、行業趨勢和統計數據以及成長預測(2026-2031 年)AI-Powered Energy Management Software - Market Share Analysis, Industry Trends & Statistics, Growth Forecasts (2026 - 2031) |
||||||

※ 本網頁內容可能與最新版本有所差異。詳細情況請與我們聯繫。
根據 Mordor Intelligence 預測,人工智慧驅動的能源管理軟體市場規模預計將從 2025 年的 41.2 億美元成長到 2026 年的 48.5 億美元,然後從 2026 年到 2031 年以 19.38% 的複合成長,到 2031 年達到 117.6 億美元。
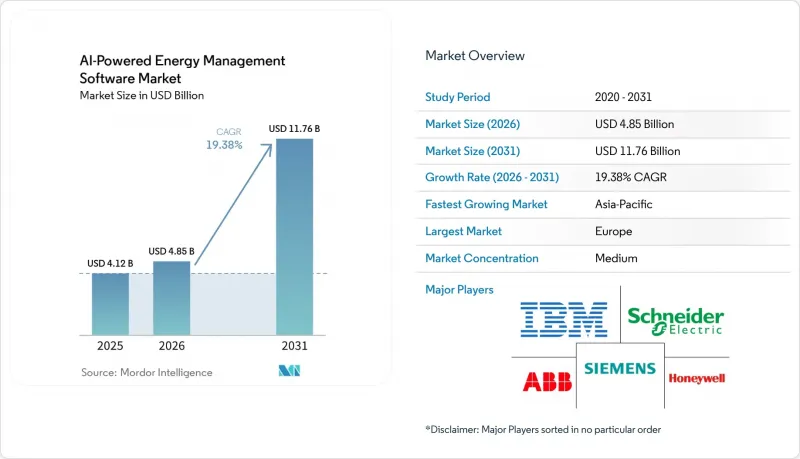
本報告按元件(軟體和服務)、部署類型(雲端、本地部署、混合部署)、應用(例如,能源消耗和需求最佳化、資產性能和預測性維護)、最終用戶(公共產業、商業建築、工業設施)和地區進行細分。市場預測以美元計價。
全球人工智慧驅動的能源管理軟體市場趨勢及洞察
商業和工業設施對即時能源最佳化的需求日益成長。
在短期內,即時最佳化正成為人工智慧驅動的能源管理軟體市場中最顯著的價值創造驅動力,它將軟體從被動的報告工具轉變為主動的營運工具。隨著電價波動加劇和分時電價機制的日益普及,商業和工業用戶面臨越來越大的內部壓力,需要在不影響運作時間的前提下降低不必要的尖峰需求。因此,對於那些需要根據即時價格、生產週期和不斷變化的現場條件調整負載計劃,而不是依賴固定規則的設施而言,人工智慧驅動的能源管理軟體市場正在蓬勃發展。一項2026年的研究表明,使用生產計劃輸入的、具有計劃感知能力的XGBoost模型實現了2.67 kW的均方根誤差(RMSE)和20.9698的R值,這表明該模型能夠在多線工業環境中進行高精度預測,而無需依賴內部感測器的完整數據。這種性能對於在實際運作環境中應用人工智慧至關重要,因為傳統最佳化工具的有效性往往由於工廠數據不完整而受到限制。隨著越來越多的設施致力於降低需求費用並在高波動時期穩定能源使用,人工智慧驅動的能源管理軟體市場正變得越來越與降低日常營運成本而非長期永續性項目緊密相關。
人工智慧與智慧電網和分散式能源的整合
分散式能源的興起也推動了人工智慧驅動的能源管理軟體市場的成長。如今,電網的組成受到屋頂太陽能、電池、電動車充電和需要不斷調整的靈活負載的影響。隨著電力雙向流動,決策必須跨越數千個小規模資產而非少數集中式電廠,傳統的電力控制邏輯已無法滿足需求。這些變化正在拓展人工智慧驅動的能源管理軟體市場的作用,使其從站點級最佳化擴展到“電網感知編配”,即預測、平衡和調度必須協同工作。一篇關於邊緣人工智慧驅動的可再生能源微電網控制的論文(發表於2026年)展示了物聯網連接資產之間安全高效協調的技術成熟度,加速了分散式能源系統向人工智慧主導控制的更廣泛轉變。隨著日本決定從2026會計年度起向需量反應市場開放低壓分散式能源,預計日本國內資源聚合SaaS平台市場在2024會計年度至2035會計年度間將成長33.5倍,達到67億日圓(約4,400萬美元)。因此,人工智慧驅動的能源管理軟體市場不僅將受益於互聯資產的成長,還將受益於將這些資產轉化為可貨幣化且柔軟性的資源的監管變革。
將傳統OT系統與IT系統整合的複雜性。
在許多工廠、電力公司和大型建築中,傳統的運作環境仍然是一個主要阻礙因素,因為它們仍然使用獨立的資料層、專有歷史資料庫和不適用於現代人工智慧工作流程的工業協定。在這些環境中,除非供應商能夠在不中斷運作中運作的情況下整合SCADA、建築管理系統、企業軟體和邊緣設備,否則人工智慧驅動的能源管理軟體市場無法順利擴張。這不僅是軟體相容性的問題;IT和OT的嚴格分離常常迫使供應商圍繞分段網路、本地推理和受控資料交換重新設計部署模式。羅克韋爾自動化公司2025年的一份報告指出,只有30%的組織完全整合了其IT和OT安全運行中心,這凸顯了在人工智慧能夠在兩種環境中一致運作之前,仍有大量協調工作要做。 2025年一份關於能源系統網實整合情境察覺的技術報告也指出,先進的控制環境依賴於安全、結構化的整合,而不是簡單的數據存取。因此,人工智慧驅動的能源管理軟體市場在現有系統(棕地)環境中的引進週期面臨延遲,因為架構挑戰與軟體功能同樣重要。
細分市場分析
預計到2025年,軟體市佔率將達到69.85%,這意味著大部分支出仍集中在核心平台而非外圍支援層。這種主導地位反映了已整合到公共產業控制室、建築系統和工業最佳化環境中的供應商所擁有的用戶基礎優勢,在這些環境中,切換風險高,整合歷史至關重要。在人工智慧驅動的能源管理軟體市場,這些軟體平台通常整合了儀錶板、預測引擎、調度邏輯、碳核算模組和疊加層,它們運作在現有控制系統之上,而不是取代現有系統。這種定位也受益於資料網路效應;平台使用時間越長,其運作歷史在模型調優和維護客戶關係方面的價值就越大。因此,儘管買家需求不斷成長,軟體類別仍保持著穩健的收入基礎。
預計到2031年,服務業將以20.12%的複合年成長率成長,成為人工智慧驅動的能源管理軟體市場中成長最快的細分領域。這主要是因為,如果不定期重新訓練以反映區域負荷趨勢、收費系統變化、天氣變化和新的資產配置,能源人工智慧的準確性將會下降。一項針對用於預測性維護的快取擴展多模態生成式人工智慧的2026年研究表明,該架構在即時檢測高能耗設備的異常方面優於單一分析方法,凸顯了持續模型支援的價值。此外,買家將需要整合、模型管治、用戶協助和符合審計要求的報告方面的服務支持,尤其是在使用人工智慧支援ISO 50001合規性或內部績效評估時。這一趨勢正在拓展收入來源,使其不再局限於一次性授權銷售,進一步促進人工智慧驅動的能源管理軟體產業內持續的業務關係。
到2025年,基於雲端的部署將佔據人工智慧驅動的能源管理軟體市場66.41%的佔有率。這是因為雲端技術能夠實現快速部署、簡化更新,並輕鬆與企業資料環境整合。這種模式適用於商業建築營運商和中型工業用戶,他們希望在無需大規模現場基礎設施投資的情況下進行分析、報告和最佳化。在人工智慧驅動的能源管理軟體市場,雲端交付還能夠實現對資產組合的集中式視覺化,這對於單一所有者管理多個地點的眾多設施至關重要。這種規模經濟意義重大,因為它使供應商能夠更快地部署新功能,並使客戶能夠在單一環境中比較每個地點的能源績效。因此,即使使用者要求在每個地點進行精細化控制,雲端仍然是最暢銷的選擇。
預計到2031年,混合部署將以19.92%的複合年成長率成長,而混合部署的AI驅動型能源管理軟體市場預計也將以19.92%的複合年成長率擴張,因為電力公司和大規模工業營運商既需要邊緣響應能力,也需要雲端分析能力。這一趨勢的促進因素在於,許多高價值用例需要在現場實現低延遲響應,而要求更高的預測和最佳化工作負載仍然依賴雲端。一篇發表於2025年關於邊緣AI故障檢測的報導指出,當響應時間小於150毫秒時,檢測率可達92.0%,而雲端基礎替代方案則需要200毫秒,並且邊緣AI在每個推理週期消耗的能量也更少。另一篇發表於2026年關於可再生能源微電網控制的研究進一步支持了在協調高能耗網實整合系統中採用邊緣AI。雖然在遠端處理受到資料主權或關鍵基礎設施要求限制的情況下,本地部署仍然發揮明顯的作用,但預計最顯著的成長並非來自這兩種極端形式,而是來自向混合架構的轉變。
區域分析
到2025年,歐洲將佔據人工智慧能源管理軟體市場34.56%的佔有率。這主要得益於歐洲在建築、能源性能和報告方面的法規比其他地區更為完善。修訂後的《建築能源性能指令》(EPBD)將於2024年生效,歐盟成員國需在2026年5月29日前將其納入本國法律。這將進一步提升建築自動化和控制系統在大規模非住宅建築中的實際重要性。技術報告CEN/TR 18276:2026基於EPBD框架,新增了一份建築自動化合規性檢查清單,從而推動了數位化能源管理系統的正式實施。德國、英國、法國和義大利仍將是主要市場,但北歐以及中東歐國家由於維修、電氣化和更嚴格的能源效率標準,正在迅速發展。
預計到2031年,亞太地區將以20.45%的複合年成長率成長,成為人工智慧能源管理軟體市場成長最快的地區。中國在部署方面領先於該地區,這得益於其電網現代化、龐大的工業規模以及「實現碳排放達峰和碳中和」的目標,這些因素都對電力和設施系統的最佳化提出了顯著需求。隨著主要工業走廊對符合監管要求的能源管理的需求不斷成長,印度的重要性也日益凸顯,尤其是在大規模能源用戶面臨更嚴格監控和審計要求的地區。在日本,隨著低壓分散式能源從2026會計年度起參與需量反應,將進一步推動市場成長,擴大能夠聚合和控制靈活資產的軟體的經濟效益。韓國和澳洲也透過擴大可再生能源部署和電網數位化,為該地區的發展前景提供支援。同時,隨著製造業產能的擴張,東南亞現有工業設施的維修預計將實現長期成長。
預計到2025年,北美將佔據相當大的市場佔有率,這得益於其成熟的需量反應系統、在商業建築中的廣泛應用以及對人工智慧相關基礎設施的大力投資。該地區還擁有大量公用事業公司和企業,它們願意將營運數據連接到雲端規模的人工智慧環境,前提是安全和控制要求得到滿足。 2026年4月,AWS被西門子能源選為策略雲端供應商,體現了能源領域領先供應商如何將營運經驗與超大規模運算支援相結合。南美洲仍然是人工智慧能源管理軟體的新興市場,而中東和非洲則處於應用初期,隨著可再生能源的擴張和基礎設施現代化進程的推進,這些地區將繼續吸引選擇性投資。
其他好處:
- Excel格式的市場預測(ME)表
- 3個月的分析師支持
目錄
第1章:引言
- 研究假設和市場定義
- 調查範圍
第2章:調查方法
第3章執行摘要
第4章 市場狀況
- 市場概覽
- 市場促進因素
- 商業和工業設施對即時能源最佳化的需求日益成長。
- 人工智慧、智慧電網和分散式能源的融合
- 對自動化需量反應和尖峰負載管理的需求日益成長
- 擴展ESG報表和碳核算工作流程
- 引進邊緣人工智慧技術,實現站點級能源控制和故障檢測
- 由於建築物和工業基礎設施老化,對維修的需求日益成長。
- 市場限制因素
- 與傳統OT和IT系統整合難度很高。
- 與數據品質、互通性和感測器碎片化相關的挑戰。
- 對關鍵能源資產的網路安全和數據主權問題的擔憂
- 中小型站點負載密度有限,投資報酬率存在不確定性。
- 宏觀經濟因素對市場的影響
- 產業價值鏈分析
- 監理情勢
- 技術展望
- 波特五力分析
第5章 市場規模與成長預測
- 按組件
- 軟體
- 服務
- 部署模式
- 基於雲端的
- 現場
- 混合
- 透過使用
- 最佳化能源消耗和需求
- 資產性能和預測性維護
- 智慧電網與分散式能源(DER)的管理
- 可再生能源預測與整合
- 能源交易、定價和市場訊息
- 最終用戶
- 公用事業
- 商業建築
- 工業設施
- 住宅大樓
- 按地區
- 北美洲
- 美國
- 加拿大
- 墨西哥
- 南美洲
- 巴西
- 阿根廷
- 其他南美國家
- 歐洲
- 德國
- 英國
- 法國
- 義大利
- 西班牙
- 俄羅斯
- 其他歐洲國家
- 亞太地區
- 中國
- 印度
- 日本
- 韓國
- 澳洲和紐西蘭
- 其他亞太國家
- 中東和非洲
- 中東
- 沙烏地阿拉伯
- 阿拉伯聯合大公國
- 土耳其
- 其他中東國家
- 非洲
- 南非
- 埃及
- 其他非洲國家
- 中東
- 北美洲
第6章 競爭情勢
- 市場集中度
- 策略趨勢
- 市佔率分析
- 公司簡介
- Bidgely Inc.
- C3.ai, Inc.
- Grid4C Ltd.
- Innowatts, Inc.
- EnergyCAP, LLC
- Siemens AG
- Schneider Electric SE
- ABB Ltd.
- Honeywell International Inc.
- Johnson Controls International plc
- IBM Corporation
- Oracle Corporation
- Microsoft Corporation
- Amazon Web Services, Inc.
- Enel X Srl
- GridPoint, Inc.
- AutoGrid Systems, Inc.
- Dexma Sensors, SL
- Rockwell Automation, Inc.
- Energy Intelligence Group, Inc.
第7章 市場機會與未來展望
According to Mordor Intelligence, the AI-powered energy management software market size is expected to grow from USD 4.12 billion in 2025 to USD 4.85 billion in 2026 and is forecast to reach USD 11.76 billion by 2031 at 19.38% CAGR over 2026-2031.
This report is Segmented by Component (Software, and Services), Deployment Mode (Cloud-Based, On-Premises, and Hybrid), Application (Energy Consumption and Demand Optimization, Asset Performance and Predictive Maintenance, and More), End User (Utilities, Commercial Buildings, Industrial Facilities, and More), and Geography. The Market Forecasts are Provided in Terms of Value (USD).
Global AI-Powered Energy Management Software Market Trends and Insights
Rising Need For Real-Time Energy Optimization in Commercial And Industrial Facilities
Real-time optimization is emerging as the clearest near-term value driver for the AI-powered energy management software market because it transforms software from a passive reporting layer into an active operating tool. Commercial and industrial users are facing sharper power price swings, wider time-of-use tariff exposure, and tighter internal pressure to reduce avoidable peak demand without affecting uptime. That is why the AI-powered energy management software market is gaining traction in facilities that need load schedules to adjust against live prices, production cycles, and changing site conditions rather than against fixed rules. A 2026 study showed that a schedule-aware XGBoost model using production-schedule inputs achieved an RMSE of 2.67 kW and an R2 of 0.9698, supporting the case for high-accuracy forecasting in multi-line industrial settings without relying on full internal sensor visibility. This kind of performance matters because it makes AI useful in real operating environments where incomplete plant data often limits traditional optimization tools. As more sites seek to cut demand charges and stabilize energy use during volatile tariff windows, the AI-powered energy management software market is increasingly tied to daily operational savings rather than longer-cycle sustainability projects.
AI Integration With Smart Grids and Distributed Energy Resources
The rise of distributed energy resources is also driving the AI-powered energy management software market, as grid conditions are now shaped by rooftop solar, batteries, EV charging, and flexible loads that require constant coordination. Conventional dispatch logic struggles when power flows become bidirectional and when decisions must be made across thousands of small assets rather than a few centralized generation points. That shift is expanding the role of the AI-powered energy management software market from site-level optimization to grid-aware orchestration, where forecasting, balancing, and dispatch must work together. A 2026 paper on edge-AI-enabled renewable microgrid control demonstrated the technical maturity of secure, energy-efficient coordination across IoT-linked assets, reinforcing the broader move toward AI-led control in distributed energy systems. Japan's decision to open low-voltage distributed energy resources to demand-response markets from FY2026 is expected to expand the domestic resource aggregator SaaS platform market by 33.5 times between FY2024 and FY2035, to JPY 6.7 billion, which was already converted to USD 44 million. The AI-powered energy management software market, therefore, benefits not only from more connected assets but also from rule changes that turn those assets into monetizable flexibility resources.
Integration Complexity Across Legacy OT and IT Systems
Legacy operational environments remain a major restraint because many plants, utilities, and large buildings still run on separate data layers, proprietary historians, and industrial protocols that were not built for modern AI workflows. In those environments, the AI-powered energy management software market cannot scale smoothly unless vendors can bridge SCADA, building management systems, enterprise software, and edge devices without disrupting live operations. This is a bigger issue than software compatibility alone, because strict IT-OT separation often forces vendors to redesign deployment patterns around segmented networks, local inference, and controlled data exchange. Rockwell Automation reported in 2025 that only 30% of organizations had fully integrated IT and OT security operations centers, underscoring the foundational coordination work that remains before AI can operate consistently across both environments. A 2025 technical report on cyber-physical situational awareness in energy systems also reflected how advanced control environments depend on secure, structured integration rather than simple data access. The AI-powered energy management software market, therefore, faces slower deployment cycles in brownfield settings, where architectural challenges are as important as software capabilities.
Other drivers and restraints analyzed in the detailed report include:
- Increasing Demand for Automated Demand Response and Peak Load Management
- Expansion of ESG Reporting and Carbon Accounting Workflows
- Data Quality, Interoperability, and Sensor Fragmentation
For complete list of drivers and restraints, kindly check the Table Of Contents.
Segment Analysis
Software held a 69.85% share in 2025, indicating that most spending still sat in core platforms rather than in surrounding support layers. That lead reflects the installed-base advantage of vendors already embedded in utility control rooms, building systems, and industrial optimization environments, where switching risk is high and integration history matters. In the AI-powered energy management software market, these software platforms usually combine dashboards, forecasting engines, dispatch logic, carbon accounting modules, and overlays that sit above existing control systems rather than replacing them. This position also benefits from data network effects: the longer a platform remains in use, the more valuable its operational history becomes for tuning models and maintaining customer relationships. The software category, therefore, keeps a durable revenue base even as buyers broaden their requirements.
Services are projected to grow at a 20.12% CAGR through 2031, making them the fastest-growing component of the AI-powered energy management software market. The main reason is that energy AI becomes less accurate without regular retraining to account for local load behavior, changing tariffs, weather shifts, and new asset configurations. A 2026 study on cache-augmented multimodal generative AI for predictive maintenance supported the value of ongoing model support because the architecture outperformed standalone analytical approaches in real-time anomaly detection for energy-intensive equipment. Buyers also need service support for integration, model governance, user enablement, and audit-ready reporting, especially when they use AI to support ISO 50001 or internal performance reviews. That pattern is widening the revenue pool beyond one-time license sales and pushing more recurring relationships into the AI-powered energy management software industry.
Cloud-based deployment accounted for 66.41% of the AI-powered energy management software market share in 2025, as it supports faster onboarding, simpler updates, and easier integration with enterprise data environments. This model works well for commercial building operators and mid-sized industrial users that want analytics, reporting, and optimization without large on-site infrastructure commitments. In the AI-powered energy management software market, cloud delivery also enables centralized portfolio visibility, which is important when a single owner manages many facilities across multiple locations. The scale advantage is meaningful because it allows vendors to roll out new functions faster and lets customers compare energy performance across sites within one environment. That is why cloud remains the volume leader even as users ask for more site-specific control.
Hybrid deployment is projected to grow at a 19.92% CAGR through 2031, and the AI-powered energy management software market for hybrid deployment is projected to expand at a 19.92% CAGR as utilities and large industrial operators seek both edge responsiveness and cloud analytics. This pattern is gaining strength because many high-value use cases need low-latency action at the site while still depending on heavier forecasting and optimization workloads in the cloud. A 2025 article on edge AI fault detection reported 92.0% detection rates with response times below 150 milliseconds, compared with 200 milliseconds for cloud alternatives, while using less energy per inference cycle. A separate 2026 study on renewable microgrid control further supported the deployment of edge AI for energy-critical cyber-physical coordination. On-premises deployment still plays a defined role, where data sovereignty and critical infrastructure requirements limit remote processing, but the strongest growth is toward mixed architectures rather than either extreme alone.
Complete Report Scope:
- By Component
- Software
- Services
- By Deployment Mode
- Cloud-Based
- On-Premises
- Hybrid
- By Application
- Energy Consumption and Demand Optimization
- Asset Performance and Predictive Maintenance
- Smart Grid and Distributed Energy Resource (DER) Management
- Renewable Energy Forecasting and Integration
- Energy Trading, Pricing and Market Intelligence
- By End User
- Utilities
- Commercial Buildings
- Industrial Facilities
- Residential Buildings
- By Geography
- North America
- United States
- Canada
- Mexico
- South America
- Brazil
- Argentina
- Rest of South America
- Europe
- Germany
- United Kingdom
- France
- Italy
- Spain
- Russia
- Rest of Europe
- Asia-Pacific
- China
- India
- Japan
- South Korea
- Australia and New Zealand
- Rest of Asia-Pacific
- Middle East and Africa
- Middle East
- Saudi Arabia
- United Arab Emirates
- Turkey
- Rest of Middle East
- Africa
- South Africa
- Egypt
- Rest of Africa
- Middle East
- North America
Geography Analysis
Europe held 34.56% of the AI-powered energy management software market share in 2025, as regulation around buildings, energy performance, and reporting is more developed there than in other regions. The recast EPBD entered into force in 2024, and EU member states must transpose it into national law by May 29, 2026, thereby increasing the practical relevance of building automation and control systems in large non-residential properties. The technical report CEN/TR 18276:2026 adds a compliance checklist for building automation under the EPBD framework, which supports more formal implementation pathways for digital energy management systems. Germany, the United Kingdom, France, and Italy remain the main country markets, while the Nordics and Central and Eastern Europe are building momentum through renovation activity, electrification, and stricter efficiency standards.
Asia-Pacific is projected to grow at a 20.45% CAGR through 2031, making it the fastest-growing region in the AI-powered energy management software market. China leads regional deployment volume because grid modernization, industrial scale, and dual-carbon goals create a large need for optimization across power and facility systems. India is also becoming more important as compliance-linked energy management demand builds in major industrial corridors, especially where large energy users face tighter monitoring and audit expectations. Japan adds another growth layer as low-voltage distributed energy resources enter demand-response participation from FY2026, expanding the economic case for software that can aggregate and control flexible assets. South Korea and Australia are also supporting the regional outlook through higher renewable integration and grid digitization, while Southeast Asia offers a longer runway in brownfield industrial retrofits as manufacturing capacity expands.
North America held a substantial share in 2025, supported by mature demand-response structures, deep adoption of commercial buildings, and strong investment in AI-related infrastructure. The region also benefits from a large base of utilities and enterprise operators willing to connect operational data to cloud-scale AI environments when security and control requirements are met. AWS was named a strategic cloud provider for Siemens Energy in April 2026, reflecting how major vendors are combining operational domain expertise with hyperscale computing support in the energy field. South America remains an emerging part of the AI-powered energy management software market, while the Middle East and Africa are still earlier in adoption but continue to attract selective investment as renewable buildout and infrastructure modernization advance.
- Bidgely Inc.
- C3.ai, Inc.
- Grid4C Ltd.
- Innowatts, Inc.
- EnergyCAP, LLC
- Siemens AG
- Schneider Electric SE
- ABB Ltd.
- Honeywell International Inc.
- Johnson Controls International plc
- IBM Corporation
- Oracle Corporation
- Microsoft Corporation
- Amazon Web Services, Inc.
- Enel X S.r.l.
- GridPoint, Inc.
- AutoGrid Systems, Inc.
- Dexma Sensors, S.L.
- Rockwell Automation, Inc.
- Energy Intelligence Group, Inc.
Additional Benefits:
- The market estimate (ME) sheet in Excel format
- 3 months of analyst support
TABLE OF CONTENTS
1 INTRODUCTION
- 1.1 Study Assumptions and Market Definition
- 1.2 Scope of the Study
2 RESEARCH METHODOLOGY
3 EXECUTIVE SUMMARY
4 MARKET LANDSCAPE
- 4.1 Market Overview
- 4.2 Market Drivers
- 4.2.1 Rising Need for Real-Time Energy Optimization in Commercial and Industrial Facilities
- 4.2.2 Integration of AI With Smart Grid and Distributed Energy Resources
- 4.2.3 Increasing Demand for Automated Demand Response and Peak Load Management
- 4.2.4 Expansion of ESG Reporting and Carbon Accounting Workflows
- 4.2.5 Edge AI Adoption for Site-Level Energy Control and Fault Detection
- 4.2.6 Growing Retrofit Demand From Aging Building and Industrial Infrastructure
- 4.3 Market Restraints
- 4.3.1 High Integration Complexity With Legacy OT and IT Systems
- 4.3.2 Data Quality, Interoperability, and Sensor Fragmentation Issues
- 4.3.3 Cybersecurity and Data Sovereignty Concerns for Critical Energy Assets
- 4.3.4 Payback Uncertainty in Small and Mid-Sized Sites With Limited Load Density
- 4.4 Impact of Macroeconomic Factors on the Market
- 4.5 Industry Value-Chain Analysis
- 4.6 Regulatory Landscape
- 4.7 Technological Outlook
- 4.8 Porter's Five Forces Analysis
- 4.8.1 Bargaining Power of Buyers
- 4.8.2 Bargaining Power of Suppliers
- 4.8.3 Threat of New Entrants
- 4.8.4 Threat of Substitutes
- 4.8.5 Intensity of Competitive Rivalry
5 MARKET SIZE AND GROWTH FORECASTS (VALUE)
- 5.1 By Component
- 5.1.1 Software
- 5.1.2 Services
- 5.2 By Deployment Mode
- 5.2.1 Cloud-Based
- 5.2.2 On-Premises
- 5.2.3 Hybrid
- 5.3 By Application
- 5.3.1 Energy Consumption and Demand Optimization
- 5.3.2 Asset Performance and Predictive Maintenance
- 5.3.3 Smart Grid and Distributed Energy Resource (DER) Management
- 5.3.4 Renewable Energy Forecasting and Integration
- 5.3.5 Energy Trading, Pricing and Market Intelligence
- 5.4 By End User
- 5.4.1 Utilities
- 5.4.2 Commercial Buildings
- 5.4.3 Industrial Facilities
- 5.4.4 Residential Buildings
- 5.5 By Geography
- 5.5.1 North America
- 5.5.1.1 United States
- 5.5.1.2 Canada
- 5.5.1.3 Mexico
- 5.5.2 South America
- 5.5.2.1 Brazil
- 5.5.2.2 Argentina
- 5.5.2.3 Rest of South America
- 5.5.3 Europe
- 5.5.3.1 Germany
- 5.5.3.2 United Kingdom
- 5.5.3.3 France
- 5.5.3.4 Italy
- 5.5.3.5 Spain
- 5.5.3.6 Russia
- 5.5.3.7 Rest of Europe
- 5.5.4 Asia-Pacific
- 5.5.4.1 China
- 5.5.4.2 India
- 5.5.4.3 Japan
- 5.5.4.4 South Korea
- 5.5.4.5 Australia and New Zealand
- 5.5.4.6 Rest of Asia-Pacific
- 5.5.5 Middle East and Africa
- 5.5.5.1 Middle East
- 5.5.5.1.1 Saudi Arabia
- 5.5.5.1.2 United Arab Emirates
- 5.5.5.1.3 Turkey
- 5.5.5.1.4 Rest of Middle East
- 5.5.5.2 Africa
- 5.5.5.2.1 South Africa
- 5.5.5.2.2 Egypt
- 5.5.5.2.3 Rest of Africa
- 5.5.5.1 Middle East
- 5.5.1 North America
6 COMPETITIVE LANDSCAPE
- 6.1 Market Concentration
- 6.2 Strategic Moves
- 6.3 Market Share Analysis
- 6.4 Company Profiles (includes Global Level Overview, Market Level Overview, Core Segments, Financials as available, Strategic Information, Market Rank/Share, Products and Services, Recent Developments)
- 6.4.1 Bidgely Inc.
- 6.4.2 C3.ai, Inc.
- 6.4.3 Grid4C Ltd.
- 6.4.4 Innowatts, Inc.
- 6.4.5 EnergyCAP, LLC
- 6.4.6 Siemens AG
- 6.4.7 Schneider Electric SE
- 6.4.8 ABB Ltd.
- 6.4.9 Honeywell International Inc.
- 6.4.10 Johnson Controls International plc
- 6.4.11 IBM Corporation
- 6.4.12 Oracle Corporation
- 6.4.13 Microsoft Corporation
- 6.4.14 Amazon Web Services, Inc.
- 6.4.15 Enel X S.r.l.
- 6.4.16 GridPoint, Inc.
- 6.4.17 AutoGrid Systems, Inc.
- 6.4.18 Dexma Sensors, S.L.
- 6.4.19 Rockwell Automation, Inc.
- 6.4.20 Energy Intelligence Group, Inc.
7 MARKET OPPORTUNITIES AND FUTURE OUTLOOK
- 7.1 White-Space and Unmet-Need Assessment

 2026-2030年全球能源管理系統(EMS)市場
 能源管理系統市場預測至2034年—按組件、類型、部署模式、應用、最終用戶和地區分類的全球分析能源管理系統市場預測至2034年-按系統類型、組件、部署模式、最終用戶產業和地區分類的全球分析
 歐洲能源管理系統:市場佔有率分析、產業趨勢與統計及成長預測(2026-2031 年)北美能源管理系統:市場佔有率分析、產業趨勢與統計及成長預測(2026-2031 年)
 能源管理系統市場:依產品、通訊技術、能源來源整合、組織規模、部署模式及最終用途分類-2026-2032年全球市場預測亞太地區人工智慧能源管理軟體:市場佔有率分析、產業趨勢與統計及成長預測(2026-2031)能源最佳化自動化市場預測至2034年—按組件、部署模式、技術、應用、最終用戶和地區分類的全球分析能源自動化系統市場預測至2034年—按組件、系統類型、連接技術、應用、最終用戶和地區分類的全球分析
 能源管理系統市場報告:按組件、產品、解決方案、產業垂直領域、最終用途和地區分類(2026-2034 年)