


 |
市場調查報告書
商品編碼
2072902
楝樹基肥料:市場佔有率分析、行業趨勢和統計數據以及成長預測(2026-2031 年)Neem-Based Fertilizer - Market Share Analysis, Industry Trends & Statistics, Growth Forecasts (2026 - 2031) |
||||||

※ 本網頁內容可能與最新版本有所差異。詳細情況請與我們聯繫。
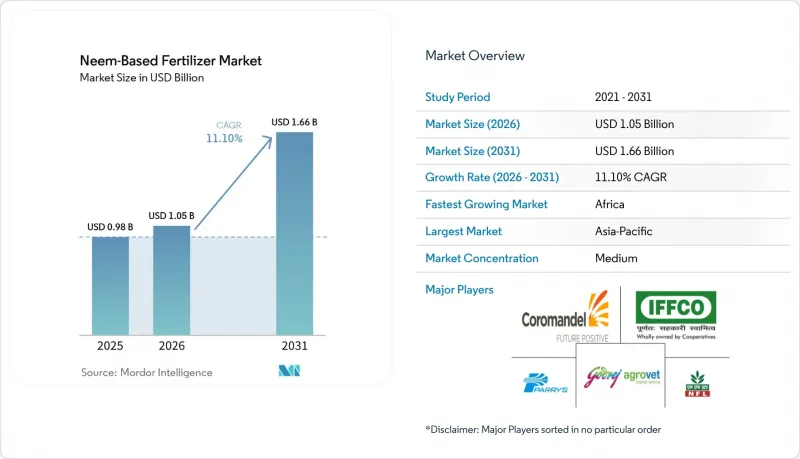
據 Mordor Intelligence 稱,2025 年印楝肥料市場價值 9.8 億美元,預計到 2026 年將成長至 10.5 億美元,到 2031 年將成長至 16.6 億美元,2026 年至 2031 年的複合年成長率為 11.1%。
本報告製劑形式(粉劑、顆粒劑、液體)、作物類型(穀物、油籽/豆類、其他)、施用方法(土壤施用、葉面噴布、其他)、分銷管道(直接銷售給農民、零售/分銷網路)和地區(北美、南美、歐洲、其他)進行細分。市場預測以美元計價。
全球印楝基肥料市場趨勢及洞察
政府對補貼氮肥中包膜尿素的義務
印度政府大力推廣印楝包膜尿素,推動了肥料生產中對印楝衍生農業原料的需求。根據印度政府新聞局(PIB)報告,印楝包膜尿素透過減緩土壤中氮的釋放,提高了氮肥的利用效率。這使得農民在獲得與傳統配方相當的產量的同時,尿素用量可減少約10%。目前,政府仍強制要求補貼尿素必須使用印楝包膜,肥料業對印楝衍生包膜材料的需求仍強勁。隨著生產商持續生產印楝包膜尿素以滿足農業需求,包括印楝油和印楝素在內的印楝衍生原料的需求預計將保持旺盛,從而支撐印楝基肥料市場的成長。
高附加價值園藝產業對有機作物保護劑的需求不斷成長。
高價值蔬果生產商正採用符合美國農業部國家有機計畫 (NOP) 和歐盟有機法規的印楝衍生材料,以獲得優質化的出口價格。生物來源肥料既能提供養分,又能起到輔助病蟲害防治作用,從而減少了單獨使用殺蟲劑的需求。 UPL有限公司計劃於2025年推出海藻衍生產品“HYCOXA”,預示著高階生物來源肥料這一細分市場的競爭將日益激烈。價格溢價抵消了每公頃投入成本的增加,尤其對於葡萄、番茄和辣椒更是如此。保護性耕作方式的日益普及也增強了全年需求的穩定性。
由於印楝產量易受氣候變遷影響,印楝素原料供應不穩定。
印楝基肥料市場的成長受到印楝種子供應不穩定的限制,而印楝種子是印楝基農產品中印楝素的主要原料。印楝的開花結果受季節性降雨和氣候條件的顯著影響,因此原料供應極易受到乾旱、季風不規則和極端天氣事件的影響。種子供應的波動會阻礙原料採購,推高萃取和加工成本,並為確保產品品質的穩定性帶來挑戰。這種供應的不確定性阻礙了生產的擴充性和盈利,從而限制了印楝基肥料市場的整體擴張。
細分市場分析
2025年,顆粒狀產品在印楝基肥料市場中佔最大佔有率,達46%。這是因為農民可以使用現有的撒播機和播種機來施用。這種形態的產品即使在潮濕的季風地區也具有極佳的保存期限,並最大限度地降低了倉儲過程中結塊的風險。顆粒狀產品在水稻、小麥和玉米種植系統中銷售強勁,這些作物佔亞洲和非洲耕地面積的大部分。包膜技術的創新提高了顆粒強度,並減少了處理過程中印楝素的損失。完善的經銷網路確保農村零售商始終備有顆粒狀產品,進一步提高了農民的購買便利性。
隨著保護性栽培和滴灌在缺水地區日益普及,液態肥料正以最快的速度成長,預計2031年將達到13.0%的複合年成長率。液態肥料可與自動化營養液輸注系統無縫整合,實現精準的分段施肥,並根據作物的氮吸收曲線進行個人化調整。與人工施肥相比,番茄、黃瓜和甜椒種植戶對液態肥料節省的勞動力表示讚賞。製造商正在投資乳化技術,以穩定濃縮印楝素並延長其保存期限。中東和南歐地區對施肥和灌溉基礎設施投資的增加,進一步擴大了液態肥料的潛在市場規模。
到2025年,穀類仍將佔據最大的市場佔有率,佔印楝基肥料市場規模的40%。這主要歸功於印度針對尿素(糧食生產的主要投入品)的強制性政策。尿素使用簡便,例如在水稻種植前攪動泥土,以及在小麥追肥時進行整體施用。政府的採購計畫確保了包膜尿素供應到公共分銷中心,確保了穩定的銷售。十多年來收集的產量響應數據增強了農民的信心,並維持了持續的重複購買週期。儘管市場佔有率有所下降,但預計該領域的絕對銷售量將繼續成長。
水果和蔬菜是成長最快的細分市場,預計2026年至2031年將以11.5%的複合年成長率成長,這主要得益於有機認證生產的擴張,以滿足消費者對出口產品的需求。雖然保護性栽培需要嚴格的營養管理,但印楝基材料也具有溫和的害蟲防治作用,並能降低化學殘留的風險。葡萄、莓果和綠葉的價格溢價使得每公頃生物來源肥料投入的增加成為合理之舉。記錄印楝使用情況的可追溯性項目有助於生產者連接區塊鏈檢驗的供應鏈。南美洲酪梨種植園和亞洲芒果種植園對印楝的廣泛應用進一步加速了市場需求。
區域分析
亞太地區是最大的市場,預計到2025年將佔印楝基肥料市場佔有率的45.3%。這主要得益於印度強制實施的尿素全覆蓋包膜政策,該政策每年創造了2,500萬噸的需求。在中國,由於溫室蔬菜和果園有機認證的推廣,需求進一步成長。儘管日本和韓國的市場規模較小,但由於超級市場優先考慮農藥殘留,因此印楝基肥料的價格仍然較高。 ICL集團計劃於2026年在馬哈拉斯特拉邦建設的特殊肥料廠將有助於該地區水溶性印楝基肥料的供應。印度持續推行的微灌補貼政策也促進了液態肥料的普及應用。
在非洲,肯亞、坦尚尼亞和奈及利亞預計將經歷最高的成長率,2026年至2031年間的複合年成長率將達到12.6%,這得益於捐助者支持的微型應用計畫從試點階段擴展到全國。當地的楝樹種子採集舉措正在擴大原料供應,並創造農村就業機會。南非的商業農場正在柑橘和葡萄園中使用楝樹衍生材料,以獲得歐洲的進口許可。北非的生產者正在採用緩釋產品來應對灌溉不足條件下的鹽鹼壓力。行動支付生態系統正在減少最後一公里支付的障礙,並刺激偏遠村莊的需求。
在歐洲和北美,有機農產品價格高昂以及對合成抑制劑的監管限制推動了其穩定成長。歐盟化肥產品法規為印度和以色列的供應商提供了統一的市場准入途徑,並降低了行政門檻。丹麥、荷蘭和德國已製定國家層級的養分徑流減少目標,並鼓勵傳統糧食農場採用印楝。在美國加州和佛羅裡達州,有機農場正在使用液態印楝濃縮液種植高價值漿果和綠葉蔬菜。在加拿大溫室蔬菜生產群集中,為了滿足超級市場的殘留物標準,液態印楝在施肥和灌溉中的使用量也不斷增加。
其他好處:
- Excel格式的市場預測(ME)表
- 3個月的分析師支持
目錄
第1章:引言
- 研究假設和市場定義
- 調查範圍
第2章:調查方法
第3章執行摘要
第4章 市場狀況
- 市場概覽
- 市場促進因素
- 政府對補貼氮肥中包膜尿素的義務
- 高附加價值園藝產業對有機農藥的需求日益成長。
- 歐洲加強對合成硝化抑制劑的監管
- 將微劑量療法推廣到非洲的小規模。
- 緩釋型印楝奈米載體的商業化
- 基於區塊鏈技術的原產地認證,為使用楝樹肥料種植的農產品提供溢價。
- 市場限制因素
- 由於印楝產量易受氣候變遷影響,印楝素原料的供應出現波動。
- 南亞以外地區缺乏農業推廣支持
- 成本績效、具競爭力的生物肥料混合物,含有海藻萃取物。
- 南美國家生物促效劑報名手續延誤
- 監理情勢
- 技術展望
- 波特五力分析
第5章 市場規模與成長預測
- 配方
- 粉末
- 顆粒
- 液體
- 按作物類型
- 穀類和穀類食品
- 油籽/豆類
- 水果和蔬菜
- 其他作物
- 透過應用方法
- 土壤施用
- 葉面噴布
- 施肥和灌溉
- 種子處理
- 透過分銷管道
- 直接聯絡農民
- 零售和經銷商網路
- 按地區
- 北美洲
- 美國
- 加拿大
- 墨西哥
- 其他北美國家
- 南美洲
- 巴西
- 阿根廷
- 其他南美國家
- 歐洲
- 德國
- 法國
- 英國
- 義大利
- 西班牙
- 俄羅斯
- 其他歐洲國家
- 亞太地區
- 中國
- 印度
- 日本
- 澳洲
- 韓國
- 其他亞太國家
- 中東
- 沙烏地阿拉伯
- 阿拉伯聯合大公國
- 其他中東國家
- 非洲
- 南非
- 奈及利亞
- 其他非洲國家
- 北美洲
第6章 競爭情勢
- 市場集中度
- 策略趨勢
- 市佔率分析
- 公司簡介
- Coromandel International Limited
- Indian Farmers Fertiliser Cooperative Limited
- National Fertilizers Limited
- EID Parry(India)Limited
- Godrej Agrovet Limited
- UPL Limited
- ICL Group Ltd
- Krishak Bharati Cooperative Limited
- NACL Industries Ltd
- NutriAg Group
- Valent Biosciences LLC
- Haifa Group
- Fortune Biotech Ltd
- Ozone Biotech
- PJ Margo Pvt Ltd
第7章 市場機會與未來展望
According to Mordor Intelligence, the neem-based fertilizer market size was valued at USD 0.98 billion in 2025 and is projected to grow from USD 1.05 billion in 2026 to USD 1.66 billion by 2031, growing at a CAGR of 11.1% from 2026 to 2031.
This report is Segmented by Formulation (Powder, Granular, and Liquid), by Crop Type (Cereals and Grains, Oilseeds and Pulses, and More), by Application Method (Soil Application, Foliar Spray, and More), by Distribution Channel (Direct -To-Farmer and Retail/Dealer Network), and by Geography (North America, South America, Europe, and More). The Market Forecasts are Provided in Terms of Value (USD).
Global Neem-Based Fertilizer Market Trends and Insights
Government Mandate on Neem-Coated Urea for Subsidized Nitrogen Fertilizers
India's emphasis on promoting neem-coated urea is driving demand for neem-derived agricultural inputs used in fertilizer production. According to the Press Information Bureau (PIB) of the Government of India, neem-coated urea enhances nitrogen-use efficiency by slowing the release of nitrogen in the soil. This allows farmers to achieve similar results while using approximately 10% less urea compared to conventional formulations. The policy mandating neem coating on subsidized urea remains active, sustaining significant consumption of neem-based coating materials within the fertilizer industry. As manufacturers continue producing neem-coated urea to meet agricultural needs, the demand for neem-derived inputs, including neem oil and azadirachtin, is expected to remain robust, supporting growth in the neem-based fertilizer market.
Growing Demand for Organic Crop Protection in High-Value Horticulture
Fruit and vegetable growers seeking premium export prices adopt neem inputs that comply with the United States Department of Agriculture National Organic Program and the European Union organic regulation. Biological fertilizers provide both nutrient delivery and secondary pest suppression, reducing the need for separate insecticide applications. UPL Limited launched the seaweed-based HYCOXA in 2025, signaling intensified competition within premium biological niches. Price premiums offset higher per-hectare input costs, especially for grapes, tomatoes, and peppers. Wider acceptance in protected agriculture strengthens year-round demand consistency.
Volatile Supply of Azadirachtin Feedstock Due to Climate-Sensitive Neem Yields
The growth of the neem-based fertilizer market is limited by the inconsistent availability of neem seeds, which are the primary source of azadirachtin used in neem-based agricultural products. The flowering and fruiting of neem trees are heavily influenced by seasonal rainfall and climatic conditions, making the feedstock supply susceptible to droughts, irregular monsoons, and extreme weather events. Variations in seed availability can disrupt raw material procurement, raise extraction and processing costs, and pose challenges in ensuring consistent product quality. These supply uncertainties hinder production scalability and profitability, restricting the overall expansion of the neem-based fertilizer market.
Other drivers and restraints analyzed in the detailed report include:
- Rising Restrictions on Synthetic Nitrification Inhibitors in Europe
- Increasing Smallholder Adoption via Micro-Dosing Programs in Africa
- Limited Agronomic Extension Support Outside South Asia
For complete list of drivers and restraints, kindly check the Table Of Contents.
Segment Analysis
Granular products commanded the largest 46% share of the neem-based fertilizer market in 2025 because farmers can apply them with existing broadcast spreaders and seed drills. The format stores well in humid monsoon zones and faces minimal caking risk during warehouse storage. Granular sales remain strong in rice, wheat, and maize systems that dominate Asian and African acreage. Coating technology innovations improve granule integrity, limiting azadirachtin loss during handling. Established dealer networks keep granular shelves stocked in rural outlets, reinforcing farmer familiarity.
Liquid formulations are advancing at the fastest 13.0% CAGR through 2031 as drip irrigation widens across protected horticulture and water-scarce regions. Liquids integrate seamlessly with automated nutrient injection, allowing precise split applications that match crop nitrogen uptake curves. Growers of tomatoes, cucumbers, and bell peppers value the lower labor requirement compared with manual broadcasting. Manufacturers invest in emulsification techniques that stabilize azadirachtin in concentrate form, extending shelf life. Rising fertigation infrastructure investment in the Middle East and Southern Europe further expands the addressable base for liquid products.
Cereals and grains retained the largest 40% of the neem-based fertilizer market size in 2025, as India's mandatory policy targets urea, a cereal input staple. Broadcast application during rice puddling and wheat top-dressing offers straightforward integration. Government procurement programs channel coated urea to public distribution outlets, ensuring consistent offtake. Yield response data collected over a decade reinforces farmer confidence, sustaining repeat purchase cycles. The segment will keep adding absolute volume even as its proportional share tilts downward.
Fruits and vegetables represent the fastest-expanding segment, with a 11.5% CAGR during 2026-2031, as organic-certified production grows for export consumers. Protected cultivation requires tight nutrient management, and neem inputs double as mild pest suppressants, reducing chemical residue risk. Price premiums on grapes, berries, and leafy greens justify higher per-hectare spending on biological fertilizers. Traceability programs that record neem usage help growers access blockchain-verified supply chains. Rising adoption in South American avocado and Asian mango orchards further accelerates demand.
Complete Report Scope:
- By Formulation
- Powder
- Granular
- Liquid
- By Crop Type
- Cereals and Grains
- Oilseeds and Pulses
- Fruits and Vegetables
- Other Crops
- By Application Method
- Soil Application
- Foliar Spray
- Fertigation
- Seed Treatment
- By Distribution Channel
- Direct-To-Farmer
- Retail/Dealer Network
- By Geography
- North America
- United States
- Canada
- Mexico
- Rest of North America
- South America
- Brazil
- Argentina
- Rest of South America
- Europe
- Germany
- France
- United Kingdom
- Italy
- Spain
- Russia
- Rest of Europe
- Asia-Pacific
- China
- India
- Japan
- Australia
- South Korea
- Rest of Asia-Pacific
- Middle East
- Saudi Arabia
- United Arab Emirates
- Rest of Middle East
- Africa
- South Africa
- Nigeria
- Rest of Africa
- North America
Geography Analysis
Asia-Pacific is the largest geography, accounting for 45.3% of the neem-based fertilizer market share in 2025, driven by India's full urea-coating mandate, which locks in annual demand for 25 million metric tons of production. China's push for organic certification in greenhouse vegetables and fruit orchards adds incremental offtake. Japan and South Korea, although smaller, command premium pricing on residue-conscious supermarket channels. ICL Group's 2026 specialty fertilizer plant in Maharashtra underpins the regional supply of water-soluble neem blends. Ongoing subsidies for micro-irrigation in India stimulate the uptake of liquid formulations.
Africa posts the fastest 12.6% CAGR forecast for 2026-2031 as donor-sponsored micro-dosing programs scale from pilot to national coverage in Kenya, Tanzania, and Nigeria. Local neem seed collection initiatives expand raw-material supply and create rural employment. Commercial estates in South Africa adopt neem inputs in citrus and grape orchards to secure European import clearances. North African growers adopt controlled-release products to manage salinity stress under deficit irrigation. Mobile-money ecosystems ease last-mile payment frictions, unlocking demand in remote villages.
Europe and North America grow steadily on the back of organic produce premiums and regulatory limits on synthetic inhibitors. The European Union Fertilizing Products Regulation provides a harmonized route to market, lowering administrative hurdles for Indian and Israeli suppliers. Denmark, the Netherlands, and Germany showcase national nutrient-loss reduction targets that nudge adoption in conventional cereal farms. United States organic acreage in California and Florida absorbs liquid neem concentrates for high-value berries and leafy greens. Canada's greenhouse vegetable cluster increasingly uses neem liquids in fertigation to meet supermarket residue specifications.
- Coromandel International Limited
- Indian Farmers Fertiliser Cooperative Limited
- National Fertilizers Limited
- E.I.D. Parry (India) Limited
- Godrej Agrovet Limited
- UPL Limited
- ICL Group Ltd
- Krishak Bharati Cooperative Limited
- NACL Industries Ltd
- NutriAg Group
- Valent Biosciences LLC
- Haifa Group
- Fortune Biotech Ltd
- Ozone Biotech
- PJ Margo Pvt Ltd
Additional Benefits:
- The market estimate (ME) sheet in Excel format
- 3 months of analyst support
TABLE OF CONTENTS
1 Introduction
- 1.1 Study Assumptions and Market Definition
- 1.2 Scope of the Study
2 Research Methodology
3 Executive Summary
4 Market Landscape
- 4.1 Market Overview
- 4.2 Market Drivers
- 4.2.1 Government mandate on neem-coated urea for subsidized nitrogen fertilizers
- 4.2.2 Growing demand for organic crop protection in high-value horticulture
- 4.2.3 Rising restrictions on synthetic nitrification inhibitors in Europe
- 4.2.4 Increasing smallholder adoption via micro-dosing programs in Africa
- 4.2.5 Commercial roll-out of controlled-release neem nanocarriers
- 4.2.6 Blockchain-enabled provenance premiums for neem-fertilized produce
- 4.3 Market Restraints
- 4.3.1 Volatile supply of azadirachtin feedstock due to climate-sensitive neem yields
- 4.3.2 Limited agronomic extension support outside South Asia
- 4.3.3 Competing cost-effective bio-fertilizer blends with seaweed extracts
- 4.3.4 Slow registration timelines for biostimulants in South American countries
- 4.4 Regulatory Landscape
- 4.5 Technological Outlook
- 4.6 Porter's Five Forces Analysis
- 4.6.1 Threat of New Entrants
- 4.6.2 Bargaining Power of Suppliers
- 4.6.3 Bargaining Power of Buyers
- 4.6.4 Threat of Substitutes
- 4.6.5 Intensity of Competitive Rivalry
5 Market Size and Growth Forecasts (Value)
- 5.1 By Formulation
- 5.1.1 Powder
- 5.1.2 Granular
- 5.1.3 Liquid
- 5.2 By Crop Type
- 5.2.1 Cereals and Grains
- 5.2.2 Oilseeds and Pulses
- 5.2.3 Fruits and Vegetables
- 5.2.4 Other Crops
- 5.3 By Application Method
- 5.3.1 Soil Application
- 5.3.2 Foliar Spray
- 5.3.3 Fertigation
- 5.3.4 Seed Treatment
- 5.4 By Distribution Channel
- 5.4.1 Direct-To-Farmer
- 5.4.2 Retail/Dealer Network
- 5.5 By Geography
- 5.5.1 North America
- 5.5.1.1 United States
- 5.5.1.2 Canada
- 5.5.1.3 Mexico
- 5.5.1.4 Rest of North America
- 5.5.2 South America
- 5.5.2.1 Brazil
- 5.5.2.2 Argentina
- 5.5.2.3 Rest of South America
- 5.5.3 Europe
- 5.5.3.1 Germany
- 5.5.3.2 France
- 5.5.3.3 United Kingdom
- 5.5.3.4 Italy
- 5.5.3.5 Spain
- 5.5.3.6 Russia
- 5.5.3.7 Rest of Europe
- 5.5.4 Asia-Pacific
- 5.5.4.1 China
- 5.5.4.2 India
- 5.5.4.3 Japan
- 5.5.4.4 Australia
- 5.5.4.5 South Korea
- 5.5.4.6 Rest of Asia-Pacific
- 5.5.5 Middle East
- 5.5.5.1 Saudi Arabia
- 5.5.5.2 United Arab Emirates
- 5.5.5.3 Rest of Middle East
- 5.5.6 Africa
- 5.5.6.1 South Africa
- 5.5.6.2 Nigeria
- 5.5.6.3 Rest of Africa
- 5.5.1 North America
6 Competitive Landscape
- 6.1 Market Concentration
- 6.2 Strategic Moves
- 6.3 Market Share Analysis
- 6.4 Company Profiles (Includes Global Level Overview, Market Level Overview, Core Segments, Financials as Available, Strategic Information, Market Rank/Share for Key Companies, Products and Services, and Recent Developments)
- 6.4.1 Coromandel International Limited
- 6.4.2 Indian Farmers Fertiliser Cooperative Limited
- 6.4.3 National Fertilizers Limited
- 6.4.4 E.I.D. Parry (India) Limited
- 6.4.5 Godrej Agrovet Limited
- 6.4.6 UPL Limited
- 6.4.7 ICL Group Ltd
- 6.4.8 Krishak Bharati Cooperative Limited
- 6.4.9 NACL Industries Ltd
- 6.4.10 NutriAg Group
- 6.4.11 Valent Biosciences LLC
- 6.4.12 Haifa Group
- 6.4.13 Fortune Biotech Ltd
- 6.4.14 Ozone Biotech
- 6.4.15 PJ Margo Pvt Ltd
7 Market Opportunities and Future Outlook

 以固氮菌的生物肥料市場-2026-2032年全球市場預測生物肥料市場-2026-2032年全球市場預測
 生物肥料市場預測至2034年—按產品類型、作物類型、微生物、配方、應用方法和地區分類的全球分析
 基於固氮菌的生物肥料市場規模、佔有率和成長分析:按產品形式、作物類型、應用方法、最終用戶、銷售管道、分銷通路和地區分類-2026-2033年產業預測
 全球生物肥料市場:按類型、原料、應用方法、形態、作物類型和地區分類-預測至2031年
 2026年全球生物肥料市場報告2034年生物肥料接種劑市場預測-按產品類型、微生物類型、配方類型、應用方法、作物類型、通路和地區分類的全球分析
 生物肥料市場規模、佔有率、趨勢和預測:按類型、作物、微生物、應用方法和地區分類,2026-2034年
 生物有機肥料:市場佔有率分析、產業趨勢與統計、成長預測(2026-2031)
 生物肥料市場規模、佔有率、成長及全球產業分析:按類型和應用分類,區域洞察及2026-2034年預測