


 |
市場調查報告書
商品編碼
2072667
第三方風險管理:市場佔有率分析、產業趨勢與統計、成長預測(2026-2031)Third-Party Risk Management - Market Share Analysis, Industry Trends & Statistics, Growth Forecasts (2026 - 2031) |
||||||

※ 本網頁內容可能與最新版本有所差異。詳細情況請與我們聯繫。
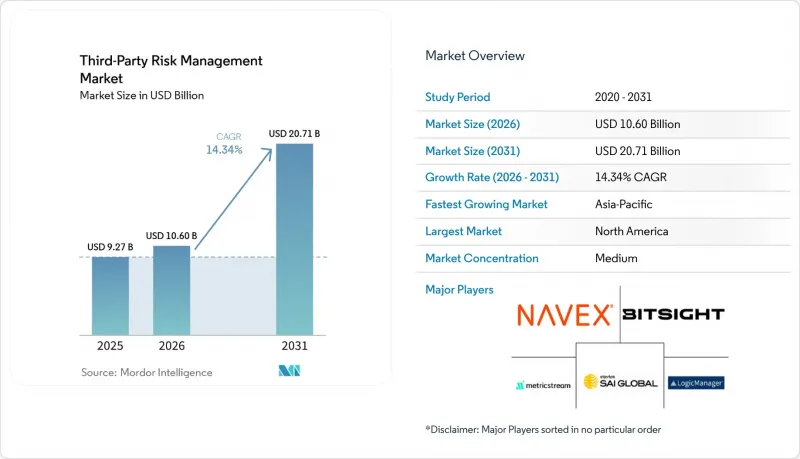
據 Mordor Intelligence 稱,第三方風險管理市場在 2025 年的價值為 92.7 億美元,預計到 2031 年將從 2026 年的 106 億美元成長到 207.1 億美元,在預測期(2026-2031 年)內的複合年成長率為 14.34%。
本報告按組件(解決方案和服務)、部署模式(雲端和本地部署)、組織規模(大型企業和中小企業)、最終用戶產業(銀行、金融服務和保險、IT和電信、醫療保健和生命科學、政府和國防、零售和消費品等)以及地區進行細分。市場預測以價值(美元)表示。
全球第三方風險管理市場趨勢及洞察
第三方網路攻擊和勒索軟體風險日益加劇
攻擊者正日益將目標對準供應商。這是因為一旦某個供應商遭到入侵,就可能打開通往眾多客戶環境的入口,加劇了第三方風險管理市場的迫切性。根據Verizon發布的《2026年資料外洩調查報告》,30%的已確認資料外洩事件涉及第三方,較前一年大幅增加。近年來,大規模供應鏈和第三方資料外洩事件也激增,顯示與供應商相關的風險正成為企業網路風險的常態。 Black Kite的報告顯示,每次第三方資料外洩事件的平均下游受害者人數從2024年的2.56人增加到2025年的5.28人。這反映了當前安全問題正在整個互聯生態系統中蔓延的現實。此外,SecurityScorecard的一項研究發現,41.4%的勒索軟體攻擊源自第三方,這一趨勢正促使更多產業在第三方風險管理市場中實施正式的供應商監控計畫。
加強對數位韌性和外包的監管
由於第三方監管如今被視為一種檢驗且可審計的控制機制,監管正成為第三方風險管理市場支出最強而有力的促進因素之一。 DORA於2025年1月17日生效,強制要求歐盟金融機構維護資訊登記冊,在關鍵資訊通訊技術合約中加入最低安全條款,並持續監控集中風險。 2025年12月,巴塞爾委員會發布了《第三方風險管理健全原則》,提高了銀行業供應商管治和持續監控的全球標準。監管措施正擴展到歐洲以外,日本金融廳於2026年4月發布了一份研究報告,調查了美國、歐盟和英國先進的第三方風險管理(TPCRM)實踐。此外,2025 年 10 月,紐約州金融服務部發布了關於第三方服務供應商風險的指導意見,重申了第三方風險管理市場需要有據可查和基於證據的監督。
孤立的風險管理系統實施和整合成本高昂。
第三方風險管理(TPRM)平台仍然是第三方風險管理市場推廣應用的一大障礙,因為許多採購公司必須整合採購、企業資源規劃(ERP)、合約管理和治理、風險與合規(GRC)系統,而這些系統並非基於通用資料結構建構。 Whist 的一份報告顯示,到 2025 年,TPRM 團隊平均將增加三名全職員工,每位全職員工的成本為 10.9 萬美元,但 94% 的公司仍然表示無法評估所有需要審核的供應商。這一差距表明,如果人員配備、流程設計和資料清理不足,僅靠軟體投資無法解決覆蓋範圍問題。對於小規模的採購公司而言,負擔更為沉重,第一年的平台成本、設定費用和人事費用可能高達 4 萬至 8 萬美元,這將延遲它們正式進入第三方風險管理市場。因此,儘管反應速度較慢且審計證據的可靠性降低,許多組織仍然依賴電子表格和不完整的流程。
細分市場分析
到2025年,解決方案將佔第三方風險管理市場61.23%的佔有率,這表明買家在核心供應商管治方面仍然傾向於平台主導模式。解決方案仍然至關重要,因為企業希望在單一營運層內識別、評估、管理工作流程並報告風險,而不是分散在多個互不協調的工具中。隨著企業從時點評估轉向對供應商環境的持續監控,解決方案中最強勁的需求正轉向持續監控和智慧分析能力。風險識別、實質審查和評估/評分工具仍然是應用最廣泛的層級,因為它們直接滿足了第三方風險管理市場中的審計需求、新供應商入駐管理和證據收集要求。
服務領域是成長最快的領域,第三方風險管理市場中的服務部分預計將在2026年至2031年間以14.67%的複合年成長率成長。由於許多組織仍需要外部協助進行調查問卷管理、實質審查實施、糾正措施追蹤和供應商跟進,因此對專業服務服務和託管服務的需求很高。此外,企業希望保留內部的政策所有權和升級權限,也推動了第三方風險管理產業混合營運模式的興起。同時,以技術主導的新興參與企業銷售基於訂閱的生命週期解決方案,也對託管服務產生了日益成長的興趣,這給第三方風險管理市場中成長緩慢、以專案為中心的交付模式帶來了壓力。
預計到2025年,雲端將佔據第三方風險管理市場57.45%的佔有率,並且是成長最快的部署模式,到2031年複合年成長率將達到14.89%。這顯示第三方風險管理市場並非逐步轉向SaaS部署,而是已趨向於基於SaaS的整合。雲端工具受到大中型買家的青睞,因為它們可以降低基礎架構開銷、加快部署速度,並支援內容、工作流程和整合功能的頻繁更新。這種買家邏輯正在幫助供應商擴大其在第三方風險管理市場的覆蓋範圍,而不受地理或客戶規模的限制。
本地部署解決方案仍佔據重要地位。這是因為一些受監管的金融機構和國防機構仍然要求對資料儲存位置和本地處理進行更嚴格的控制。因此,第三方風險管理市場關於採用新方案的討論,與其說是著眼於替換現有系統,不如說是如何將不同的工作負載分配到不同的環境。此外,多重雲端供應商生態系統增加了對第三方的依賴,而雲端遷移本身雖然實現了平台交付,但也增加了客戶必須監控的供應商風險。因此,許多採購公司在雲端維護監控功能,同時將敏感的供應商記錄儲存在本地,這構成了第三方風險管理產業混合模式的基礎。
區域分析
2025年,北美地區佔據了第三方風險管理市場佔有率的38.56%。這主要歸功於嚴格的監管、成熟的安全支出以及專業供應商的集中。尤其是在美國,隨著受監管行業從定期檢查清單轉向對服務供應商的持續監督,對持續監控的需求尤其旺盛。紐約州金融服務部(NYDFS)於2025年10月發布的修訂版指南進一步強化了這一趨勢,將第三方管治列為許可營業單位的首要任務之一。隨著跨境供應鏈和近岸營運模式對母公司和關鍵服務供應商提出了新的監管要求,加拿大和墨西哥在第三方風險管理市場的重要性也日益凸顯。
歐洲仍然是第三方風險管理市場第二大區域集團,並且在短期內經歷了最快速的監管加速。 DORA於2025年1月17日在歐盟範圍內生效,對資訊通訊技術第三方註冊、合約條款、集中風險監控和關鍵提供者監管提出了詳細要求。 2025年11月,歐洲監管架構進一步完善,首批關鍵第三方提供者正式納入監管範圍。這正在改變金融機構在第三方風險管理市場中建立專案和文件的方式。德國和英國仍然是最大的國內需求中心,而法國、義大利、荷蘭和西班牙則在金融以外的各個領域持續推動合規主導應用。
亞太地區是第三方風險管理 (TPCRM) 市場成長最快的地區,預計 2026 年至 2031 年的複合年成長率 (CAGR) 將達到 14.78%。中國、印度和日本是最大的需求來源,這主要得益於數位化供應鏈的擴張以及針對第三方網路風險的監管預期的正式確立。 2026 年 4 月,日本金融廳發布了一份研究報告,調查了海外先進的 TPCRM 實踐。同時,根據 SecurityScorecard 的數據,在 2025 年分析的國家中,新加坡的第三方資料外洩率最高,達 71.4%。在南美洲、中東和非洲,儘管目前的市場規模仍然較小,但隨著企業買家對隱私法、雲端管治和供應鏈安全的預期日益明確,第三方風險管理市場正在不斷擴張。
其他好處:
- Excel格式的市場預測(ME)表
- 3個月的分析師支持
目錄
第1章:引言
- 研究假設和市場定義
- 調查範圍
第2章:調查方法
第3章執行摘要
第4章 市場狀況
- 市場概覽
- 宏觀經濟因素對市場的影響
- 市場促進因素
- 第三方網路攻擊加劇,勒索軟體攻擊風險增加。
- 加強對數位韌性和外包的監管
- 擴展雲端和SaaS環境中的供應商生態系統
- 從定期審查到持續監控和自動化
- 識別第N方及集中風險的需求日益成長。
- 人工智慧模型、資料和服務供應商的管治義務
- 市場限制因素
- 孤立的風險管理系統實施和整合成本高昂。
- 資料品質、隱私和跨境資訊共用的限制
- 對靜態調查的信心不足,且證據品質參差不齊。
- 採購、安保、法律和合規部門之間的所有權分配。
- 產業價值鏈分析
- 監理情勢
- 技術展望
- 波特五力分析
第5章 市場規模與成長預測
- 按組件
- 解決方案
- 風險識別和實質審查
- 風險評估和評分
- 持續監控與情報
- 工作流程、糾正措施和報告
- 服務
- 專業服務
- 託管服務
- 解決方案
- 按部署模式
- 雲
- 現場
- 按組織規模
- 大公司
- 小型企業
- 按最終用戶行業分類
- BFSI
- 資訊科技/通訊
- 醫療保健和生命科學
- 政府/國防
- 零售和消費品
- 製造業
- 能源公用事業
- 其他終端用戶產業
- 按地區
- 北美洲
- 美國
- 加拿大
- 墨西哥
- 南美洲
- 巴西
- 阿根廷
- 智利
- 其他南美國家
- 歐洲
- 德國
- 英國
- 法國
- 義大利
- 西班牙
- 荷蘭
- 俄羅斯
- 其他歐洲國家
- 亞太地區
- 中國
- 日本
- 印度
- 韓國
- 新加坡
- 其他亞太國家
- 中東
- 沙烏地阿拉伯
- 阿拉伯聯合大公國
- 土耳其
- 其他中東國家
- 非洲
- 南非
- 奈及利亞
- 肯亞
- 其他非洲國家
- 北美洲
第6章 競爭情勢
- 市場集中度
- 策略趨勢
- 市佔率分析
- 公司簡介
- Archer Technologies, LLC
- Aravo Solutions, Inc.
- BitSight Technologies, Inc.
- Diligent Corporation
- Genpact Limited
- International Business Machines Corporation
- KPMG LLP
- LogicManager, Inc.
- MetricStream, Inc.
- Mitratech Holdings, Inc.
- NAVEX Global, Inc.
- OneTrust, LLC
- Panorays Ltd.
- ProcessUnity, Inc.
- Resolver Inc.
- Intertek SAI Global Pty Limited
- SecurityScorecard, Inc.
- ServiceNow, Inc.
- UpGuard, Inc.
- Venminder, Inc.
第7章 市場機會與未來展望
According to Mordor Intelligence, the third-party risk management market was valued at USD 9.27 billion in 2025 and is estimated to grow from USD 10.60 billion in 2026 to reach USD 20.71 billion by 2031, at a CAGR of 14.34% during the forecast period (2026-2031).
This report is Segmented by Component (Solutions, and Services), Deployment Model (Cloud, and On-Premises), Organization Size (Large Enterprises, and Small and Medium-Sized Enterprises), End User Industry (BFSI, IT and Telecom, Healthcare and Life Sciences, Government and Defense, Retail and Consumer Goods, and More), and Geography. The Market Forecasts are Provided in Terms of Value (USD).
Global Third-Party Risk Management Market Trends and Insights
Escalating Third-Party Cyberattacks and Ransomware Exposure
Attackers now target vendors more often because one compromised supplier can open paths into many customer environments, and that is raising urgency across the third-party risk management market. Third-party involvement appeared in 30% of confirmed breaches in the Verizon 2026 Data Breach Investigations Report, which marked a sharp increase from the prior year. Large supply-chain and third-party compromises also rose sharply in recent years, which shows that vendor-linked exposure is becoming a durable part of enterprise cyber risk. Black Kite reported that the average number of downstream victims per third-party breach increased to 5.28 in 2025 from 2.56 in 2024, which reflects how failures now spread across connected ecosystems. SecurityScorecard also found that 41.4% of ransomware attacks originated through third-party vectors, and that pattern is pulling more sectors into formal vendor oversight programs within the third-party risk management market.
Tightening Digital Resilience and Outsourcing Regulations
Regulation is becoming one of the strongest spending triggers in the third-party risk management market because third-party oversight is now treated as a control that can be tested and audited. DORA entered application on January 17, 2025, and it requires EU financial entities to maintain a Register of Information, include minimum security clauses in critical ICT contracts, and monitor concentration risk on an ongoing basis. The Basel Committee published its Principles for the Sound Management of Third-Party Risk in December 2025, which raised the global baseline for banking-sector vendor governance and ongoing monitoring. Regulatory momentum is also spreading beyond Europe, as Japan's Financial Services Agency published a research report in April 2026 to study advanced TPCRM practices in the United States, the European Union, and the United Kingdom. New York's Department of Financial Services added further pressure in October 2025 with guidance on third-party service provider risk, reinforcing the need for documented and evidence-based oversight in the third-party risk management market.
High Implementation and Integration Costs Across Siloed Risk Stacks
Implementation remains a real barrier in the third-party risk management market because many buyers must connect TPRM platforms with procurement, ERP, contract management, and GRC systems that were not built around a shared data structure. Whistic reported that TPRM teams added an average of 3 full-time employees in 2025 at USD 109,000 per FTE, while 94% still said they could not assess all the vendors they wanted to review. That gap shows that software spend alone does not solve coverage problems when staffing, process design, and data cleanup are weak. The burden is heavier for smaller buyers, where first-year platform, setup, and labor costs can reach USD 40,000 to USD 80,000 and delay formal adoption in the third-party risk management market. As a result, many organizations continue to rely on spreadsheets or partial workflows, even when those approaches create slower response times and weaker audit evidence.
Other drivers and restraints analyzed in the detailed report include:
- Expanding Vendor Ecosystems Across Cloud and SaaS Environments
- Shift From Periodic Reviews to Continuous Monitoring and Automation
For complete list of drivers and restraints, kindly check the Table Of Contents.
Segment Analysis
Solutions accounted for 61.23% of the third-party risk management market in 2025, which shows that buyers still prefer platform-led models for core vendor governance. Solutions remain central because enterprises want risk identification, scoring, workflow management, and reporting inside one operating layer rather than across disconnected tools. The strongest demand inside solutions is shifting toward continuous monitoring and intelligence features, as organizations move away from point-in-time assessments and toward persistent surveillance of vendor conditions. Risk identification and due diligence, along with assessment and scoring tools, still form the most widely adopted layers because they align directly with audit needs, onboarding controls, and evidence collection requirements in the third-party risk management market.
Services is the fastest-growing component, with the third-party risk management market size for services projected to expand at a CAGR of 14.67% from 2026 to 2031. Professional and managed services are gaining ground because many organizations still need outside support for questionnaire administration, due diligence execution, remediation tracking, and vendor follow-up. That demand is rising even where companies want to keep policy ownership and escalation authority in-house, which supports blended operating models across the third-party risk management industry. Managed offerings are also drawing interest from technology-led entrants that sell subscription-based lifecycle coverage, and that is putting pressure on project-heavy delivery models that scale more slowly in the third-party risk management market.
Cloud held 57.45% of the third-party risk management market share in 2025 and is also the fastest-growing deployment model, with a 14.89% CAGR through 2031. That combination shows that the third-party risk management market is consolidating around SaaS delivery rather than gradually shifting toward it. Cloud tools appeal to large enterprises and mid-sized buyers because they reduce infrastructure overhead, speed deployment, and support frequent updates to content, workflows, and integrations. The same buyer logic is helping vendors widen coverage across regions and customer sizes in the third-party risk management market.
On-premises remains relevant because some regulated financial institutions and defense organizations still require tighter control over data residency and local processing. That makes the deployment discussion less about replacement and more about how different workloads are split across environments in the third-party risk management market. Multi-cloud vendor ecosystems also create more third-party exposure, so the same cloud shift that enables platform delivery is also increasing the amount of vendor risk that customers must monitor. Many buyers are therefore keeping monitoring intelligence in the cloud while storing sensitive vendor records locally, which supports hybrid models across the third-party risk management industry.
Complete Report Scope:
- By Component
- Solutions
- Risk Identification and Due Diligence
- Risk Assessment and Scoring
- Continuous Monitoring and Intelligence
- Workflow, Remediation, and Reporting
- Services
- Professional Services
- Managed Services
- Solutions
- By Deployment Model
- Cloud
- On-premises
- By Organization Size
- Large Enterprises
- Small and Medium-Sized Enterprises
- By End User Industry
- BFSI
- IT and Telecom
- Healthcare and Life Sciences
- Government and Defense
- Retail and Consumer Goods
- Manufacturing
- Energy and Utilities
- Other End User Industries
- By Geography
- North America
- United States
- Canada
- Mexico
- South America
- Brazil
- Argentina
- Chile
- Rest of South America
- Europe
- Germany
- United Kingdom
- France
- Italy
- Spain
- Netherlands
- Russia
- Rest of Europe
- Asia-Pacific
- China
- Japan
- India
- South Korea
- Singapore
- Rest of Asia-Pacific
- Middle East
- Saudi Arabia
- United Arab Emirates
- Turkey
- Rest of Middle East
- Africa
- South Africa
- Nigeria
- Kenya
- Rest of Africa
- North America
Geography Analysis
North America accounted for 38.56% of the third-party risk management market share in 2025, supported by dense regulation, mature security spending, and a strong concentration of specialist vendors. The United States has shown especially strong demand for continuous monitoring because regulated sectors are moving beyond periodic checklist reviews and toward ongoing oversight of service providers. Updated NYDFS guidance issued in October 2025 reinforced that direction and kept third-party governance high on the agenda for licensed entities. Canada and Mexico are also becoming more relevant to the third-party risk management market as cross-border supply chains and nearshore operating models create new oversight requirements for parent companies and critical service providers.
Europe remained the second-largest regional block in the third-party risk management market and faced the sharpest near-term regulatory acceleration. DORA entered application across the European Union on January 17, 2025, and it introduced detailed requirements for ICT third-party registers, contractual provisions, concentration risk monitoring, and oversight of critical providers. In November 2025, the European supervisory framework moved further as the first cohort of critical third-party providers came under formal oversight, which is changing how financial entities structure programs and documentation in the third-party risk management market. Germany and the United Kingdom remain the largest national demand centers, while France, Italy, the Netherlands, and Spain continue to add compliance-led adoption across sectors beyond finance.
Asia-Pacific is the fastest-growing geography in the third-party risk management market, with a CAGR of 14.78% expected from 2026 to 2031. China, India, and Japan represent the largest demand pools, as digital supply chains broaden and regulators start to formalize expectations around third-party cyber risk. Japan's Financial Services Agency published a research report in April 2026 to study advanced TPCRM practices abroad, while SecurityScorecard found that Singapore recorded the highest third-party breach rate at 71.4% among the countries it analyzed in 2025. South America, the Middle East, and Africa remain smaller in current value, but the third-party risk management market is expanding there as privacy law enforcement, cloud governance, and supply-chain security expectations become more formal across enterprise buyers.
- Archer Technologies, LLC
- Aravo Solutions, Inc.
- BitSight Technologies, Inc.
- Diligent Corporation
- Genpact Limited
- International Business Machines Corporation
- KPMG LLP
- LogicManager, Inc.
- MetricStream, Inc.
- Mitratech Holdings, Inc.
- NAVEX Global, Inc.
- OneTrust, LLC
- Panorays Ltd.
- ProcessUnity, Inc.
- Resolver Inc.
- Intertek SAI Global Pty Limited
- SecurityScorecard, Inc.
- ServiceNow, Inc.
- UpGuard, Inc.
- Venminder, Inc.
Additional Benefits:
- The market estimate (ME) sheet in Excel format
- 3 months of analyst support
TABLE OF CONTENTS
1 INTRODUCTION
- 1.1 Study Assumptions and Market Definition
- 1.2 Scope of the Study
2 RESEARCH METHODOLOGY
3 EXECUTIVE SUMMARY
4 MARKET LANDSCAPE
- 4.1 Market Overview
- 4.2 Impact of Macroeconomic Factors on the Market
- 4.3 Market Drivers
- 4.3.1 Escalating Third-Party Cyberattacks and Ransomware Exposure
- 4.3.2 Tightening Digital Resilience and Outsourcing Regulations
- 4.3.3 Expanding Vendor Ecosystems Across Cloud and SaaS Environments
- 4.3.4 Shift From Periodic Reviews to Continuous Monitoring and Automation
- 4.3.5 Rising Need to Map Nth-Party and Concentration Risk
- 4.3.6 AI Governance Obligations for Model, Data, and Service Providers
- 4.4 Market Restraints
- 4.4.1 High Implementation and Integration Costs Across Siloed Risk Stacks
- 4.4.2 Data Quality, Privacy, and Cross-Border Information Sharing Constraints
- 4.4.3 Low Trust in Static Questionnaires and Inconsistent Evidence Quality
- 4.4.4 Fragmented Ownership Across Procurement, Security, Legal, and Compliance
- 4.5 Industry Value Chain Analysis
- 4.6 Regulatory Landscape
- 4.7 Technological Outlook
- 4.8 Porter's Five Forces Analysis
- 4.8.1 Threat of New Entrants
- 4.8.2 Bargaining Power of Buyers
- 4.8.3 Bargaining Power of Suppliers
- 4.8.4 Threat of Substitutes
- 4.8.5 Competitive Rivalry
5 MARKET SIZE AND GROWTH FORECASTS (VALUE)
- 5.1 By Component
- 5.1.1 Solutions
- 5.1.1.1 Risk Identification and Due Diligence
- 5.1.1.2 Risk Assessment and Scoring
- 5.1.1.3 Continuous Monitoring and Intelligence
- 5.1.1.4 Workflow, Remediation, and Reporting
- 5.1.2 Services
- 5.1.2.1 Professional Services
- 5.1.2.2 Managed Services
- 5.1.1 Solutions
- 5.2 By Deployment Model
- 5.2.1 Cloud
- 5.2.2 On-premises
- 5.3 By Organization Size
- 5.3.1 Large Enterprises
- 5.3.2 Small and Medium-Sized Enterprises
- 5.4 By End User Industry
- 5.4.1 BFSI
- 5.4.2 IT and Telecom
- 5.4.3 Healthcare and Life Sciences
- 5.4.4 Government and Defense
- 5.4.5 Retail and Consumer Goods
- 5.4.6 Manufacturing
- 5.4.7 Energy and Utilities
- 5.4.8 Other End User Industries
- 5.5 By Geography
- 5.5.1 North America
- 5.5.1.1 United States
- 5.5.1.2 Canada
- 5.5.1.3 Mexico
- 5.5.2 South America
- 5.5.2.1 Brazil
- 5.5.2.2 Argentina
- 5.5.2.3 Chile
- 5.5.2.4 Rest of South America
- 5.5.3 Europe
- 5.5.3.1 Germany
- 5.5.3.2 United Kingdom
- 5.5.3.3 France
- 5.5.3.4 Italy
- 5.5.3.5 Spain
- 5.5.3.6 Netherlands
- 5.5.3.7 Russia
- 5.5.3.8 Rest of Europe
- 5.5.4 Asia-Pacific
- 5.5.4.1 China
- 5.5.4.2 Japan
- 5.5.4.3 India
- 5.5.4.4 South Korea
- 5.5.4.5 Singapore
- 5.5.4.6 Rest of Asia-Pacific
- 5.5.5 Middle East
- 5.5.5.1 Saudi Arabia
- 5.5.5.2 United Arab Emirates
- 5.5.5.3 Turkey
- 5.5.5.4 Rest of Middle East
- 5.5.6 Africa
- 5.5.6.1 South Africa
- 5.5.6.2 Nigeria
- 5.5.6.3 Kenya
- 5.5.6.4 Rest of Africa
- 5.5.1 North America
6 COMPETITIVE LANDSCAPE
- 6.1 Market Concentration
- 6.2 Strategic Moves
- 6.3 Market Share Analysis
- 6.4 Company Profiles (includes Global Level Overview, Market Level Overview, Core Segments, Financials as available, Strategic Information, Market Rank/Share, Products and Services, Recent Developments)
- 6.4.1 Archer Technologies, LLC
- 6.4.2 Aravo Solutions, Inc.
- 6.4.3 BitSight Technologies, Inc.
- 6.4.4 Diligent Corporation
- 6.4.5 Genpact Limited
- 6.4.6 International Business Machines Corporation
- 6.4.7 KPMG LLP
- 6.4.8 LogicManager, Inc.
- 6.4.9 MetricStream, Inc.
- 6.4.10 Mitratech Holdings, Inc.
- 6.4.11 NAVEX Global, Inc.
- 6.4.12 OneTrust, LLC
- 6.4.13 Panorays Ltd.
- 6.4.14 ProcessUnity, Inc.
- 6.4.15 Resolver Inc.
- 6.4.16 Intertek SAI Global Pty Limited
- 6.4.17 SecurityScorecard, Inc.
- 6.4.18 ServiceNow, Inc.
- 6.4.19 UpGuard, Inc.
- 6.4.20 Venminder, Inc.
7 MARKET OPPORTUNITIES AND FUTURE OUTLOOK
- 7.1 White-space and Unmet-Need Assessment

 第三方風險管理市場-2026-2032年全球市場預測
 全球第三方風險管理市場規模、佔有率、趨勢和成長分析報告(2026-2034)
 第三方風險管理市場分析及預測(至2035年):依類型、產品類型、服務、技術、元件、應用、流程、部署模式、最終使用者及解決方案分類
 2026年全球第三方風險管理市場報告
 第三方風險管理市場規模、佔有率和成長分析(按組件、服務、部署類型、組織規模、垂直產業和地區分類)-2026-2033年產業預測
 第三方風險管理市場:全球 2025-2029
 第三方風險管理市場 - 全球產業規模、佔有率、趨勢、機會和預測,按組件、部署模式、組織規模、地區和競爭細分,2019-2029F