


 |
市場調查報告書
商品編碼
2072576
土壤改良劑:市場佔有率分析、行業趨勢和統計數據、成長預測(2025-2030 年)Soil Amendments - Market Share Analysis, Industry Trends & Statistics, Growth Forecasts (2025 - 2030) |
||||||

※ 本網頁內容可能與最新版本有所差異。詳細情況請與我們聯繫。
據 Mordor Intelligence 稱,2025 年土壤改良劑市場價值 86 億美元,預計到 2030 年將達到 135 億美元,年複合成長率為 9.4%。
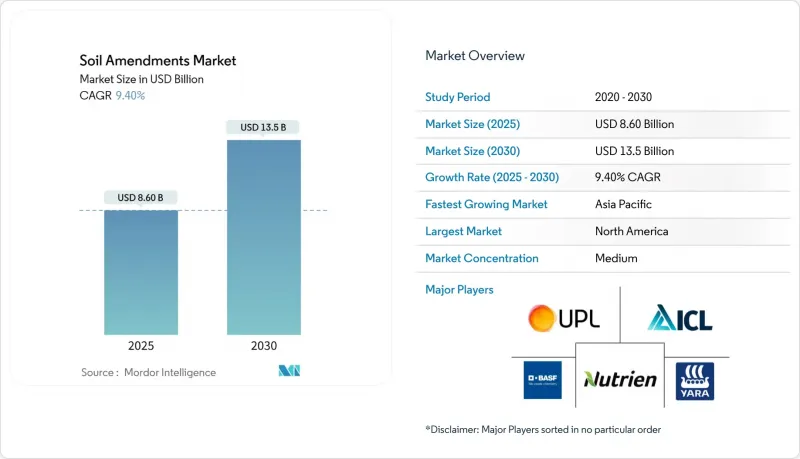
本報告按產品類型(有機土壤改良劑、無機土壤改良劑及其他)、形態(固體和液體)、應用領域(農業、園藝/草坪及其他)、作物類型(穀物、水果/蔬菜及其他)、土壤類型(沙土、粘土及其他)和地區(北美、歐洲及其他)進行細分。市場預測以美元計價。
全球土壤改良劑市場趨勢及洞察
再生農業的轉變正在加速,其必要性也日益增強。
政府計畫正透過將補貼與土壤健康檢驗的改善掛鉤,從而改變人們的購買行為。美國農業部(USDA)在2023年撥款3億美元用於溫室氣體排放的測量和檢驗,而歐盟則資助了100個「生活實驗室」來展示最佳實踐。澳洲的「國家土壤戰略」額外撥款2,159.9萬澳元(約1,450萬美元)用於建立監測網路,優先考慮那些已被證實具有固碳效果的土壤改良劑。銀行在審核農業貸款時,現在要求提供土壤健康狀況證明文件,並為早期採用者提供更優惠的貸款條件。這些措施共同推動了土壤改良劑市場的發展,擴大了目標使用者群體,並縮短了新產品的投資回收期。
碳權價格上漲促進生物炭生產
在自願性碳市場中,減排排放的交易價格為每噸174歐元(190美元),而經檢驗的生物炭在歐洲的交易價格為每噸300至2000歐元(327至2180美元)。土壤改良劑生產商採用雙重收入模式:一方向農民出售生物炭,另一方面將經認證的減排排放貨幣化。華盛頓州的一個試點計畫獲得了美國農業部(USDA)2049萬美元的津貼,該計畫正在展示一種可擴展的模式。飲料和科技公司等企業買家正在預購減排額度以實現淨零排放目標,這創造了需求基礎,並提高了專案的資金籌措潛力。
世界各國對土壤改良劑的規定不一致且含糊不清。
分段式產品註冊法規導致產品上市時間延長,合規成本增加。歐盟從2003/2003號法規過渡到2019/1009號法規,迫使許多土壤改良劑重新獲得認證。加拿大現代化的肥料法延長了續期週期,並引入了新的數據要求。企業必須為每個司法管轄區維護多種配方,這限制了規模經濟效益,並減緩了全球推廣速度。
細分市場分析
2024年,有機土壤改良劑佔土壤改良劑市場規模的57%,其中堆肥、牲畜糞便和腐植質是推動此類別成長的主要因素。受排碳權額度和產量提升的推動,生物炭基產品預計將以12.4%的複合年成長率成長。無機產品在特種作物領域保持其地位,而生物來源配方則透過種子披衣應用展現出快速成長。 2025年5月,印度生物炭國務部長贊助舉辦了一場生物炭研討會,並實施了熱解設備技術的津貼。同時,丹麥於2024年10月推出了熱解生物炭策略,撥款1,350萬歐元(1,460萬美元)用於研發,並承諾到2027年提供13.4億歐元(1,450萬美元)的津貼。
有機土壤改良劑憑藉其悠久的歷史、完善的監管體係以及有機農業的需求,在全球土壤改良劑市場中佔據主導地位。英國環境、食品和農村事務部 (Defra) 的報告顯示,2023 年,牛是英國主要的有機肥料,47.1% 的農民都在使用。液態牛位居第二,使用率為 16.7%,它既能提供必需的營養物質,又能減少化肥的需求。
顆粒狀和粉末狀產品因其儲存穩定性好且與散裝肥料物流相容,佔據了土壤改良劑市場68%的佔有率。受施肥灌溉和葉面噴布噴施的推動,預計到2030年,液體配方將以11.2%的複合年成長率成長。 2023-2024年,乾粉類固態仍維持最大的市場佔有率,尤其是在糧食種植領域,這得益於其持續釋放養分、改善土壤結構和保水等特性。
利用可生物分解聚合物的包封技術,可以製備出緩釋固體顆粒,兼具液體的精準性和便利性的操作性。水溶性包裝降低了工人接觸的風險,同時滿足了安全性和永續性要求。巴西2024年精密農業舉措正在資助液態腐植酸和微生物製劑在大豆和橘子種植的應用,而歐洲生物促效劑產業委員會將於2025年初發布歐盟施肥和灌溉系統中液態微生物接種劑的使用指南。
區域分析
2024年,北美將佔全球銷售額的31%,這主要得益於聯邦政府1.2億美元的生物炭津貼、蓬勃發展的碳市場以及先進精密農業的普及。在加拿大,由於化肥法規的修訂和完善的支援服務,人們對生技藥品的信心日益增強。農民收入的提高使得生產者能夠在不影響現金流的情況下測試高品質的土壤改良劑,而該地區的研究機構也不斷縮短產品檢驗週期。
預計到2030年,亞太地區土壤改良劑市場將以12.7%的複合年成長率實現最快成長。在中國,1.2433億公頃耕地受到嚴格的保護措施,土壤改良劑已被納入強制性土壤修復措施。印度的「Dhan-Dhaanya Krishi Yojana」計畫向100個生產力低的地區提供補貼,以促進小規模農戶採用土壤改良劑。儘管該地區受益於大規模的有機原料,但在分銷和農業技術培訓方面仍面臨挑戰。
在歐洲,生物炭市場正穩步成長,這主要得益於歐盟「土壤公約」框架下建立的100個「活體實驗室」以及即將實施的「土壤監測法」。 「土壤監測法」旨在解決土壤劣化問題,該問題每年造成500億歐元(545億美元)的損失。生物炭的交易價格根據認證狀態的不同,每噸價格在300歐元至2000歐元(327美元至2180美元)之間,這形成了一個獎勵那些能夠提供檢驗的碳去除效果的創新者的系統。嚴格的肥料和鹽鹼化水平法規,以及2050年碳中和目標,已將土壤改良劑納入合規流程。
其他好處
- Excel格式的市場預測(ME)表
- 3個月的分析師支持
目錄
第1章:引言
- 研究假設和市場定義
- 調查範圍
第2章:調查方法
第3章執行摘要
第4章 市場狀況
- 市場概覽
- 市場促進因素
- 加速向再生農業轉型勢在必行。
- 碳權額度的不斷上漲正在推動生物炭的應用。
- 土壤微生物群和種子披衣的協同作用正在推動市場需求。
- 水資源短缺正在推動超吸水性聚合物的應用。
- 政府禁止使用高鹽合成肥料
- 用於實現淨零排放的供應鏈舉措
- 市場限制因素
- 關於這些修正案的全球法規因地區而異,而且含糊不清。
- 有機原物料價格波動
- 由於田間檢查結果不一致,農民心存疑慮。
- 活性微生物產品的分銷速度緩慢。
- 監理情勢
- 技術展望
- 波特五力分析
第5章 市場規模與成長預測
- 依產品類型
- 有機土壤改良劑
- 無機土壤改良劑
- 生物和微生物修飾劑
- 按形式
- 固體的
- 液體
- 透過使用
- 農業
- 園藝和草坪
- 環境修復 環境修復
- 按作物類型
- 穀類和穀類食品
- 水果和蔬菜
- 油籽/豆類
- 依土壤類型
- 沙
- 黏土
- 壤土及粉土
- 按地區
- 北美洲
- 美國
- 加拿大
- 其他北美國家
- 南美洲
- 巴西
- 阿根廷
- 其他南美國家
- 歐洲
- 德國
- 法國
- 英國
- 義大利
- 西班牙
- 俄羅斯
- 其他歐洲國家
- 亞太地區
- 中國
- 印度
- 日本
- 韓國
- 澳洲
- 其他亞太國家
- 中東
- 沙烏地阿拉伯
- 土耳其
- 其他中東國家
- 非洲
- 南非
- 肯亞
- 其他非洲地區
- 北美洲
第6章 競爭情勢
- 市場集中度
- 策略趨勢
- 市佔率分析
- 公司簡介
- Yara International ASA
- BASF SE
- Nutrien Ltd
- ICL Group
- UPL Ltd
- Syngenta AG
- Corteva Agriscience
- Scotts Miracle-Gro Company
- Novozymes A/S
- Humintech GmbH
- Biochar Supreme, LLC
- Lallemand Inc
- Omnia Nutriology
- Calix Ltd
- BioSafe Systems
- Bioceres SA
- Mosaic Company
- AgroLiquid
- FMC Corporation
- Genesis Industries Limited
第7章 市場機會與未來展望
According to Mordor Intelligence, the soil amendments market size is valued at USD 8.6 billion in 2025 and is forecast to reach USD 13.5 billion in 2030, advancing at a 9.4% CAGR.
This report is Segmented by Product Type (Organic Amendments, Inorganic Amendments, and More), by Form (Solid and Liquid), by Application (Agriculture, Horticulture and Turf, and More), by Crop Type (Cereals and Grains, Fruits and Vegetables, and More), by Soil Type (Sand, Clay, and More) and by Geography (North America, Europe and More). The Market Forecasts are Provided in Terms of Value (USD).
Global Soil Amendments Market Trends and Insights
Accelerated transition to regenerative agriculture mandates
Government programs are reshaping purchasing behavior by tying subsidies to verifiable soil-health improvements. The USDA allocates USD 300 million to greenhouse-gas measurement and verification in 2023, while the EU funds 100 living labs that demonstrate best practices. Australia's National Soil Strategy adds AUD 21.599 million (USD 14.5 million) for monitoring networks that favor conditioners with proven carbon-sequestration benefits. Banks now require soil-health documentation for farm credit, rewarding early adopters with better loan terms. These actions compound to lift the soil amendments market by expanding the addressable user base and shortening payback periods for new products.
Rising carbon credit valuation incentivizing biochar
Voluntary carbon markets price removal credits at EUR 174 (USD 190) per metric ton, and verified biochar trades between EUR 300 and EUR 2,000 (USD 327-2,180) per metric ton in Europe. Soil amendment producers embrace dual-revenue models, selling biochar to farmers and monetizing certified removals. Pilot facilities in Washington State, backed by USD 20.49 million in USDA grants, illustrate the scale-up path. Corporate buyers, such as beverage and technology firms, pre-purchase credits to meet net-zero targets, anchoring demand and improving project bankability.
Patchy, ambiguous global regulations for amendments
Fragmented rules on product registration delay launches and inflate compliance costs. The European Union's shift from Regulation 2003/2003 to 2019/1009 forced re-certification of many conditioners. Canada's modernized fertilizer code extends renewal cycles yet introduces new data requirements. Companies must keep multiple formulations for different jurisdictions, limiting economies of scale and slowing global rollouts.
Other drivers and restraints analyzed in the detailed report include:
- Government bans on high-salinity synthetic fertilizers
- Soil microbiome seed coating synergies boosting demand
- Farmer Skepticism from Inconsistent Field Results
For complete list of drivers and restraints, kindly check the Table Of Contents.
Segment Analysis
Organic amendments held 57% share of the soil amendments market size in 2024, with compost, manure, and humic substances leading the category. Biochar-based products are projected to grow at a 12.4% CAGR, driven by carbon-credit opportunities and yield improvements. While inorganic products maintain their position in specialty crops, biological formulations show rapid growth through seed-coating applications. India's Minister Nitin Gadkari endorsed biochar workshops and subsidized pyrolyser technologies in May 2025, while Denmark implemented a pyrolysis-biochar strategy in October 2024, allocating EUR 13.5 million (USD 14.6 million) for R&D and EUR 1.34 billion (USD 14.5 million) in subsidies through 2027.
Organic amendments dominate the global soil amendments market due to their established usage, regulatory acceptance, and organic agriculture demand. The Department for Environment, Food and Rural Affairs reports that in 2023, Cattle FYM was the primary organic fertilizer in Great Britain, used by 47.1% of farmers, while Cattle Slurry ranked second at 16.7% adoption, offering essential nutrients while reducing chemical fertilizer requirements.
Granules and powders account for 68% of the soil amendments market share due to storage stability and bulk-fertilizer logistics compatibility. Liquid formulations are projected at 11.2% CAGR through 2030, driven by fertigation and drone-based foliar applications. Dry solids maintained the largest market share in 2023-2024, particularly in cereal and grain cultivation, due to sustained nutrient release, soil structure improvement, and water retention properties.
Biodegradable polymer encapsulation enables controlled-release solid granules that combine liquid-like precision with practical handling. Water-soluble packaging reduces operator exposure while meeting safety and sustainability requirements. Brazil's 2024 "Precision Ag Initiative" funds liquid humic-microbe applications in soybean and orange cultivation, while the European Biostimulant Industry Council introduced guidelines in early 2025 for liquid microbial inoculants in EU fertigation systems.
Complete Report Scope:
- By Product Type
- Organic Amendments
- Inorganic Amendments
- Biological/Microbial Amendments
- By Form
- Solid
- Liquid
- By Application
- Agriculture
- Horticulture and Turf
- Environmental Remediation
- By Crop Type
- Cereals and Grains
- Fruits and Vegetables
- Oilseeds and Pulses
- By Soil Type
- Sand
- Clay
- Loam and Silt
- By Geography
- North America
- United States
- Canada
- Rest of North America
- South America
- Brazil
- Argentina
- Rest of South America
- Europe
- Germany
- France
- United Kingdom
- Italy
- Spain
- Russia
- Rest of Europe
- Asia-Pacific
- China
- India
- Japan
- South Korea
- Australia
- Rest of Asia-Pacific
- Middle East
- Saudi Arabia
- Turkey
- Rest of Middle East
- Africa
- South Africa
- Kenya
- Rest of Africa
- North America
Geography Analysis
North America holds 31% of 2024 revenue, underpinned by USD 120 million in federal biochar grants, robust carbon markets, and advanced precision-farming adoption. Canada's revamped fertilizer rules and extensive extension services foster trust in biologicals. Strong farm incomes allow growers to trial premium conditioners without compromising cash flow, and the region's research institutions shorten product-validation cycles.
Asia-Pacific records the fastest soil amendments market growth, at 12.7% CAGR to 2030. China enforces strict arable-land safeguards across 124.33 million hectares, integrating conditioners into rehabilitation mandates. India's Dhan-Dhaanya Krishi Yojana directs subsidies toward 100 low-productivity districts, catalyzing conditioner adoption among smallholders. The region benefits from large biomass streams for organic feedstocks, though distribution and agronomic-training gaps persist.
Europe shows steady expansion, driven by the EU Soil Deal's 100 living labs and a forthcoming Soil Monitoring Law addressing degraded land that costs EUR 50 billion (USD 54.5 billion) annually. Biochar fetches EUR 300-2,000 (USD 327-2,180) per metric ton, depending on certification status, rewarding innovators that deliver verified removals. Tight fertilizer-salinity limits and a 2050 carbon-neutral target embed conditioners into compliance pathways.
- Yara International ASA
- BASF SE
- Nutrien Ltd
- ICL Group
- UPL Ltd
- Syngenta AG
- Corteva Agriscience
- Scotts Miracle-Gro Company
- Novozymes A/S
- Humintech GmbH
- Biochar Supreme, LLC
- Lallemand Inc
- Omnia Nutriology
- Calix Ltd
- BioSafe Systems
- Bioceres S.A.
- Mosaic Company
- AgroLiquid
- FMC Corporation
- Genesis Industries Limited
Additional Benefits:
- The market estimate (ME) sheet in Excel format
- 3 months of analyst support
TABLE OF CONTENTS
1 Introduction
- 1.1 Study Assumptions and Market Definition
- 1.2 Scope of the Study
2 Research Methodology
3 Executive Summary
4 Market Landscape
- 4.1 Market Overview
- 4.2 Market Drivers
- 4.2.1 Accelerated transition to regenerative agriculture mandates
- 4.2.2 Rising carbon credit valuation incentivizing biochar
- 4.2.3 Soil microbiome seed coating synergies boosting demand
- 4.2.4 Water scarcity driving uptake of super-absorbent polymers
- 4.2.5 Government bans on high-salinity synthetic fertilizers
- 4.2.6 Net-zero supply-chain commitments
- 4.3 Market Restraints
- 4.3.1 Patchy, ambiguous global regulations for amendments
- 4.3.2 Organic raw-material price volatility
- 4.3.3 Farmer skepticism from inconsistent field results
- 4.3.4 Weak distribution for live microbial products
- 4.4 Regulatory Landscape
- 4.5 Technological Outlook
- 4.6 Porter's Five Forces Analysis
- 4.6.1 Bargaining Power of Suppliers
- 4.6.2 Bargaining Power of Buyers
- 4.6.3 Threat of Substitutes
- 4.6.4 Threat of New Entrants
- 4.6.5 Intensity of Competitive Rivalry
5 Market Size and Growth Forecasts (Value)
- 5.1 By Product Type
- 5.1.1 Organic Amendments
- 5.1.2 Inorganic Amendments
- 5.1.3 Biological/Microbial Amendments
- 5.2 By Form
- 5.2.1 Solid
- 5.2.2 Liquid
- 5.3 By Application
- 5.3.1 Agriculture
- 5.3.2 Horticulture and Turf
- 5.3.3 Environmental Remediation
- 5.4 By Crop Type
- 5.4.1 Cereals and Grains
- 5.4.2 Fruits and Vegetables
- 5.4.3 Oilseeds and Pulses
- 5.5 By Soil Type
- 5.5.1 Sand
- 5.5.2 Clay
- 5.5.3 Loam and Silt
- 5.6 By Geography
- 5.6.1 North America
- 5.6.1.1 United States
- 5.6.1.2 Canada
- 5.6.1.3 Rest of North America
- 5.6.2 South America
- 5.6.2.1 Brazil
- 5.6.2.2 Argentina
- 5.6.2.3 Rest of South America
- 5.6.3 Europe
- 5.6.3.1 Germany
- 5.6.3.2 France
- 5.6.3.3 United Kingdom
- 5.6.3.4 Italy
- 5.6.3.5 Spain
- 5.6.3.6 Russia
- 5.6.3.7 Rest of Europe
- 5.6.4 Asia-Pacific
- 5.6.4.1 China
- 5.6.4.2 India
- 5.6.4.3 Japan
- 5.6.4.4 South Korea
- 5.6.4.5 Australia
- 5.6.4.6 Rest of Asia-Pacific
- 5.6.5 Middle East
- 5.6.5.1 Saudi Arabia
- 5.6.5.2 Turkey
- 5.6.5.3 Rest of Middle East
- 5.6.6 Africa
- 5.6.6.1 South Africa
- 5.6.6.2 Kenya
- 5.6.6.3 Rest of Africa
- 5.6.1 North America
6 Competitive Landscape
- 6.1 Market Concentration
- 6.2 Strategic Moves
- 6.3 Market Share Analysis
- 6.4 Company Profiles (includes Global Overview, Market Overview, Core Segments, Financials as available, Strategic Information, Market Rank/Share for key companies, Products and Services, and Recent Developments)
- 6.4.1 Yara International ASA
- 6.4.2 BASF SE
- 6.4.3 Nutrien Ltd
- 6.4.4 ICL Group
- 6.4.5 UPL Ltd
- 6.4.6 Syngenta AG
- 6.4.7 Corteva Agriscience
- 6.4.8 Scotts Miracle-Gro Company
- 6.4.9 Novozymes A/S
- 6.4.10 Humintech GmbH
- 6.4.11 Biochar Supreme, LLC
- 6.4.12 Lallemand Inc
- 6.4.13 Omnia Nutriology
- 6.4.14 Calix Ltd
- 6.4.15 BioSafe Systems
- 6.4.16 Bioceres S.A.
- 6.4.17 Mosaic Company
- 6.4.18 AgroLiquid
- 6.4.19 FMC Corporation
- 6.4.20 Genesis Industries Limited
7 Market Opportunities and Future Outlook

 土壤改良劑市場:全球市場預測,2026-2032年
 全球土壤改良劑市場規模、佔有率、趨勢和成長分析報告(2026-2034年)土壤改良劑市場-2026-2032年全球市場預測
 土壤改良劑市場預測至2034年-按產品類型、形態、功能、通路、應用、最終用戶和地區分類的全球分析
 土壤改良劑市場規模、佔有率和成長分析:按產品類型、作物類型、應用方法和地區分類-2026-2033年產業預測
 土壤肥力檢測市場規模、佔有率和成長分析:按檢測類型、方法、應用、最終用戶和地區分類-2026-2033年產業預測
 土壤改良劑市場:依產品類型、土壤類型、作物類型、應用和地區分類。全球土壤燻蒸劑市場規模、佔有率、趨勢和成長分析報告(2026-2034年)
 2026年全球土壤肥力檢測市場報告土壤燻蒸劑市場:依化學類型、作物類型、應用方法和劑型分類-2026年至2032年全球市場預測