


 |
市場調查報告書
商品編碼
2066709
商用車:市場佔有率分析、產業趨勢與統計、成長預測(2026-2031)Commercial Vehicles - Market Share Analysis, Industry Trends & Statistics, Growth Forecasts (2026 - 2031) |
||||||

※ 本網頁內容可能與最新版本有所差異。詳細情況請與我們聯繫。
根據 Mordor Intelligence 預測,商用車市場規模預計在 2026 年達到 9,700 億美元,並在 2031 年擴大到 1.2 兆美元,預測期內複合年成長率為 4.48%。
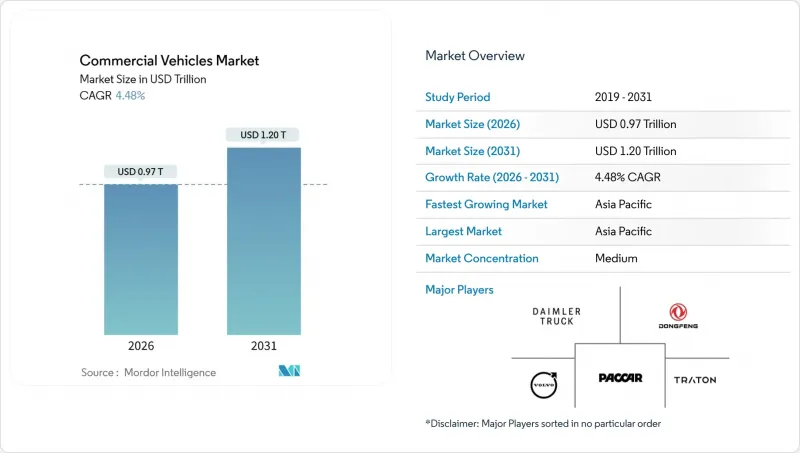
本報告按車輛類型(巴士、重型商用卡車等)、動力類型(混合動力汽車和電動車、內燃機汽車)、車輛總重(1級、2級等)、最終用途行業(物流和電子商務、建築和採礦等)以及地區進行細分。市場預測以價值(美元)和數量(輛)表示。
全球商用車市場趨勢與洞察
美國、歐盟和中國加強二氧化碳和氮氧化物排放法規
自2024年以來,世界各國政府收緊了碳排放法規,縮短了汽車製造商(OEM)的研發週期,並增加了遵循成本。然而,補貼和稅額扣抵正在抵消零排放卡車的總擁有成本。美國環保署(EPA)新的第三階段目標要求重型車輛在2027年車型年實現二氧化碳排放目標。同時,歐洲清潔交通走廊計畫沿線定期安裝兆瓦級充電樁。在中國,對重型卡車實施更嚴格的排放標準顯著降低了氮氧化物排放,導致不符合標準的柴油車提前退役。加州和德國的車隊營運商優先考慮的是監管政策的清晰度,而不是初期基礎設施建設的挑戰,並正在尋求長期購買電動卡車的承諾。因此,資本投資補貼和碳定價等措施正在推動商用車市場的成長。
電子商務的爆炸性成長和第三方物流 (3PL) 服務的擴張,催生了對最後一公里運輸車輛的需求。
隨著小包裹處理量的激增,其增速超過了倉庫自動化的步伐,物流公司不得不對其輕型貨車進行電氣化改造,尤其是在都市區零排放區運營的車輛。亞馬遜計劃在2025年底前在北美和歐洲部署大規模的電動貨車車隊。同時,DHL也承諾在未來幾年投入巨資,實現都市區車隊的電氣化。在倫敦、巴黎和北京等城市,柴油車限行法規已開始實施,限制內燃機車在尖峰時段的通行,這使得電動貨車在歐洲都市區配送車輛中越來越受歡迎。在美國,由於郊區長途運輸路線和充電網路不發達等因素,電動貨車的普及速度較為緩慢,但洛杉磯和紐約的試驗計畫表明,現場充電可以有效地支持日常運作。這些趨勢凸顯了商用車市場對電動輕型商用車的強勁且不斷成長的需求。
5 MW 基地台充電樁併網延遲(24 個月或更長)。
電力公司核准流程的延誤正在推遲車輛電氣化的進程。在英國,併網申請有嚴重的延誤。同時,在加州,大規模專案經常需要長時間等待。變電站升級改造因變壓器短缺以及監管機構優先考慮住宅太陽能併網而受阻。在德國,基礎建設的聯合資金雖然可用,但資金核准流程緩慢,短期內看不到任何改善的希望。除非電力公司加快核准速度,或監管機構建立優先核准機制,否則車輛電氣化過程將繼續滯後,從而抑製商用車市場短期內的成長潛力。
細分市場分析
預計到2025年,重型卡車將佔總銷量的42.15%,但由於負載容量和續航里程的限制,在兆瓦級充電樁普及之前,柴油車可能仍將佔據主導地位。中型卡車的發展前景尚待基礎建設的明確,而公車則受制於市政預算和政治週期。在北美農村地區,汽油動力皮卡仍然佔據主導地位,但福特F-150 Lightning和Rivian等車型的試點表明,公共產業和建設產業正在經歷早期轉型。輕型商用車成長最快,這主要得益於小包裹運輸量的成長和城市地區的排放氣體法規。廂型車需要150-200千瓦時的電池組,低於重型卡車,即使在燃油稅徵收之前,其投資回收期也僅為三年。預計輕型廂型車市場將以6.24%的複合年成長率成長,超過公車和中型卡車市場。
在歐洲的零排放區,由於尖峰時段禁止柴油車運輸,廂型車的普及速度正在加快,而補貼政策也縮短了都市區營運的投資回收期。在北美,由於長途運輸路線的普遍存在,柴油車仍然佔據主導地位,但試點數據的分析表明,在充電站充電可以滿足日常續航里程的需求。由於重型卡車的成長取決於電池成本的趨勢以及主要路線沿線充電基礎設施的資金籌措,因此,到2031年,廂型車很可能仍將是商用車市場擴張的主要驅動力。
2025年,商用車市場中,內燃機車將佔69.03%的銷量,但混合動力汽車和電動車的複合年成長率將達到8.33%,顯示市場結構正在發生調整。電池式電動車電動車在電氣化進程中處於領先地位,而插電式混合動力汽車則在彌補基礎設施不足方面發揮作用,滿足了謹慎購車擁有者的需求。由於鎳鉬價格上漲和監管日益複雜,柴油引擎的成本優勢正在逐漸喪失。壓縮天然氣(CNG)目前仍用於垃圾車和配備集中式加氣系統的公共交通車輛,但隨著電動車總擁有成本(TCO)的下降,其成長速度將放緩。汽油和液化石油氣(LPG)汽車由於都市區的法規限制,市佔率正在下降。
電池式電動車)的普及程度因地區而異。由於補貼和准入限制,中國和歐洲的普及速度最快。在北美,都市區配送服務的電氣化正在推進,而柴油車在長途運輸領域仍佔據主導地位。在新興市場,由於預期充電基礎設施的普及尚待完善,純電動車的普及速度已放緩。儘管燃料電池在長途運輸領域的試驗正在推進,但氫氣的高成本阻礙了其規模化應用。 2031年,動力系統的配置將取決於政策推出的時機和電池能量密度提升等關鍵節點,並將重塑商用車市場的供應鏈格局。
區域分析
預計到2025年,亞太地區將佔全球商用車銷量的46.25%,並以7.74%的複合年成長率領先全球市場。中國憑藉比亞迪、上汽集團和光電汽車等企業,在電動商用車生產領域佔據主導地位,年產量達120萬輛,這得益於購置稅減免政策和換電站網路的建設。在印度,FAME-II計畫的擴展正在加速主要大都會圈輕型商用車的電氣化進程;而日本和韓國則專注於重型商用車的氫燃料電池示範計畫。東南亞地區正在吸引中國組裝廠,但基礎設施建設落後限制了電動商用車的普及。
在德國大規模投資充電基礎設施和擴大零排放區的推動下,歐洲正向前邁進。在法國和英國,限制柴油貨車進入城區加速了貨車的電氣化進程,同時也給都市區電網帶來了壓力。南歐在基礎設施和財政資源方面落後,但計劃透過獎勵措施在2026年前縮小差距。在俄羅斯,由於制裁,柴油車仍然佔據主導地位,而嚴酷的冬季也會降低電池效率。
北美市場呈現兩極化。加州和東北部地區正大力推動零排放法規,而中西部地區長途運輸仍主要依賴柴油車。加拿大聯邦政府的補貼計畫正在推動安大略省和魁北克省的電動車普及,但其對農村地區長途運輸的促進作用正在減弱。巴西和阿根廷正在試驗電動巴士,但除非充電成本降低,否則柴油車仍將是貨運的主力。中東和非洲地區對物流自由區表現出初步興趣,但石油經濟和基礎設施落後阻礙了市場佔有率的真正轉變。總體而言,亞太地區和歐洲正在推動商用車市場的擴張,預計北美和新興地區將從2028年開始迎頭趕上。
其他好處:
- Excel格式的市場預測(ME)表
- 3個月的分析師支持
目錄
第1章:引言
- 研究假設和市場定義
- 調查範圍
第2章:調查方法
第3章執行摘要
第4章 主要產業趨勢
- 都市化、人口以及對汽車和大眾運輸的需求
- 商用車電動車滲透率
- 燃油價格與電費差異(每公里,內燃機汽車與電動車)
- 電動車和內燃機汽車的總擁有成本(TCO)差異
- 資金籌措和所有權模式(貸款、租賃、認購)
- 電池化學成分構成比與電池組能量密度(例如,磷酸鐵鋰電池與鎳基碳化鋰電池等)
- 家中、職場和公共場所的充電樁數量/密度
- 快速充電網路覆蓋範圍和輸出頻寬
- 替代燃料基礎設施(燃料電池電動車的氫氣)
- 補貼和消費者獎勵的價值
- 汽車製造商的電動車產品陣容和未來車型計劃
- 價值鍊和通路分析
- 監管、財政和產業政策框架
第5章 市場狀況
- 市場概覽
- 市場促進因素
- 美國、歐盟和中國加強二氧化碳和氮氧化物排放法規
- 電子商務和第三方物流的爆炸性成長催生了對最後一公里配送車輛的需求。
- 電池組單價(美元/度)創歷史新低,使重型卡車具備了成本競爭力。
- I-5 和萊茵阿爾蓬路段兆瓦級充電走廊試點項目
- 中國某礦場展示了商業電池更換生態系。
- OEM部署「電池即服務(BaaS)」訂閱服務
- 市場限制因素
- 5 MW 充電樁併網延遲(24 個月或更長)。
- 在北美和歐盟,純電動卡車的保險費正在飆升(漲幅超過 35%)。
- 第一代重型電動卡車的殘值存在不確定性。
- 鎳和鉬附加費的上漲推高了柴油動力系統的成本。
- 價值供應鏈分析
- 監理情勢
- 技術展望
- 波特五力模型
第6章 市場規模與成長預測
- 按車輛類型
- 公車
- 大型商用卡車
- 中型商用卡車
- 小型商用皮卡
- 小型商用貨車
- 依推進類型
- 混合動力汽車和電動車
- 電池式電動車(BEV)
- 燃料電池電動車(FCEV)
- 混合動力電動車(HEV)
- 插電式混合動力車(PHEV)
- 內燃機(ICE)
- 柴油引擎
- 壓縮天然氣(CNG)
- 汽油
- 液化石油氣(LPG)
- 混合動力汽車和電動車
- 車輛總重(以噸位等級)
- 1 類(小於 1.8 噸)
- 2 類(1.8–3.5 噸)
- 3級(3.5–7.5噸)
- 4級(7.5–16噸)
- 5級(超過16噸)
- 產業最終用途
- 物流與電子商務
- 建築和採礦
- 大眾運輸
- 公共產業及市政服務
- 其他(農業、零售)
- 按地區
- 北美洲
- 美國
- 加拿大
- 其他北美國家
- 南美洲
- 巴西
- 阿根廷
- 其他南美國家
- 歐洲
- 德國
- 英國
- 法國
- 義大利
- 俄羅斯
- 其他歐洲國家
- 亞太地區
- 中國
- 印度
- 日本
- 韓國
- 其他亞太國家
- 中東和非洲
- 沙烏地阿拉伯
- 阿拉伯聯合大公國
- 南非
- 其他中東和非洲國家
- 北美洲
第7章 競爭情勢
- 市場集中度
- 策略趨勢
- 市佔率分析
- 公司簡介
- Daimler Truck AG
- Volvo Group
- PACCAR Inc.
- Traton SE
- Dongfeng Motor Corporation Ltd.
- Tata Motors Limited
- BYD Auto Co., Ltd.
- SAIC Motor Corporation Limited
- Ford Motor Company
- General Motors Company
- Toyota Motor Corporation
- Hyundai Motor Company
- Nissan Motor Co., Ltd.
- Mahindra & Mahindra Ltd.
- Renault Group
- Rivian Automotive Inc.
- Iveco Group NV
- Isuzu Motors Ltd.
- Beiqi Foton Motor Co., Ltd.
第8章 市場機會與未來展望
- 評估閒置頻段和未滿足的需求
第9章:執行長面臨的關鍵策略挑戰
According to Mordor Intelligence, the commercial vehicles market size reached USD 0.97 trillion in 2026 and is projected to climb to USD 1.20 trillion by 2031, advancing at a 4.48% CAGR over the forecast period.
This report is Segmented by Vehicle Type (Buses, Heavy-Duty Commercial Trucks, and More), Propulsion Type (Hybrid and Electric Vehicles, Internal Combustion Engine), Gross Vehicle Weight Rating (Class 1, Class 2, and More), End-Use Industry (Logistics and E-Commerce, Construction and Mining, and More), and Geography. The Market Forecasts are Provided in Terms of Value (USD) and Volume (Units).
Global Commercial Vehicles Market Trends and Insights
Tightening CO2 and NOx Emission Limits in the United States, EU and China
After 2024, governments ramped up stringent carbon regulations, shortening OEM development timelines and increasing compliance expenses. However, subsidies and tax credits are now offsetting the total ownership costs for zero-emission trucks. The new EPA Phase 3 targets mandate reduced CO2 emissions for 2027 heavy-duty vehicle models. Meanwhile, Europe's clean-transport corridors are set to install megawatt chargers at regular intervals. In China, the extension of stricter emission standards to larger trucks has significantly reduced NOx emissions, leading to the premature retirement of non-compliant diesel units. Fleet operators in California and Germany have made long-term commitments to electric truck purchases, valuing regulatory clarity over the challenges of early infrastructure deployment. As a result, initiatives like subsidized capital expenditures and carbon pricing are propelling the commercial vehicles market upward.
Explosive E-commerce and 3PL Growth Requiring Last-mile Fleets
As parcel volumes surged, outpacing the pace of warehouse automation, logistics firms found themselves compelled to electrify their light-duty vans, especially those operating in urban zero-emission zones. Amazon has rolled out a substantial fleet of electric vans across North America and Europe by the end of 2025. Meanwhile, DHL has committed significant investments, aiming to electrify a majority of its urban fleet in the coming years. In response to municipal diesel restrictions in cities like London, Paris, and Beijing, which curtail peak-hour access for internal combustion engine (ICE) vans, electric vans are increasingly becoming a preferred choice for urban delivery vehicles in Europe. While the United States trails in adoption-attributed to its longer suburban routes and a sparse network of chargers-pilot programs in Los Angeles and New York have showcased that depot charging can effectively support daily operational cycles. These developments highlight a robust and growing demand for electrified light-duty vehicles in the commercial vehicles market.
Grid-connection Delays (Above 24 Months) for 5 MW Depot Chargers
Fleet electrification timelines are being stretched by utility backlogs. In the United Kingdom, connection requests face significant delays. Meanwhile, in California, larger projects often encounter extended waiting periods. Substation upgrades are hindered by transformer shortages and a regulatory sequence that prioritizes residential solar tie-ins. In Germany, while co-funding is available for infrastructure, the disbursement process is slow, with any relief not expected in the near term. Unless utilities expedite approvals or regulators enforce fast-track queues, depot electrification will continue to lag, dampening the near-term potential for the commercial vehicles market.
Other drivers and restraints analyzed in the detailed report include:
- Record Low Battery-pack USD/kWh Unlocking HD-truck Parity
- Megawatt-charging Corridor Pilots on I-5 and Rhine-Alpine
- Insurance-premium Spike for BEV Trucks in North America and EU (Above 35%)
For complete list of drivers and restraints, kindly check the Table Of Contents.
Segment Analysis
Heavy-duty trucks, despite a 42.15% 2025 volume share, shoulder payload and range constraints that keep diesel dominant until megawatt chargers proliferate. Medium-duty units await infrastructure clarity, while buses depend on municipal budgets and political cycles. Pick-up trucks remain mostly gasoline in rural North America, although pilot fleets featuring Ford F-150 Lightning and Rivian variants signal an early transition in utilities and construction. Light commercial vans grew fastest, propelled by parcel density and city-center emission rules. Vans require 150-200 kWh packs-less than those of heavy-duty trucks-supporting three-year payback horizons even before fuel levies. The commercial vehicles market size for light vans is set to expand at a 6.24% CAGR, outpacing bus and medium-duty segments.
European zero-emission zones accelerate van adoption by banning diesel deliveries during peak hours, and subsidies shorten payback in urban operations. North America's longer routes retain diesel dominance, yet pilot data suggest depot charging can sustain daily range needs. Heavy-duty truck growth hinges on battery-cost curves and corridor charging funding, meaning vans will be the workhorse of commercial vehicles market expansion through 2031.
Internal-combustion engines kept 69.03% of 2025 revenue in the commercial vehicles market, but hybrid and electric variants log an 8.33% CAGR, signaling structural rebalancing. Battery-electric leads electrification, while plug-in hybrids bridge infrastructure gaps for cautious fleets. Diesel engines face nickel-moly inflation and regulatory complexity, eroding cost advantages. CNG persists in refuse and transit fleets with central refueling, yet growth stays modest as electric TCO declines. Gasoline and LPG fade under urban restrictions.
Battery-electric uptake varies by region: China and Europe advance fastest via subsidies and access rules; North America electrifies urban delivery while preserving diesel for long haul; emerging markets delay until chargers proliferate. Fuel-cell pilots progress for long-range duty cycles, but high hydrogen costs stall scale-up. The propulsion mix through 2031 will pivot on policy timing and battery-density milestones, reshaping supply chains in the commercial vehicles market.
Geography Analysis
Asia-Pacific generated 46.25% of global revenue in 2025 and will post a 7.74% CAGR, the highest worldwide in the commercial vehicles market. China leads with 1.2 million electric commercial vehicles produced by BYD, SAIC Motor, and Foton Motor, benefiting from purchase-tax waivers and battery-swap corridors. India's FAME-II extensions spur light-duty electrification in top metros, while Japan and South Korea double down on hydrogen heavy-duty pilots. Southeast Asia attracts Chinese assembly plants, yet slower infrastructure roll-outs limit penetration.
Europe advances on the strength of Germany's significant charger fund and expanding zero-emission zones . France and the United Kingdom restrict diesel van access to city centers, boosting van electrification but straining urban grids. Southern Europe trails in infrastructure and fiscal leeway, though incentives through 2026 aim to narrow the gap. Russia remains mostly diesel amid sanctions, and harsh winters degrade battery efficiency.
North America is bifurcated: California and the Northeast push zero-emission mandates, while the Midwest keeps diesel for long haul. Canada's federal rebates spark adoption in Ontario and Quebec, yet rural distances mute impact. Brazil and Argentina pilot electric buses, but most freight stays diesel until charging costs fall. The Middle East and Africa show early interest in logistics free zones, but oil economies and nascent infrastructure delay meaningful share shifts. Collectively, Asia-Pacific and Europe will drive the commercial vehicles market expansion, while North America and emerging regions catch up post-2028.
- Daimler Truck AG
- Volvo Group
- PACCAR Inc.
- Traton SE
- Dongfeng Motor Corporation Ltd.
- Tata Motors Limited
- BYD Auto Co., Ltd.
- SAIC Motor Corporation Limited
- Ford Motor Company
- General Motors Company
- Toyota Motor Corporation
- Hyundai Motor Company
- Nissan Motor Co., Ltd.
- Mahindra & Mahindra Ltd.
- Renault Group
- Rivian Automotive Inc.
- Iveco Group N.V.
- Isuzu Motors Ltd.
- Beiqi Foton Motor Co., Ltd.
Additional Benefits:
- The market estimate (ME) sheet in Excel format
- 3 months of analyst support
TABLE OF CONTENTS
1 Introduction
- 1.1 Study Assumptions & Market Definition
- 1.2 Scope of the Study
2 Research Methodology
3 Executive Summary
4 Key Industry Trend
- 4.1 Urbanization, Population and Vehicle/Transit Demand
- 4.2 EV Penetration in Commercial Vehicle
- 4.3 Fuel vs Electricity Price Spread (Per km, ICE vs EV)
- 4.4 EV vs ICE Total Cost of Ownership (TCO) Gap
- 4.5 Financing and Ownership Models (Loans, Leasing, Subscription)
- 4.6 Battery Chemistry Mix and Pack Energy Density (LFP vs NMC etc.)
- 4.7 Home, Workplace and Public Charger Access / Density
- 4.8 Fast-Charging Network Coverage and Power Bands
- 4.9 Alternative Fuels Infrastructure (Hydrogen for FCEVs)
- 4.10 Subsidy and Consumer Incentive Value
- 4.11 OEM EV Line-up and Model Pipeline
- 4.12 Value-Chain and Distribution-Channel Analysis
- 4.13 Regulatory, Fiscal and Industrial Policy Framework
5 Market Landscape
- 5.1 Market Overview
- 5.2 Market Drivers
- 5.2.1 Tightening CO2 and NOx Emission Limits in the United States, EU and China
- 5.2.2 Explosive E-commerce and 3PL Growth Requiring Last-mile Fleets
- 5.2.3 Record Low Battery-pack USD/kWh Unlocking HD-truck Parity
- 5.2.4 Megawatt-charging Corridor Pilots on I-5 and Rhine-Alpine
- 5.2.5 Commercial Battery-swap Ecosystems Proven in China's Mining Hubs
- 5.2.6 OEM Battery-as-a-Service (BaaS) Subscription Rollout
- 5.3 Market Restraints
- 5.3.1 Grid-connection Delays (Above 24 Months) for 5 MW Depot Chargers
- 5.3.2 Insurance-premium Spike for BEV Trucks in North America and EU (Above 35%)
- 5.3.3 Residual-value Uncertainty for First-gen Electric HD Trucks
- 5.3.4 Rising Nickel and Moly Surcharges Inflating Diesel Powertrain Costs
- 5.4 Value / Supply-Chain Analysis
- 5.5 Regulatory Landscape
- 5.6 Technological Outlook
- 5.7 Porter's Five Forces
- 5.7.1 Bargaining Power of Suppliers
- 5.7.2 Bargaining Power of Buyers
- 5.7.3 Threat of New Entrants
- 5.7.4 Threat of Substitutes
- 5.7.5 Competitive Rivalry
6 Market Size & Growth Forecasts (Value (USD) and Volume (Units))
- 6.1 By Vehicle Type
- 6.1.1 Buses
- 6.1.2 Heavy-Duty Commercial Trucks
- 6.1.3 Medium-Duty Commercial Trucks
- 6.1.4 Light Commercial Pick-up Trucks
- 6.1.5 Light Commercial Vans
- 6.2 By Propulsion Type
- 6.2.1 Hybrid and Electric Vehicles
- 6.2.1.1 Battery Electric Vehicle (BEV)
- 6.2.1.2 Fuel Cell Electric Vehicle (FCEV)
- 6.2.1.3 Hybrid Electric Vehicle (HEV)
- 6.2.1.4 Plug-in Hybrid Electric Vehicle (PHEV)
- 6.2.2 Internal Combustion Engine (ICE)
- 6.2.2.1 Diesel
- 6.2.2.2 Compressed Natural Gas (CNG)
- 6.2.2.3 Gasoline
- 6.2.2.4 Liquefied Petroleum Gas (LPG)
- 6.2.1 Hybrid and Electric Vehicles
- 6.3 By Gross Vehicle Weight Rating (Tonnage Class)
- 6.3.1 Class 1 (Below 1.8 t)
- 6.3.2 Class 2 (1.8-3.5 t)
- 6.3.3 Class 3 (3.5-7.5 t)
- 6.3.4 Class 4 (7.5-16 t)
- 6.3.5 Class 5 (Above 16 t)
- 6.4 By End-Use Industry
- 6.4.1 Logistics and E-commerce
- 6.4.2 Construction and Mining
- 6.4.3 Public Transport
- 6.4.4 Utilities and Municipal Services
- 6.4.5 Others (Agriculture, Retail)
- 6.5 By Geography
- 6.5.1 North America
- 6.5.1.1 United States
- 6.5.1.2 Canada
- 6.5.1.3 Rest of North America
- 6.5.2 South America
- 6.5.2.1 Brazil
- 6.5.2.2 Argentina
- 6.5.2.3 Rest of South America
- 6.5.3 Europe
- 6.5.3.1 Germany
- 6.5.3.2 United Kingdom
- 6.5.3.3 France
- 6.5.3.4 Italy
- 6.5.3.5 Russia
- 6.5.3.6 Rest of Europe
- 6.5.4 Asia-Pacific
- 6.5.4.1 China
- 6.5.4.2 India
- 6.5.4.3 Japan
- 6.5.4.4 South Korea
- 6.5.4.5 Rest of Asia-Pacific
- 6.5.5 Middle East and Africa
- 6.5.5.1 Saudi Arabia
- 6.5.5.2 United Arab Emirates
- 6.5.5.3 South Africa
- 6.5.5.4 Rest of the Middle East and Africa
- 6.5.1 North America
7 Competitive Landscape
- 7.1 Market Concentration
- 7.2 Strategic Moves
- 7.3 Market Share Analysis
- 7.4 Company Profiles (includes Global Level Overview, Market Level Overview, Core Segments, Financials as Available, Strategic Information, Market Rank/Share for Key Companies, Products and Services, SWOT Analysis, and Recent Developments)
- 7.4.1 Daimler Truck AG
- 7.4.2 Volvo Group
- 7.4.3 PACCAR Inc.
- 7.4.4 Traton SE
- 7.4.5 Dongfeng Motor Corporation Ltd.
- 7.4.6 Tata Motors Limited
- 7.4.7 BYD Auto Co., Ltd.
- 7.4.8 SAIC Motor Corporation Limited
- 7.4.9 Ford Motor Company
- 7.4.10 General Motors Company
- 7.4.11 Toyota Motor Corporation
- 7.4.12 Hyundai Motor Company
- 7.4.13 Nissan Motor Co., Ltd.
- 7.4.14 Mahindra & Mahindra Ltd.
- 7.4.15 Renault Group
- 7.4.16 Rivian Automotive Inc.
- 7.4.17 Iveco Group N.V.
- 7.4.18 Isuzu Motors Ltd.
- 7.4.19 Beiqi Foton Motor Co., Ltd.
8 Market Opportunities & Future Outlook
- 8.1 White-space & Unmet-Need Assessment
9 Key Strategic Questions for CEOs

 全球商用車市場規模、佔有率、趨勢和成長分析報告(2026-2034)
 商用車市場分析及預測(至2035年):車輛類型、產品、服務、技術、零件、應用、材料類型、最終用戶及功能
 2026年全球街頭藝術自行車之旅市場報告
 商用車市場規模、佔有率、趨勢和預測:按車輛類型、動力系統、應用和地區分類,2026-2034 年2026年全球商用車市場報告
 商用車市場:依產品、最終用途及地區分類
 商用車市場:2026-2032年全球市場預測(依車輛類型、燃料類型、變速箱類型、負載容量、動力傳動系統、應用和銷售管道)商用車市場規模、佔有率、成長及全球產業分析:按類型、應用和地區分類的洞察,2026-2034 年預測
 商用車市場規模、佔有率和成長分析:按產品類型、動力系統、最終用途和地區分類-2026-2033年產業預測
 商用車市場規模、佔有率和趨勢分析報告:按產品、最終用途、地區和細分市場預測,2026-2033年