

 |
市場調查報告書
商品編碼
2066708
電動卡車:市場佔有率分析、產業趨勢與統計、成長預測(2026-2031)Electric Truck - Market Share Analysis, Industry Trends & Statistics, Growth Forecasts (2026 - 2031) |
||||||
※ 本網頁內容可能與最新版本有所差異。詳細情況請與我們聯繫。
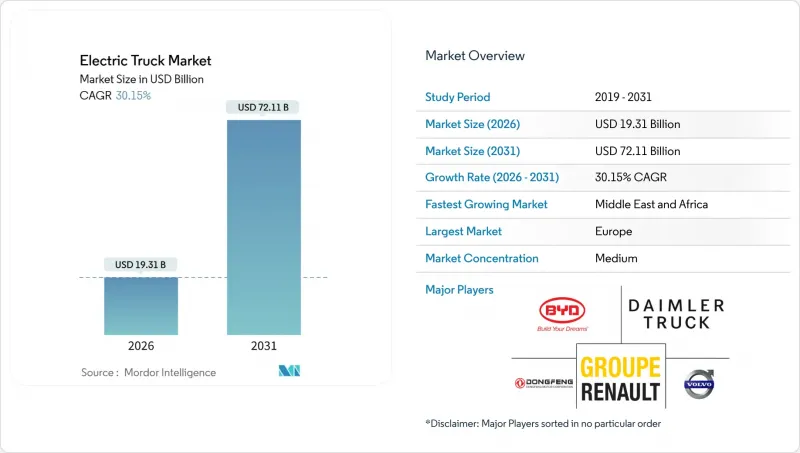
根據 Mordor Intelligence 估計,2026 年電動卡車市場價值為 193.1 億美元,預計在預測期(2026-2031 年)內將以 30.15% 的複合年成長率成長,到 2031 年達到 721.1 億美元。
本報告按驅動方式(純電動車、燃料電池電動車、插電式混合動力車)、卡車類型(輕型、中型、重型、牽引車)、應用領域(物流、市政、建築、零售、公共產業)、續航里程、電池容量、馬達架構和地區進行細分。市場預測以價值(美元)和銷售(輛)兩種形式呈現。
全球電動卡車市場趨勢與洞察
電池組價格已跌破每千瓦時 100 美元。
近年來,電動卡車市場鋰離子電池組的價格大幅下降,預計未來將繼續下降,並在不久的將來與柴油牽引車的成本持平。這一價格下降主要得益於中國電池製造商,他們顯著提高了量產磷酸鋰鐵鋰(LFP)化學電池的能量密度。這縮短了都市區中型卡車車隊營運商的投資回收期,並大幅縮短了車輛更換週期(先前更換週期較長)。近期,總部位於加州的百事公司報告稱,其特斯拉Semi車隊的每英里能源成本與柴油8級牽引車相比顯著降低。此外,磷酸鐵鋰電池在新電動卡車電池容量市場中佔據了越來越大的佔有率,展現出更長的循環壽命和更低的生命週期資本密集度。
加強大型車輛二氧化碳和氮氧化物排放法規
從2020年代末期開始,歐盟的「歐盟7」排放標準將大幅降低電動卡車市場重型車輛的氮排放。此外,歐盟也強制要求到21世紀中葉大幅降低車輛二氧化碳排放總量。在美國,環保署的「第三階段」法規要求汽車製造商確保在未來10年內,新售出的8級卡車中有相當一部分是零排放車輛。違反這些法規將導致每輛牽引車被處以巨額罰款。同時,在中國,「國六B」標準即將適用於所有超過一定重量限制的卡車。此外,到本世紀末,都市區貨運的二氧化碳排放也將受到嚴格限制。作為一項積極措施,沃爾沃集團報告稱,今年其在歐洲的卡車銷量中有相當一部分是零排放車輛,因為運輸公司正在加快步伐,以達到歐7排放標準的最後期限。除了監管環境之外,ISO 14083 規定的強制性範圍 3 報告進一步收緊了對公司採購決策的監管。
兆瓦級充電基礎設施短缺
截至2026年初,全球電動卡車市場中兆瓦級充電系統(MCS)的運作數量仍然非常有限,遠落後於車輛部署速度。儘管戴姆勒-沃爾沃合資企業計劃在2027年前安裝大量高性能充電樁,但這僅能覆蓋主要貨運路線的一小部分。在美國,儘管聯邦政府的NEVI基金提供了大量資金,但由於授權程序延誤,截至2025年12月,僅有少數充電站投入運作。此外,倉庫的併網也造成了進一步的延誤。英國主要物流中心的併網存在嚴重的延誤。因此,承運商被迫超額配置電池組容量,導致單位成本大幅增加。
細分市場分析
到2025年,純電動卡車將佔據55.61%的市場佔有率,這主要得益於都市區充電網路的成熟以及250公里/天的續航里程得到保障。美國計畫在2030年投資興建7個氫能中心和200個重型卡車加氫站,預計2031年,燃料電池平台的複合年成長率將達到30.17%。 2024年,尼古拉公司推出了幾款8級燃料電池牽引車,凸顯了市場對長續航里程車輛日益成長的需求。基礎設施有限的地區的營運商越來越傾向於選擇配備柴油備用動力的插電式混合動力汽車。特別是沃爾沃的FH Electric混合動力車型,除了柴油備用動力外,還提供了相當不錯的純電續航里程。儘管在加州,即使考慮了能源平價因素,氫氣價格仍然遠高於柴油,但由於電解槽成本的下降,預計到本世紀末氫氣價格將大幅下降。電動卡車的市場格局正在改變。電池在最後一公里配送中發揮主導作用,而氫能在長途運輸中正在建立自己的獨特市場。
推動氫能發展的因素也包括其他面向。歐洲運輸企業優先考慮快速加氫,以最佳化駕駛人的運作;即將訂定的二氧化碳排放法規可能會導致因電池重量過重而降低負載容量,從而面臨罰款。值得注意的是,戴姆勒的GenH2燃料電池原型車已成功完成大規模示範運行,預計將於2025年底完成,從而消除了人們對其耐久性的擔憂。同時,磷酸鋰鐵技術的進步正在鞏固電池組在短程、高運量路線上的優勢,確保電池式電動車在繁華的都市區繼續發揮重要作用。
2025年,電動卡車市場中,12噸以上的重型卡車銷量佔比達43.47%,預計到2031年將維持30.19%的複合年成長率。這是因為加州、紐約州和歐盟要求到2032年,8級卡車銷售中必須有40%至50%為零排放車輛。截至2025年底,戴姆勒的eActros 600電動卡車憑藉其大容量磷酸鋰電池組和出色的實際續航里程,已獲得大量預訂單。中型卡車平台也已與市政當局和都市區簽訂了貨運合約。 2025年,比亞迪在北美市場嶄露頭角,交付了大量車輛,並成功競標都市區廢棄物收集計畫。在輕型卡車領域,Rivian的EDV-700憑藉其在最後一公里配送方面的成本優勢,實現了長距離行駛中令人印象深刻的運轉率。雖然長途曳引機上安裝的大容量電池會因負載容量減少而顯著降低其載貨能力,但這種權衡被認為是可接受的,因為損失的負載容量可以通過綠色貨物溢價來彌補。
業內相關人員正將目光聚焦於專業應用領域的細分市場,將其視為下一個發展前沿。自動卸貨卡車、多用途底盤和消防車因其運作週期與現場充電完美契合而備受關注。同時,在牽引車-半拖車配置方面,兆瓦級充電技術創新正被積極探索,以最大限度地減少停機時間。重型卡車的普及速度很可能決定電動卡車市場向其他車型擴展的軌跡。
區域分析
2025年,在歐盟二氧化碳排放框架下統一的合規政策和歐7排放標準的推動下,歐洲將佔據電動卡車市場36.77%的顯著佔有率。到當年年底,德國、法國和荷蘭在安裝高功率充電樁方面取得了顯著進展,確保了eActros 600和FH Electric等車型擁有充足的充電網路。在挪威,諸如免徵通行費和部分購車補貼等政策極大地促進了零排放卡車的普及,使其在新車註冊量中佔據了相當大的比例。相較之下,英國由於併網耗時較長,在實現倉庫電氣化方面面臨挑戰,儘管政府訂定了強力的獎勵,但大規模車隊的轉型進程仍然緩慢。
在亞太地區,電動卡車正憑藉中國的法規結構和補貼政策,在銷售上成為歐洲卡車的強勁競爭對手。日本對氫能基礎設施的大規模投資也推動了日野汽車的燃料電池研發計畫。同時,在印度,由於補貼政策的結束以及電動卡車的成本仍然遠高於柴油卡車,電動卡車的發展勢頭有所放緩。在澳大利亞,政府推出了多項舉措,資助建造充電站,並推動了州際貨運先導計畫。
北美地區正受惠於聯邦政府的獎勵以及各州層級的法規,這些法規要求在未來幾年內提高零排放卡車的銷售比例。特斯拉向各大公司交付電動卡車,凸顯了這些車輛在能源效率上的成本優勢。加拿大的財政獎勵也在推動電動卡車在主要物流路線的應用。預計到2031年,中東和非洲地區的電動卡車市場將以30.23%的複合年成長率成長,成為成長最快的地區,這主要得益於大規模的訂單以及各國政府為實現零排放商用車車隊目標而製定的宏偉計劃。在南非,儘管面臨擬議進口關稅的潛在挑戰,但電池驅動卡車仍在礦區進行試驗。在南美洲,政策差異正在影響市場。巴西的稅收推高了車輛價格,而智利對礦業車輛的財政援助則加速了該地區電動卡車的普及。
其他好處:
- Excel格式的市場預測(ME)表
- 3個月的分析師支持
目錄
第1章:引言
- 研究假設和市場定義
- 調查範圍
第2章:調查方法
第3章執行摘要
第4章:主要產業趨勢
- 都市化、人口以及對汽車和大眾運輸的需求
- 卡車市場電動車滲透率
- 燃油價格與電費差異(每公里,內燃機汽車與電動車)
- 電動車和內燃機汽車的總擁有成本 (TCO) 差異
- 資金籌措和所有權模式(貸款、租賃、認購)
- 電池化學成分構成比與電池組能量密度(例如,磷酸鐵鋰電池與鎳基碳化鋰電池等)
- 家庭、職場和公共充電樁的普及程度/密度
- 快速充電網路覆蓋範圍和輸出頻寬
- 替代燃料基礎設施(燃料電池電動車的氫氣)
- 補貼和消費者獎勵(購房、稅收、通行費和停車費減免)的價值
- 汽車製造商的電動車產品陣容和未來車型計劃
- 價值鍊和通路分析
- 監管、財政和產業政策框架
第5章 市場狀況
- 市場概覽
- 市場促進因素
- 電池組價格已跌破每千瓦時 100 美元。
- 加強大型車輛二氧化碳和氮氧化物排放法規
- 對企業車隊脫碳的承諾(重點在於範圍 3)
- 托運人提高「綠色貨運」合約的保費
- 主要物流走廊動態無線充電示範實驗
- 擴大拉丁美洲礦區電氣化的補貼
- 市場限制因素
- 百萬級充電基礎設施稀疏
- 新興市場高初始車輛成本與柴油車的比較
- 大型車輛段併網延誤
- 鎳錳供應鏈波動
- 價值供應鏈分析
- 監理情勢
- 技術展望
- 波特五力模型
第6章 市場規模與成長預測
- 依推進類型
- 電池式電動車(BEV)
- 燃料電池汽車(FCEV)
- 插電式混合動力車(PHEV)
- 按卡車類型
- 小型卡車(總重量3.5噸或以下)
- 中型卡車(3.6-12噸)
- 大型卡車(超過12噸)
- 聯結車
- 透過使用
- 物流/小包裹
- 市政服務(廢棄物、道路清潔)
- 建築和採礦
- 零售和日常消費品(FMCG)配送
- 公共產業和其他產業
- 按範圍
- 不到150公里
- 150~300 km
- 301~500 km
- 超過500公里
- 按電池容量
- 小於150度
- 150~300 kWh
- 301~500 kWh
- 超過500度
- 依馬達架構
- 單馬達
- 雙馬達
- 三電機/四電機
- 按地區
- 北美洲
- 美國
- 加拿大
- 其他北美國家
- 南美洲
- 巴西
- 阿根廷
- 智利
- 哥倫比亞
- 其他南美國家
- 歐洲
- 德國
- 法國
- 英國
- 義大利
- 西班牙
- 荷蘭
- 挪威
- 瑞典
- 俄羅斯
- 其他歐洲國家
- 亞太地區
- 中國
- 日本
- 印度
- 韓國
- 澳洲
- 紐西蘭
- 印尼
- 泰國
- 新加坡
- 其他亞太國家
- 中東和非洲
- 沙烏地阿拉伯
- 阿拉伯聯合大公國
- 土耳其
- 以色列
- 南非
- 奈及利亞
- 埃及
- 肯亞
- 其他中東和非洲國家
- 北美洲
第7章 競爭情勢
- 市場集中度
- 策略趨勢
- 市佔率分析
- 公司簡介
- BYD Auto Co. Ltd.
- Daimler Truck Holding AG
- Volvo Group
- Scania AB
- PACCAR Inc.
- Navistar International Corp.
- Isuzu Motors Ltd.
- Hino Motors Ltd.
- Dongfeng Motor Corporation
- Groupe Renault
- Tesla Inc.
- Nikola Corp.
- Rivian Automotive
- Hyundai Motor Co.
- Tata Motors Ltd.
- MAN Truck & Bus SE
- FAW Group
- Foton Motor
- Ashok Leyland
- Quantron AG
第8章 市場機會與未來展望
- 評估閒置頻段和未滿足的需求
第9章附錄
- 世界概覽
- 五力分析模型(詳細表)
- 全球價值鏈分析
- 市場動態(細緻的DRO)
- 資料來源與參考文獻
- 圖表一覽
- 主要發現
- 數據包
- 詞彙表
第10章:CEO應考慮的關鍵策略問題
According to Mordor Intelligence, the electric truck market size is estimated at USD 19.31 billion in 2026, and is expected to reach USD 72.11 billion by 2031, at a CAGR of 30.15% during the forecast period (2026-2031).
This report is Segmented by Propulsion Type (BEV, FCEV, and PHEV), Truck Type (Light, Medium, Heavy, and Tractor-Trailer), Application (Logistics, Municipal, Construction, Retail, and Utility), Range, Battery Capacity, Motor Architecture, and Geography. Market Forecasts are in Value (USD) and Volume (Units).
Global Electric Truck Market Trends and Insights
Battery-Pack Price Declines Below USD 100/kWh Threshold
In recent years, lithium-ion pack prices have significantly decreased in the electric truck market and are expected to continue declining, reaching cost parity with diesel tractors in the near future. Chinese cell manufacturers have driven this reduction, achieving notable advancements in energy density with high-volume LFP chemistries. Fleet operators are now experiencing faster payback periods on medium-duty urban routes, significantly shortening replacement cycles that were historically much longer. Recently, PepsiCo's operations in California reported substantially lower energy costs per mile for its Tesla Semi fleet compared to diesel Class 8 tractors. Additionally, LFP has captured a significant share of new electric truck battery capacity, demonstrating improved cycle life and reduced lifetime capital intensity.
Tightening CO2 & NOx Emission Mandates for Heavy Vehicles
Starting in the late 2020s, the European Union's Euro 7 limits will significantly reduce heavy-duty NOx emissions in the electric truck market. Additionally, the EU mandates a substantial reduction in fleet-wide CO2 emissions by mid-century . In the U.S., the EPA's Phase 3 rule requires OEMs to ensure a significant portion of new Class 8 sales are zero-emission within the next decade. Non-compliance comes with a hefty financial penalty per tractor. Meanwhile, in China, the National VI-b standards will apply to all trucks over a specific weight threshold starting in the near future . Furthermore, a stringent limit on urban freight CO2 emissions is set for the end of the decade. In a proactive move, Volvo Group reported selling a notable percentage of its trucks as zero-emission in Europe during the current year, as fleets rushed to meet the Euro 7 deadline. Adding to the regulatory landscape, mandatory Scope 3 reporting under ISO 14083 tightens the grip of regulations on corporate procurement decisions.
Sparse Megawatt-Class Charging Infrastructure
By early 2026, only a limited number of Megawatt Charging System (MCS) stations were operational globally in the electric truck market, lagging significantly behind the rollout of vehicles. The Daimler-Volvo joint venture plans to establish a significant number of high-performance charging points by 2027, but this will only service a small portion of the primary freight corridors. In the U.S., while federal NEVI funds allocated substantial financial resources, only a few charging sites became operational by December 2025, hindered by permitting delays. Additionally, interconnections at depots are causing further setbacks; National Grid ESO has indicated extensive wait times for connections at major logistics centers in the U.K. As a result, fleets are overspecifying their battery packs, significantly increasing unit costs.
Other drivers and restraints analyzed in the detailed report include:
- Corporate Fleet-Decarbonization Pledges (Scope 3 Focus)
- Growing Green-Freight Contract Premiums from Shippers
- High Up-Front Vehicle Cost vs. Diesel in Emerging Markets
For complete list of drivers and restraints, kindly check the Table Of Contents.
Segment Analysis
Battery-electric trucks commanded a 55.61% share in 2025, underpinned by maturing urban charging networks and dependable 250 km daily cycles. Fuel-cell platforms are set for a 30.17% CAGR through 2031 as the United States funds seven hydrogen hubs with 200 heavy-truck stations planned by 2030. In 2024, Nikola rolled out several Class 8 fuel-cell tractors, highlighting a burgeoning demand for vehicles capable of extended-range duties. Operators in regions with limited infrastructure are gravitating towards plug-in hybrids, which offer a diesel backup. Notably, Volvo's FH Electric hybrid combines a moderate electric range with an additional diesel margin. While hydrogen prices in California remain significantly higher than diesel when adjusted for energy parity, declining electrolyzer costs hint at a potential substantial reduction by the end of the decade. The electric truck landscape is evolving, with batteries leading the charge in last-mile deliveries, while hydrogen is carving a niche in long-haul transport.
Secondary dynamics are bolstering hydrogen's rise. European transporters prioritize swift refueling to optimize driver hours, and looming CO2 regulations threaten penalties for payload reductions due to hefty batteries. In a significant move, Daimler's GenH2 fuel-cell prototype successfully completed an extensive pilot run in late 2025, addressing durability concerns. Concurrently, advancements in lithium-iron-phosphate technology are solidifying battery packs' dominance on high-volume routes with shorter distances, ensuring battery-electric vehicles remain pivotal in bustling urban settings.
Heavy-duty models above 12 tonnes represented 43.47% of revenue in 2025 in the electric truck market and will post a 30.19% CAGR through 2031 as California, New York, and the EU demand 40-50% zero-emission Class 8 sales by 2032. By late 2025, Daimler's eActros 600, equipped with a large-capacity LFP pack and boasting an extensive real-world range, garnered significant pre-orders. Platforms in the medium-duty range are securing municipal and urban freight contracts; in 2025, BYD made a mark in North America, delivering a substantial number of units and clinching city waste-collection tenders. Light trucks, benefiting from a cost edge in last-mile services, saw Rivian's EDV-700 achieve impressive uptime over an extensive distance. While the large-capacity batteries on long-haul tractors impose a noticeable reduction in capacity due to payload penalties, the trade-off is deemed acceptable as green-freight premiums compensate for the lost tonnage.
Industry players are eyeing vocational niches as the next frontier. Tipper bodies, utility chassis, and fire-service rigs are in the spotlight, due to their duty cycles syncing perfectly with depot charging. Meanwhile, tractor-trailer setups are pursuing megawatt charging innovations to minimize downtime. The pace of heavy-duty adoption is poised to dictate the trajectory of the electric truck market's expansion into other classes.
Geography Analysis
In 2025, Europe held a significant share of the electric truck market with 36.77%, supported by the unified compliance signals of Euro 7 and the EU's CO2 framework. By the end of the year, Germany, France, and the Netherlands had made substantial progress in installing high-power chargers, ensuring adequate coverage for models like the eActros 600 and FH Electric. Norway's policies, including toll exemptions and partial funding of purchase prices, significantly boosted the adoption of zero-emission trucks, which formed a notable portion of new registrations. In contrast, the U.K. faced challenges with depot electrification due to prolonged grid connection timelines, which slowed the transition for large fleets despite the availability of strong incentives.
Asia Pacific, driven by China's large-scale deployment of electric trucks under its regulatory framework and subsidy programs, is emerging as a strong competitor to Europe in terms of volume. Japan's substantial investment in hydrogen infrastructure supports Hino's fuel-cell development plans. Meanwhile, India's momentum slowed following the expiration of its subsidy program, as the cost of electric trucks remained significantly higher than diesel alternatives. In Australia, government initiatives funded the installation of depot chargers, facilitating pilot projects for interstate freight operations.
North America benefits from federal incentives and state-level regulations mandating a higher share of zero-emission truck sales in the coming years. Tesla's delivery of electric trucks to major corporations highlighted the cost advantages of these vehicles in terms of energy efficiency. Canada's financial incentives have also encouraged the deployment of electric trucks along key logistics routes. The Middle East and Africa logs the fastest 30.23% CAGR through 2031 in the electric truck market, driven by large-scale orders and ambitious government targets for zero-emission commercial fleets. South Africa is testing battery-powered trucks in mining operations, despite potential challenges from proposed import duties. In South America, policy differences are shaping the market: Brazil's tax policies have increased vehicle prices, while Chile's funding for mining fleets is accelerating adoption in the region.
- BYD Auto Co. Ltd.
- Daimler Truck Holding AG
- Volvo Group
- Scania AB
- PACCAR Inc.
- Navistar International Corp.
- Isuzu Motors Ltd.
- Hino Motors Ltd.
- Dongfeng Motor Corporation
- Groupe Renault
- Tesla Inc.
- Nikola Corp.
- Rivian Automotive
- Hyundai Motor Co.
- Tata Motors Ltd.
- MAN Truck & Bus SE
- FAW Group
- Foton Motor
- Ashok Leyland
- Quantron AG
Additional Benefits:
- The market estimate (ME) sheet in Excel format
- 3 months of analyst support
TABLE OF CONTENTS
1 Introduction
- 1.1 Study Assumptions & Market Definition
- 1.2 Scope of the Study
2 Research Methodology
3 Executive Summary
4 Key Industry Trends
- 4.1 Urbanization, Population & Vehicle/Transit Demand
- 4.2 EV Penetration in Truck Market
- 4.3 Fuel vs Electricity Price Spread (Per km, ICE vs EV)
- 4.4 EV vs ICE Total Cost of Ownership (TCO) Gap
- 4.5 Financing & Ownership Models (Loans, Leasing, Subscription)
- 4.6 Battery Chemistry Mix & Pack Energy Density (LFP vs NMC etc.)
- 4.7 Home, Workplace & Public Charger Access / Density
- 4.8 Fast-Charging Network Coverage & Power Bands
- 4.9 Alternative Fuels Infrastructure (Hydrogen for FCEVs)
- 4.10 Subsidy & Consumer Incentive Value (Purchase, Tax, Toll/Parking Benefits)
- 4.11 OEM EV Line-up & Model Pipeline
- 4.12 Value-Chain & Distribution-Channel Analysis
- 4.13 Regulatory, Fiscal & Industrial Policy Framework
5 Market Landscape
- 5.1 Market Overview
- 5.2 Market Drivers
- 5.2.1 Battery-Pack Price Declines Below USD 100/Kwh Threshold
- 5.2.2 Tightening CO2 & NOX Emission Mandates for Heavy Vehicles
- 5.2.3 Corporate Fleet-Decarbonization Pledges (Scope 3 Focus)
- 5.2.4 Growing "Green-Freight" Contract Premiums from Shippers
- 5.2.5 Dynamic Wireless Charging Pilots on Key Logistics Corridors
- 5.2.6 Expanded Mining-Site Electrification Grants in Latam
- 5.3 Market Restraints
- 5.3.1 Sparse Megawatt-Class Charging Infrastructure
- 5.3.2 High Up-Front Vehicle Cost Vs Diesel in Emerging Markets
- 5.3.3 Grid-Connection Delays at Large Depot Sites
- 5.3.4 Nickel & Manganese Supply-Chain Volatility
- 5.4 Value / Supply-Chain Analysis
- 5.5 Regulatory Landscape
- 5.6 Technological Outlook
- 5.7 Porter's Five Forces
- 5.7.1 Competitive Rivalry
- 5.7.2 Threat of New Entrants
- 5.7.3 Threat of Substitutes
- 5.7.4 Bargaining Power of Suppliers
- 5.7.5 Bargaining Power of Buyers
6 Market Size & Growth Forecasts (Value (USD) and Volume (Units))
- 6.1 By Propulsion Type
- 6.1.1 Battery-Electric (BEV)
- 6.1.2 Fuel-Cell Electric (FCEV)
- 6.1.3 Plug-in Hybrid (PHEV)
- 6.2 By Truck Type
- 6.2.1 Light Truck (Less than or equal to 3.5 t GVW)
- 6.2.2 Medium-Duty Truck (3.6-12 t)
- 6.2.3 Heavy-Duty Truck (More than 12 t)
- 6.2.4 Tractor-Trailer
- 6.3 By Application
- 6.3.1 Logistics & Parcel
- 6.3.2 Municipal Services (Waste, Street-sweep)
- 6.3.3 Construction & Mining
- 6.3.4 Retail & FMCG Delivery
- 6.3.5 Utility & Other Industrial
- 6.4 By Range
- 6.4.1 Less than 150 km
- 6.4.2 150 - 300 km
- 6.4.3 301 - 500 km
- 6.4.4 More than 500 km
- 6.5 By Battery Capacity
- 6.5.1 Less than 150 kWh
- 6.5.2 150 - 300 kWh
- 6.5.3 301 - 500 kWh
- 6.5.4 More than 500 kWh
- 6.6 By Motor Architecture
- 6.6.1 Single-Motor
- 6.6.2 Dual-Motor
- 6.6.3 Tri/Quad-Motor
- 6.7 By Region
- 6.7.1 North America
- 6.7.1.1 United States
- 6.7.1.2 Canada
- 6.7.1.3 Rest of North America
- 6.7.2 South America
- 6.7.2.1 Brazil
- 6.7.2.2 Argentina
- 6.7.2.3 Chile
- 6.7.2.4 Colombia
- 6.7.2.5 Rest of South America
- 6.7.3 Europe
- 6.7.3.1 Germany
- 6.7.3.2 France
- 6.7.3.3 United Kingdom
- 6.7.3.4 Italy
- 6.7.3.5 Spain
- 6.7.3.6 Netherlands
- 6.7.3.7 Norway
- 6.7.3.8 Sweden
- 6.7.3.9 Russia
- 6.7.3.10 Rest of Europe
- 6.7.4 Asia Pacific
- 6.7.4.1 China
- 6.7.4.2 Japan
- 6.7.4.3 India
- 6.7.4.4 South Korea
- 6.7.4.5 Australia
- 6.7.4.6 New Zealand
- 6.7.4.7 Indonesia
- 6.7.4.8 Thailand
- 6.7.4.9 Singapore
- 6.7.4.10 Rest of Asia Pacific
- 6.7.5 Middle East and Africa
- 6.7.5.1 Saudi Arabia
- 6.7.5.2 United Arab Emirates
- 6.7.5.3 Turkey
- 6.7.5.4 Israel
- 6.7.5.5 South Africa
- 6.7.5.6 Nigeria
- 6.7.5.7 Egypt
- 6.7.5.8 Kenya
- 6.7.5.9 Rest of Middle East and Africa
- 6.7.1 North America
7 Competitive Landscape
- 7.1 Market Concentration
- 7.2 Strategic Moves
- 7.3 Market Share Analysis
- 7.4 Company Profiles (includes Global Level Overview, Market Level Overview, Core Segments, Financials as Available, Strategic Information, Market Rank/Share for Key Companies, Products and Services, SWOT Analysis, and Recent Developments)
- 7.4.1 BYD Auto Co. Ltd.
- 7.4.2 Daimler Truck Holding AG
- 7.4.3 Volvo Group
- 7.4.4 Scania AB
- 7.4.5 PACCAR Inc.
- 7.4.6 Navistar International Corp.
- 7.4.7 Isuzu Motors Ltd.
- 7.4.8 Hino Motors Ltd.
- 7.4.9 Dongfeng Motor Corporation
- 7.4.10 Groupe Renault
- 7.4.11 Tesla Inc.
- 7.4.12 Nikola Corp.
- 7.4.13 Rivian Automotive
- 7.4.14 Hyundai Motor Co.
- 7.4.15 Tata Motors Ltd.
- 7.4.16 MAN Truck & Bus SE
- 7.4.17 FAW Group
- 7.4.18 Foton Motor
- 7.4.19 Ashok Leyland
- 7.4.20 Quantron AG
8 Market Opportunities & Future Outlook
- 8.1 White-space & Unmet-Need Assessment
9 Appendix
- 9.1 Global Overview
- 9.2 Porter's Five Forces Framework (detailed tables)
- 9.3 Global Value-Chain Analysis
- 9.4 Market Dynamics (Detailed DROs)
- 9.5 Sources & References
- 9.6 List of Tables & Figures
- 9.7 Primary Insights
- 9.8 Data Pack
- 9.9 Glossary of Terms
10 Key Strategic Questions for CEOs
 重型電動卡車市場預測至 2034 年——按車輛類型、動力系統、電池容量、電池化學成分、續航里程、充電方式、組件、最終用戶和地區進行全球分析。
 電動卡車市場機會、成長促進因素、產業趨勢分析及2026-2035年預測
 電動卡車市場:2026-2032年全球市場預測(負載容量、卡車類型、動力系統、電池容量、應用和銷售管道)
 2026年全球電動卡車市場報告
 全球電動卡車市場規模、佔有率、趨勢和成長分析報告(2026-2034)
 電動卡車市場:按動力系統、車輛類型、續航里程和地區分類
 電動卡車市場規模、佔有率和趨勢分析報告:按車輛類型、驅動系統、續航里程、應用、地區和細分市場預測(2026-2033 年)卡車起重機底盤市場:按類型、負載能力、操作模式、應用和最終用戶產業分類-2026-2032年全球預測
 電動卡車市場規模、佔有率、趨勢和預測:按車輛類型、功率、續航里程、應用和地區分類,2026-2034年電動重型卡車市場機會、成長要素、產業趨勢分析及2026年至2035年預測