

 |
市場調查報告書
商品編碼
2066700
歐洲保固管理系統:市場佔有率分析、產業趨勢與統計及成長預測(2026-2031 年)Europe Warranty Management System - Market Share Analysis, Industry Trends & Statistics, Growth Forecasts (2026 - 2031) |
||||||
※ 本網頁內容可能與最新版本有所差異。詳細情況請與我們聯繫。
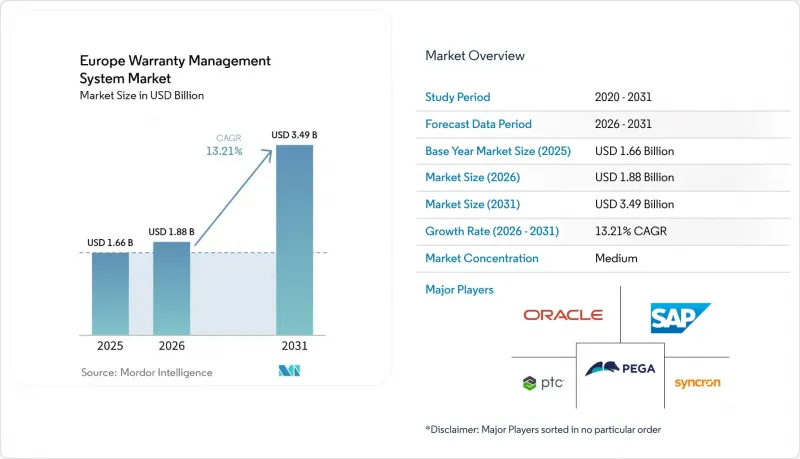
據 Mordor Intelligence 稱,歐洲保固管理系統市場預計將從 2025 年的 16.6 億美元成長到 2026 年的 18.8 億美元,到 2031 年達到 34.9 億美元,預計 2026 年至 2031 年的複合年成長率為 13.21%。
本報告按部署類型(本地部署和雲端部署)、軟體類型(安全保障智慧和分析、其他)、組件(解決方案和服務)、組織規模(大型企業和中小企業)、最終用戶行業(汽車和交通運輸、醫療設備、其他)以及國家/地區進行細分。市場預測以美元計價。
歐洲保固管理系統市場趨勢與洞察
售後服務營運中雲端原生技術的應用日益普及
製造商正從單一的保固環境轉向微服務架構。這是因為高彈性的運算環境能夠吸收來自連網產品的大量遙測數據,從而將引進週期從一年多縮短到不到三個月。德國和法國的汽車原始設備製造商 (OEM) 已開始將來自組裝商、經銷商和供應商的資料整合到組裝的雲端儲存庫中,以便外部維修店在歐盟資料法案於 2025 年 9 月生效後能夠獲得符合規定的記錄。每月費用低於 500 歐元(565 美元)的訂閱式 SaaS 套餐正吸引西班牙和義大利的中小型企業,他們希望避免在伺服器上進行資本投資。這種快速引進週期有助於降低整體擁有成本 (TCO),並加速預測分析的試點部署。
歐洲汽車召回數量及相關保固成本增加
2024年,汽車製造商支付了261.63億歐元(約295.7億美元)的保固索賠。此外,光是BMW的召回就需要提列10億歐元(約11.3億美元)的準備金。這種壓力促使企業投資開發自動化規則引擎,以便在數小時內(而非數週內)消除欺詐性索賠並調整供應商的扣回爭議帳款。即將訂定的「維修權」指令將延長選擇獨立維修店的客戶的保固期,這將增加管理複雜性,並促進可配置策略引擎的採用。將索賠歷史記錄與供應鏈品質數據相結合,可以建立預警儀表板,以便在發生大規模宣傳活動之前及時發出現場回應。
傳統製造業中分散的遺留IT環境
中型供應商通常使用已有數十年歷史的ERP系統和基於電子表格的工作流程,缺乏通用的資料模式,因此在遷移到雲端之前,需要花費18到36個月的時間進行資料清理和介面對接工作。義大利和西班牙的工廠仍然依賴SAP R/3或Oracle E-Business Suite,整合成本通常高達50萬歐元(約56.5萬美元),這使得它們只有在保固成本超過其收入的3%時才願意採用新系統。此外,國內市場和出口市場存在多個平行資料庫,這進一步加劇了挑戰,因為每個資料庫都遵循不同的監管分類體系,增加了資料核對的負擔。
細分市場分析
本地部署佔了 52.18% 的市場佔有率,尤其是在製造業、汽車業和工業等眾多企業中,這些企業高度重視對其數據和 IT 環境的嚴格控制。雲端解決方案正以 14.21% 的複合年成長率快速成長。在德國和法國,汽車原始設備製造商 (OEM) 正在採用雲端(混合)架構,將敏感的設計資料儲存在私有雲端中,同時在召回活動高峰期透過公用端點處理經銷商發票,從而確保其分散式經銷商網路的穩定性能。同時,南歐的中小型企業則呈現出不同的趨勢,他們完全跳過了混合階段,直接選擇完全託管的 SaaS 服務。這主要是由於付費使用制的經濟優勢以及八週內即可完成部署的優勢。英國國防相關企業仍然傾向於使用私有雲端來滿足安全協議的要求,但其在總支出中所佔比例很小。
在歐洲品質保證管理系統市場,隨著許多客戶端-伺服器平台的擴展支援於2028年結束,預計本地部署解決方案的預算將會縮減。供應商正透過打包「即裝即用」的加速器來應對這一變化,這些加速器可以將規則庫、索賠歷史記錄和供應商合約遷移到雲端,最大限度地減少停機時間。此外,公共雲端供應商還將合規文件和自動加密功能捆綁在一起,進一步獎勵了這一趨勢,使小規模的製造商無需額外聘請安全架構師即可通過監管審計。
儘管理賠管理引擎仍然是收集理賠資訊的重要基礎,但投資重點正轉向能夠偵測異常、預測故障並協調供應商恢復的智慧疊加層。到2025年,理賠管理在歐洲保固管理系統市場將佔41.56%的佔有率,但分析組合正以14.58%的複合年成長率成長,成為關鍵的採購標準。在評估平台時,原始設備製造商(OEM)現在不僅優先考慮可配置理賠欄位的數量,還優先考慮預測性維護評分的準確性。在德國,早期採用者正在對成本規避的節省進行基準測試,並在模型實施一年內實現了25%的成本降低。
隨著汽車製造商和消費電子品牌將多年保固納入初始定價,延長服務合約模組日益受到關注,同時也帶來了複雜的續約和收入確認邏輯。零件退貨和供應商召回工具雖然仍屬於小眾領域,但透過將維修責任重新分配給零件製造商,它們正在創造顯著價值。提供可視化故障分類、即時退貨授權 (RMA) 和自動產生借項通知單等功能的解決方案供應商,正獲得採購團隊的支持,這些團隊更注重回收率而非回收量來衡量績效。
其他好處:
- Excel格式的市場預測(ME)表
- 3個月的分析師支持
目錄
第1章:引言
- 研究假設和市場定義
- 調查範圍
第2章:調查方法
第3章執行摘要
第4章 市場狀況
- 市場概覽
- 市場促進因素
- 售後服務營運中雲端原生技術的應用日益普及
- 歐洲汽車召回數量的增加以及由此導致的保固成本增加。
- 符合歐盟數據法的數位轉型要求
- 過渡到預測分析以主動降低保固成本
- OEM廠商擴大採用嵌入式保固服務
- 與環境、社會和治理 (ESG) 相關的壓力,旨在延長產品生命週期並減少電子廢棄物。
- 市場限制因素
- 傳統製造業碎片化的遺留IT環境
- 熟練的保證資料科學家短缺
- 中小企業初始整合成本高昂
- 關於共用保證資料的網路安全和GDPR相關問題
- 產業價值鏈分析
- 監理情勢
- 技術展望
- 宏觀經濟因素對市場的影響
- 波特五力分析
第5章 市場規模與成長預測
- 依部署類型
- 現場
- 雲(公有雲、私有雲、混合雲)
- 軟體類型
- 保障情報與分析
- 索賠管理
- 服務合約管理
- 零件退貨和供應商回收
- 按組件
- 解決方案
- 服務
- 專業服務
- 託管服務
- 按組織規模
- 大公司
- 中小企業
- 按最終用戶行業分類
- 汽車和運輸業
- 工業設備和重型機械
- 耐用消費品和家用電器
- 建材
- 醫療器材
- 航太/國防
- 其他終端用戶產業
- 國家
- 德國
- 英國
- 法國
- 義大利
- 西班牙
- 荷蘭
- 其他歐洲國家
第6章 競爭情勢
- 市場集中度
- 策略趨勢
- 市佔率分析
- 公司簡介
- Oracle Corporation
- SAP SE
- PTC Inc.
- Pegasystems Inc.
- Syncron AB
- Tavant Technologies Inc.
- IFS AB
- ServiceNow Inc.
- Salesforce Inc.
- IBM Corporation
- DXC Technology Company
- Infosys Limited
- Wipro Limited
- Tech Mahindra Limited
- Accenture plc
- Astea International Inc.
- Mize Inc.
- ServiceMax Inc.
- Intranel Consulting Solutions Ltd.
- Intellinetics Inc.
第7章 市場機會與未來展望
According to Mordor Intelligence, the europe warranty management system market size is expected to increase from USD 1.66 billion in 2025 to USD 1.88 billion in 2026 and reach USD 3.49 billion by 2031, growing at a CAGR of 13.21% over 2026-2031.
This report is Segmented by Deployment Type (On-Premise, and Cloud), Software Type (Warranty Intelligence and Analytics, and More), Component (Solutions, and Services), Organization Size (Large Enterprises, and Small and Mid-Sized Enterprises), End-User Industry (Automotive and Transportation, Medical Devices, and More), and Country. The Market Forecasts are Provided in Terms of Value (USD).
Europe Warranty Management System Market Trends and Insights
Rising Cloud-Native Deployments In After-Sales Operations
Manufacturers are migrating from monolithic warranty environments to microservices because elastic compute absorbs telemetry spikes from connected products, shortening rollout cycles from more than a year to under 3 months. Automotive OEMs in Germany and France are already funneling assembly-plant, dealer, and supplier data into unified cloud repositories so that external repairers can retrieve compliant records once the EU Data Act enters force in September 2025. Subscription-based SaaS packages priced below EUR 500 (USD 565) per month are attracting Spanish and Italian SMEs seeking to avoid server capital expenditures. This rapid adoption cycle keeps the total cost of ownership low and accelerates the adoption of predictive analytics pilots.
Increasing European Automotive Recalls And Associated Warranty Costs
Automakers paid EUR 26.163 billion (USD 29.57 billion) in 2024 warranty claims, and a single BMW recall required EUR 1 billion (USD 1.13 billion) in provisions. Such pressure drives investment in automated rules engines that reject fraudulent claims and orchestrate supplier chargebacks in hours rather than weeks. The forthcoming Right to Repair directive, which extends warranty periods when customers choose independent repairers, amplifies administrative complexity and favors configurable policy engines. By unifying claim histories with supply-chain quality data, early-warning dashboards can trigger field actions before mass campaigns become inevitable.
Fragmented Legacy IT Landscapes In Traditional Manufacturing Firms
Mid-tier suppliers run decades-old ERP and spreadsheet workflows that lack common data schemas, adding 18-36 months of cleansing and interface work before cloud migration can start. Italian and Spanish plants that still rely on SAP R/3 or Oracle E-Business Suite often face EUR 500,000 (USD 565,000) integration tabs, discouraging adoption until warranty costs exceed 3% of revenue. Parallel domestic and export databases compound the challenge because each set follows different regulatory taxonomies, inflating reconciliation overhead.
Other drivers and restraints analyzed in the detailed report include:
- Digital Transformation Mandates Under EU Data Act Compliance
- Shift Toward Predictive Analytics For Proactive Warranty Cost Reduction
- Shortage Of Skilled Warranty Data Scientists
For complete list of drivers and restraints, kindly check the Table Of Contents.
Segment Analysis
On-premises installation held 52.18% market share, as many organizations, particularly in the manufacturing, automotive, and industrial sectors, prioritize stringent control over their data and IT environments. Cloud solutions are advancing at 14.21% CAGR. In Germany and France, automotive OEMs use cloud (hybrid) architectures, retaining sensitive design data in private clouds while routing dealer claims through public endpoints during recall spikes, ensuring performance remains stable across distributed dealer networks. Southern European SMEs demonstrate a different pattern, skipping hybrid stages altogether and subscribing directly to fully managed SaaS, driven by pay-per-use economics and the ability to roll out in eight weeks. While defense contractors in the United Kingdom still hedge toward private cloud to satisfy security protocols, their share of overall spending is small.
Looking ahead, the European warranty management system market will see on-premises budgets shrink after 2028, when extended support terms for many client-server platforms end. Vendors prepare by packaging lift-and-shift accelerators that migrate rule libraries, claim histories, and supplier contracts into cloud schemas with minimal downtime. As an added incentive, public cloud providers bundle compliance documentation and automated encryption, enabling smaller manufacturers to pass regulatory audits without hiring additional security architects.
Claim management engines will remain the mandatory backbone for capturing submissions, yet investment momentum is shifting toward intelligence overlays that detect anomalies, predict failures, and orchestrate supplier recovery. The Europe warranty management system market share for claim management stood at 41.56% in 2025, but analytics portfolios, growing at 14.58% CAGR, are becoming a pivotal buying criterion. OEMs now evaluate platforms on the accuracy of predictive maintenance scores, not just the number of configurable claim fields. In Germany, early adopters benchmark cost-avoidance savings, recording 25% reductions within a year of model deployment.
Extended service-contract modules gain traction because automakers and appliance brands embed multi-year coverage into upfront pricing, adding complex renewal and revenue-recognition logic. Parts returns and supplier recovery tools, although niche, generate outsized value by reallocating repair liability back to component makers. Solution providers that furnish visual fault classification, real-time return merchandise authorization (RMA), and automatic debit note creation gain favor with procurement teams that measure performance on recovery yield rather than throughput.
List of Companies Covered in this Report:
- Oracle Corporation
- SAP SE
- PTC Inc.
- Pegasystems Inc.
- Syncron AB
- Tavant Technologies Inc.
- IFS AB
- ServiceNow Inc.
- Salesforce Inc.
- IBM Corporation
- DXC Technology Company
- Infosys Limited
- Wipro Limited
- Tech Mahindra Limited
- Accenture plc
- Astea International Inc.
- Mize Inc.
- ServiceMax Inc.
- Intranel Consulting Solutions Ltd.
- Intellinetics Inc.
Additional Benefits:
- The market estimate (ME) sheet in Excel format
- 3 months of analyst support
TABLE OF CONTENTS
1 INTRODUCTION
- 1.1 Study Assumptions and Market Definition
- 1.2 Scope of the Study
2 RESEARCH METHODOLOGY
3 EXECUTIVE SUMMARY
4 MARKET LANDSCAPE
- 4.1 Market Overview
- 4.2 Market Drivers
- 4.2.1 Rising Cloud Native Deployments in After-Sales Operations
- 4.2.2 Increasing European Automotive Recalls and Associated Warranty Costs
- 4.2.3 Digital Transformation Mandates Under EU Data Act Compliance
- 4.2.4 Shift Toward Predictive Analytics for Proactive Warranty Cost Reduction
- 4.2.5 Growing Adoption of Embedded Warranty Offerings by OEMs
- 4.2.6 ESG-Linked Pressure to Extend Product Lifecycles and Reduce E-Waste
- 4.3 Market Restraints
- 4.3.1 Fragmented Legacy IT Landscapes in Traditional Manufacturing Firms
- 4.3.2 Shortage of Skilled Warranty Data Scientists
- 4.3.3 High Initial Integration Costs for SMEs
- 4.3.4 Cybersecurity and GDPR-Related Concerns Over Warranty Data Sharing
- 4.4 Industry Value-Chain Analysis
- 4.5 Regulatory Landscape
- 4.6 Technological Outlook
- 4.7 Impact of Macroeconomic Factors on the Market
- 4.8 Porter's Five Forces Analysis
- 4.8.1 Threat of New Entrants
- 4.8.2 Bargaining Power of Suppliers
- 4.8.3 Bargaining Power of Buyers
- 4.8.4 Threat of Substitutes
- 4.8.5 Competitive Rivalry
5 MARKET SIZE AND GROWTH FORECASTS (VALUE)
- 5.1 By Deployment Type
- 5.1.1 On-premise
- 5.1.2 Cloud (Public, Private, Hybrid)
- 5.2 By Software Type
- 5.2.1 Warranty Intelligence and Analytics
- 5.2.2 Claim Management
- 5.2.3 Service Contract Administration
- 5.2.4 Parts Returns and Supplier Recovery
- 5.3 By Component
- 5.3.1 Solutions
- 5.3.2 Services
- 5.3.2.1 Professional Services
- 5.3.2.2 Managed Services
- 5.4 By Organization Size
- 5.4.1 Large Enterprises
- 5.4.2 Small and Mid-sized Enterprises (SMEs)
- 5.5 By End-user Industry
- 5.5.1 Automotive and Transportation
- 5.5.2 Industrial Equipment and Heavy Machinery
- 5.5.3 Consumer Durables and Home Appliances
- 5.5.4 Construction and Building Materials
- 5.5.5 Medical Devices
- 5.5.6 Aerospace and Defence
- 5.5.7 Other End-user Industries
- 5.6 By Country
- 5.6.1 Germany
- 5.6.2 United Kingdom
- 5.6.3 France
- 5.6.4 Italy
- 5.6.5 Spain
- 5.6.6 Netherlands
- 5.6.7 Rest of Europe
6 COMPETITIVE LANDSCAPE
- 6.1 Market Concentration
- 6.2 Strategic Moves
- 6.3 Market Share Analysis
- 6.4 Company Profiles (includes Global Level Overview, Market Level Overview, Core Segments, Financials as available, Strategic Information, Market Rank/Share, Products and Services, Recent Developments)
- 6.4.1 Oracle Corporation
- 6.4.2 SAP SE
- 6.4.3 PTC Inc.
- 6.4.4 Pegasystems Inc.
- 6.4.5 Syncron AB
- 6.4.6 Tavant Technologies Inc.
- 6.4.7 IFS AB
- 6.4.8 ServiceNow Inc.
- 6.4.9 Salesforce Inc.
- 6.4.10 IBM Corporation
- 6.4.11 DXC Technology Company
- 6.4.12 Infosys Limited
- 6.4.13 Wipro Limited
- 6.4.14 Tech Mahindra Limited
- 6.4.15 Accenture plc
- 6.4.16 Astea International Inc.
- 6.4.17 Mize Inc.
- 6.4.18 ServiceMax Inc.
- 6.4.19 Intranel Consulting Solutions Ltd.
- 6.4.20 Intellinetics Inc.
7 MARKET OPPORTUNITIES AND FUTURE OUTLOOK
- 7.1 White-Space and Unmet-Need Assessment
 保固管理市場:2026-2032年全球市場預測(依解決方案、部署類型、企業規模、保固類型和最終用戶產業分類)
 2026年全球房屋保固服務市場報告
 保固管理系統市場 - 全球產業規模、佔有率、趨勢、機會及預測(按解決方案、應用、地區和競爭格局分類,2021-2031年)家庭保固服務市場-全球產業規模、佔有率、趨勢、機會和預測:按承保類型、物業類型、服務提供者、地區和競爭格局分類,2021-2031年
 全球汽車保固管理市場全球住宅保固服務市場:2034 年之前的市場機會與策略
 保固管理系統市場(按解決方案、應用和區域分類)
 保固管理系統:市場佔有率分析、產業趨勢/統計、成長預測(2025-2030)汽車保固管理:市場佔有率分析、產業趨勢/統計、成長預測(2024-2029)