


 |
市場調查報告書
商品編碼
2066649
突波保護裝置:市場佔有率分析、產業趨勢與統計、成長預測(2026-2031 年)Surge Protection Devices - Market Share Analysis, Industry Trends & Statistics, Growth Forecasts (2026 - 2031) |
||||||

※ 本網頁內容可能與最新版本有所差異。詳細情況請與我們聯繫。
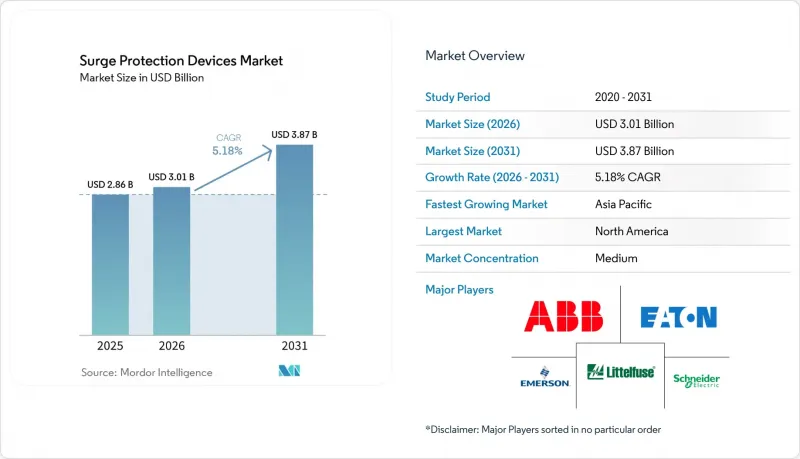
據 Mordor Intelligence 稱,突波保護設備市場預計到 2026 年價值 30.1 億美元,高於 2025 年的 28.6 億美元,預計到 2031 年將達到 38.7 億美元。
預計從 2026 年到 2031 年,其複合年成長率將達到 5.18%。
本報告依安裝類型(硬佈線、插電式、線路編碼)、放電電流額定值(10 kA 或以下、10 kA 至 25 kA、25 kA 或以上)、電壓等級(低壓 [低於 1 kV]、中壓 [1 至 35 kV]、高壓 [35 kV 或以上]、最終用戶產業中壓 [1 至 35 kV]、高壓 [35 住宅或以上])、最終市場預測以美元 (USD) 為單位。
全球突波保護設備市場趨勢及洞察
智慧家庭和物聯網設備的廣泛應用
如今,智慧家庭生態系統通常包含價值超過 15,000 美元的電子設備,一旦發生突波,家庭將面臨巨大的經濟風險。連網照明、家電和安防系統中的微處理器對電壓瞬變高度敏感,突波損壞一個節點可能會蔓延至整個網路。因此,全住宅突波保護正逐漸成為標準配置,取代了單一插座的突波保護器。製造商將電源和數據線保護整合到一個機殼中,以簡化安裝。保險公司也透過降低已安裝突波保護器的住宅的保費來支持這一趨勢,從而提振了住宅市場的需求。隨著人們對家庭自動化平台的熟悉程度不斷提高,功能豐富、易於安裝、可與行動應用程式同步並提供狀態警報的即插即用型浪湧保護器的用戶群也在進一步擴大。
可再生能源的引入導致電網穩定性日益下降。
預計到2030年,風能和太陽能發電將佔全球電力供應的40%以上,但基於逆變器的電源缺乏傳統保護繼電器所需的高故障電流。隨著電力公司調整發電量以適應波動的電力輸出,開關引起的瞬態現像日益頻繁,對傳統的保護方法構成了挑戰。數位繼電器和數據驅動的電弧閃光控制技術正日益普及,從而催生了對能夠在更寬的電壓範圍和波動波形下可靠工作的突波保護裝置的需求。目前的創新重點在於能夠同時應對雷擊和開關引起的事件的裝置,而熱屏蔽技術則可防止壓敏電阻(MOV)元件過早劣化。
現有設施的維修和安裝成本高昂
在幾十年前建造的工廠中實施全廠範圍的突波保護系統通常需要升級配電盤、重新鋪設管道,甚至需要臨時停機。雖然商用級設備的配電盤成本為 300 至 700 美元,而每個配電盤的專業安裝費用為 100 至 200 美元,但生產停機造成的損失可能遠遠超過硬體成本。許多工廠利潤微薄,因此會推遲升級,直到法規變更或保險續保要求強制執行。供應商正在提案諸如母線安裝式改裝套件和分離式電流檢測設計等解決方案來縮短安裝時間,但人們普遍認為投資回收期過長,這仍然是推廣應用的主要障礙,尤其是在基礎設施老化的成熟工業國家。
細分市場分析
由於設施工程師更傾向於將設備永久整合到配電盤和配電箱中,因此,2025 年硬佈線佔總銷售額的 45.40%。這種配置可提供最低的傳輸電壓,使其成為生產線、無塵室和資料中心等對運作要求極高的場所的首選。智慧型裝置現在包含現場可更換模組和基於 Web 的儀表板,從而簡化了維護計劃。
儘管插電式浪湧保護器 (SPD) 的市場佔有率目前落後於其他類型,但在智慧家庭持續蓬勃發展的背景下,預計其在 2026 年至 2031 年間將以 6.05% 的複合年成長率 (CAGR) 實現最高成長。保險激勵措施和應用程式支援的電能品質分析功能正鼓勵住宅從基本的電源分接頭升級到連網型號。線路編碼突波保護器採用纖薄機殼和內建 RJ45 端口,可同時保護電源和訊號,確保關鍵伺服器和影音設備的安全。隨著監管機構不斷提高保護要求,將有線突波模組與下游電源插座結合的混合設備正在商業建築中湧現,以滿足其對整體系統連接性的需求。
中等容量(10 kA 至 25 kA)產品憑藉其在辦公大樓、零售連鎖店和輕工業車間等場所均衡的性價比,預計到 2025 年將佔總銷售額的 51.30%。製造商正在最佳化元件數量,以在滿足 IEC 61643-11 Type 2 標準限制的同時,保持緊湊的面積。此細分市場構成了協同解決方案的基礎:服務入口單元負責處理高能量事件,而下游配電盤則依賴 10 kA 至 25 kA 模組提供的精細箝位保護。
預計到2031年,額定電流超過25 kA的浪湧保護器將以6.32%的複合年成長率成長,這主要得益於資料中心機架密度超過每機櫃15 kW以及整合電池儲能的可再生能源變電站的普及。隨著電池系統的持續工作電壓額定值提升至1500 V DC,突波保護器設計也開始採用更多種類的MOV壓敏電阻堆和火花隙元件。同時,額定電流高達10 kA的突波保護器則用於保護消費性電子產品和SOHO(小規模辦公室/家庭辦公室)設備。隨著消費者將電視、遊戲機和智慧家電連接到整合式娛樂中心,對價格合理且可靠的保護設備的需求也穩步成長。
區域分析
2025年,北美地區佔全球銷售額的39.60%。美國是這一趨勢的核心,該國的《國家電氣規範》(NEC)現已強制要求所有住宅電力裝置採用1型或2型浪湧保護。資料中心的擴張推動了高容量入戶突波保護器(SPD)需求的成長。加拿大的突波保護市場也呈現出與美國類似的趨勢,各省均已採用類似的標準,電力公司正在推廣“全住宅項目”,為每台電器提供高達5000美元的補償。
亞太地區預計到2031年將實現5.98%的複合年成長率,成為成長最快的地區,這主要得益於製造業投資向印度和東南亞的轉移。中國和日本正在推動蓬勃發展的即插即用型商用市場,包括在便利商店和微型資料中心部署緊湊型DIN導軌式突波保護器(SPD)。此外,政府擴大可再生能源部署的計畫加劇了電網穩定性方面的挑戰,從而推動了對25 kA及以上逆變器產品的需求。隨著建設週期的縮短,區域性原始設備製造商(OEM)正與跨國品牌合作實現在地化生產,從而縮短交貨前置作業時間。
歐洲憑藉嚴格的設備標準和積極的脫碳目標,保持著強大的市場佔有率,這些標準和目標正在重塑電網拓撲結構。德國的「能源轉型」(Energiewende)和丹麥的離岸風力發電電場正在引入新型66千伏特輸電電纜,每條電纜都需要安裝線路突波保護器以穩定電壓。企業永續發展目標進一步推動了不使用六氟化硫(SF6)的環保突波保護器的應用。同時,南美、中東和非洲等新興市場,隨著都市區電氣化和通訊基礎設施現代化,對突波保護器的需求逐漸成長。官民合作關係建置的微電網,結合了太陽能和儲能技術,越來越需要採用協調一致的突波保護解決方案,以最大限度地延長資產運作。
其他好處:
- Excel格式的市場預測(ME)表
- 3個月的分析師支持
目錄
第1章:引言
- 研究假設和市場定義
- 調查範圍
第2章:調查方法
第3章執行摘要
第4章 市場狀況
- 市場概覽
- 市場促進因素
- 智慧家庭和物聯網設備的廣泛應用
- 引入可再生能源導致電網穩定性下降
- 提高資料中心和通訊的功率密度
- 引進電動車充電基礎設施需要安裝服務入口點 SPD(服務處理裝置)。
- 安裝SPD的保險費優惠
- 市場限制因素
- 現有設施的維修和安裝成本高昂
- 終端用戶對隱性SPD故障率的認知度較低。
- 不斷變化的SPD認證方案引發了許多困惑
- 金屬氧化物壓敏電阻的地緣政治供不應求
- 價值供應鏈分析
- 監理情勢
- 技術展望
- 波特五力模型
- 新冠疫情的影響及其長期影響。
第5章 市場規模與成長預測
- 按安裝類型
- 有線連接
- 外掛
- 線路代碼
- 放電電流額定值
- 10千安或更小
- 10 kA~25 kA
- 25 kA 或更高
- 電壓等級
- 低電壓(低於1千伏特)
- 中壓(1-35千伏特)
- 高壓(35千伏或更高)
- 按最終用戶行業分類
- 產業
- 商業的
- 住宅
- 按地區
- 北美洲
- 美國
- 加拿大
- 歐洲
- 英國
- 德國
- 法國
- 義大利
- 西班牙
- 俄羅斯
- 其他歐洲國家
- 亞太地區
- 中國
- 日本
- 印度
- 韓國
- 澳洲和紐西蘭
- 其他亞太國家
- 南美洲
- 巴西
- 其他南美國家
- 中東和非洲
- 中東
- 沙烏地阿拉伯
- 阿拉伯聯合大公國
- 土耳其
- 其他中東國家
- 非洲
- 南非
- 其他非洲國家
- 中東
- 北美洲
第6章 競爭情勢
- 市場集中度
- 策略趨勢
- 市佔率分析
- 公司簡介
- ABB Ltd
- Eaton Corporation plc
- Emerson Electric Co.
- Schneider Electric SE
- Siemens AG
- Littelfuse Inc.
- Legrand SA
- Leviton Manufacturing Co. Inc.
- Hubbell Inc.
- Tripp Lite(Eaton brand)
- Belkin International Inc.
- General Electric Co.
- Phoenix Contact GmbH and Co. KG
- Citel Electronics Inc.
- OBO Bettermann Holding GmbH
- Mersen SA
- Raycap Corporation
- nVent Electric plc(ERICO)
- Hager Group
- Delta Electronics Inc.
第7章 市場機會與未來展望
According to Mordor Intelligence, the surge protection devices market size in 2026 is estimated at USD 3.01 billion, growing from 2025 value of USD 2.86 billion with 2031 projections showing USD 3.87 billion, growing at 5.18% CAGR over 2026-2031.
This report is Segmented by Installation Type (Hard-Wired, Plug-In, and Line Cord), Discharge-Current Rating (up To 10KA, 10KA-25KA, and Above 25KA), Voltage Class (Low-Voltage [Less Than 1 KV], Medium-Voltage [1-35 KV], and High-Voltage [More Than 35 KV]), End-User Vertical (Industrial, Commercial, and Residential), and Geography. The Market Forecasts are Provided in Terms of Value (USD).
Global Surge Protection Devices Market Trends and Insights
Rising adoption of smart-home and IoT devices
Smart-home ecosystems now often hold electronics worth more than USD 15,000, exposing households to material financial risk when surges occur. Microprocessors in connected lighting, appliances, and security systems are highly sensitive to voltage transients, and a surge harming one node can propagate through the network. Whole-house surge protection therefore is replacing point-of-use strips, and manufacturers are bundling power-line and data-line protection in a single enclosure to simplify installation. Insurance carriers reinforce this trend by lowering premiums for protected homes, boosting demand in the residential segment. Growing familiarity with home-automation platforms further widens the audience for feature-rich but easy-to-install plug-in SPDs that sync with mobile apps for status alerts.
Growing grid-instability from renewables integration
Wind and solar are projected to supply over 40% of global generation by 2030, yet inverter-based resources lack the high fault currents required by traditional protective relays. As utilities cycle generation to match variable output, switching-induced transients become more frequent, challenging legacy protection schemes. Digital relays and data-driven arc-flash controls are gaining favor, creating demand for surge devices that perform reliably across wider voltage envelopes and fluctuating waveforms. Innovation now centers on devices capable of handling both lightning-induced and switching-induced events, with thermal-disconnect technology protecting MOV elements from accelerated aging.
High retrofit installation cost in legacy facilities
Installing whole-building surge protection in plants built decades ago often necessitates panelboard upgrades, conduit rerouting, or even brief shutdowns. Material costs for a commercial-grade unit run USD 300-700, and professional labor adds USD 100-200 per board, but production downtime can dwarf hardware expense. Many facilities operate on tight margins and defer upgrades until mandated by code revisions or insurance renewals. Vendors are countering with bus-mounted retrofit kits and split-core current-sensing designs that shorten installation windows, yet the perceived payback period still slows adoption, especially in mature industrial economies with aging infrastructure.
Other drivers and restraints analyzed in the detailed report include:
- Expansion of data-center and telecom power density
- EV-charging infrastructure mandates service-entrance SPDs
- Low end-user awareness of hidden SPD failure rates
For complete list of drivers and restraints, kindly check the Table Of Contents.
Segment Analysis
The hard-wired category accounted for 45.40% of 2025 revenue as facility engineers prefer devices permanently integrated into switchboards and distribution panels. This configuration offers the lowest let-through voltage, making it a default choice for production lines, cleanrooms, and data halls where uptime is paramount. Smart variants now include field-replaceable modules and web-based dashboards that simplify maintenance schedules.
Plug-in SPDs trail in share but will register the fastest CAGR at 6.05% between 2026-2031 as the smart-home boom continues. Insurance premium incentives and app-enabled power-quality analytics coax homeowners to upgrade from basic strips to networked models. The line-cord niche secures critical servers and audiovisual gear, leveraging slim enclosures and integrated RJ45 ports for combined power-and-signal defense. As code bodies widen protection mandates, hybrid devices that merge hard-wired surge modules with downstream receptacle strips are appearing in commercial buildings seeking whole-system coordination.
Medium-capacity (10 kA-25 kA) products captured 51.30% of turnover in 2025 by balancing price and performance for office towers, retail chains, and light-industrial workshops. Manufacturers optimize component counts to keep footprints compact while meeting IEC 61643-11 Type 2 limits. This segment anchors coordinated-level approaches where service-entrance units handle high-energy events and downstream boards rely on 10 kA-25 kA modules for fine clamping.
Above-25 kA units will rise at a 6.32% CAGR through 2031, propelled by data-center rack densities that exceed 15 kW per cabinet and renewable-energy substations integrating battery storage. Continuous-operating-voltage ratings climb to 1,500 V DC in battery systems, so surge designs add wider MOV stacks and spark-gap elements. At the other end, up-to-10 kA strips protect home electronics and SOHO gear. Demand here expands steadily as consumers connect televisions, gaming consoles, and smart appliances into unified entertainment hubs that require affordable yet reliable protection.
Geography Analysis
North America contributed 39.60% of global revenue in 2025, anchored by the United States, where the National Electrical Code now mandates Type 1 or Type 2 protection for all dwelling services. Data-center expansion amplifies demand for high-capacity, service-entrance SPDs. The surge protection devices market size in Canada mirrors the U.S. trajectory as provinces adopt similar code language and utilities promote whole-home programs offering coverage up to USD 5,000 per appliance.
Asia-Pacific will post the fastest 5.98% CAGR to 2031 as manufacturing investment shifts toward India and Southeast Asia. China and Japan drive a thriving plug-in commercial segment, equipping convenience stores and micro-data centers with compact, DIN-rail SPDs. Government plans to lift renewable-energy penetration also accentuate grid-stability challenges, spurring demand for 25 kA-plus products at inverter stations. Regional OEMs partner with multinational brands to localize production, reducing lead times as construction cycles tighten.
Europe maintains a solid share thanks to tight equipment standards and aggressive decarbonization targets that remake grid topology. Germany's Energiewende and Denmark's offshore wind arrays entail new 66 kV export cables, each requiring line-surge arresters for voltage stabilization. Corporate sustainability goals further encourage the adoption of eco-friendly arresters that eschew SF6. Meanwhile, South America, the Middle East, and Africa represent emerging pockets where urban electrification and telecom modernization seed incremental volumes. Public-private partnerships building solar-plus-storage microgrids increasingly specify coordinated surge solutions to maximize asset uptime.
- ABB Ltd
- Eaton Corporation plc
- Emerson Electric Co.
- Schneider Electric SE
- Siemens AG
- Littelfuse Inc.
- Legrand SA
- Leviton Manufacturing Co. Inc.
- Hubbell Inc.
- Tripp Lite (Eaton brand)
- Belkin International Inc.
- General Electric Co.
- Phoenix Contact GmbH and Co. KG
- Citel Electronics Inc.
- OBO Bettermann Holding GmbH
- Mersen SA
- Raycap Corporation
- nVent Electric plc (ERICO)
- Hager Group
- Delta Electronics Inc.
Additional Benefits:
- The market estimate (ME) sheet in Excel format
- 3 months of analyst support
TABLE OF CONTENTS
1 INTRODUCTION
- 1.1 Study Assumptions and Market Definition
- 1.2 Scope of the Study
2 RESEARCH METHODOLOGY
3 EXECUTIVE SUMMARY
4 MARKET LANDSCAPE
- 4.1 Market Overview
- 4.2 Market Drivers
- 4.2.1 Rising adoption of smart-home and IoT devices
- 4.2.2 Growing grid-instability from renewables integration
- 4.2.3 Expansion of data-center and telecom power density
- 4.2.4 EV-charging infrastructure mandates service-entrance SPDs
- 4.2.5 Insurance-premium incentives for installing SPDs
- 4.3 Market Restraints
- 4.3.1 High retrofit installation cost in legacy facilities
- 4.3.2 Low end-user awareness of hidden SPD failure rates
- 4.3.3 Confusion over evolving SPD certification schemes
- 4.3.4 Geopolitical shortages of metal-oxide varistors
- 4.4 Value / Supply-Chain Analysis
- 4.5 Regulatory Landscape
- 4.6 Technological Outlook
- 4.7 Porter's Five Forces
- 4.7.1 Bargaining Power of Suppliers
- 4.7.2 Bargaining Power of Buyers
- 4.7.3 Threat of New Entrants
- 4.7.4 Intensity of Competitive Rivalry
- 4.7.5 Threat of Substitutes
- 4.8 Impact of COVID-19 and Long-COVID Effects
5 MARKET SIZE AND GROWTH FORECASTS (VALUES)
- 5.1 By Installation Type
- 5.1.1 Hard-Wired
- 5.1.2 Plug-In
- 5.1.3 Line Cord
- 5.2 By Discharge-Current Rating
- 5.2.1 Up to 10 kA
- 5.2.2 10 kA-25 kA
- 5.2.3 Above 25 kA
- 5.3 By Voltage Class
- 5.3.1 Low-Voltage (Less than 1 kV)
- 5.3.2 Medium-Voltage (1-35 kV)
- 5.3.3 High-Voltage (More than 35 kV)
- 5.4 By End-User Vertical
- 5.4.1 Industrial
- 5.4.2 Commercial
- 5.4.3 Residential
- 5.5 By Geography
- 5.5.1 North America
- 5.5.1.1 United States
- 5.5.1.2 Canada
- 5.5.2 Europe
- 5.5.2.1 United Kingdom
- 5.5.2.2 Germany
- 5.5.2.3 France
- 5.5.2.4 Italy
- 5.5.2.5 Spain
- 5.5.2.6 Russia
- 5.5.2.7 Rest of Europe
- 5.5.3 Asia-Pacific
- 5.5.3.1 China
- 5.5.3.2 Japan
- 5.5.3.3 India
- 5.5.3.4 South Korea
- 5.5.3.5 Australia and New Zealand
- 5.5.3.6 Rest of Asia-Pacific
- 5.5.4 South America
- 5.5.4.1 Brazil
- 5.5.4.2 Rest of South America
- 5.5.5 Middle East and Africa
- 5.5.5.1 Middle East
- 5.5.5.1.1 Saudi Arabia
- 5.5.5.1.2 United Arab Emirates
- 5.5.5.1.3 Turkey
- 5.5.5.1.4 Rest of Middle East
- 5.5.5.2 Africa
- 5.5.5.2.1 South Africa
- 5.5.5.2.2 Rest of Africa
- 5.5.5.1 Middle East
- 5.5.1 North America
6 COMPETITIVE LANDSCAPE
- 6.1 Market Concentration
- 6.2 Strategic Moves
- 6.3 Market Share Analysis
- 6.4 Company Profiles (includes Global-level Overview, Market-level overview, Core Segments, Financials as available, Strategic Information, Market Rank/Share for key companies, Products and Services, and Recent Developments)
- 6.4.1 ABB Ltd
- 6.4.2 Eaton Corporation plc
- 6.4.3 Emerson Electric Co.
- 6.4.4 Schneider Electric SE
- 6.4.5 Siemens AG
- 6.4.6 Littelfuse Inc.
- 6.4.7 Legrand SA
- 6.4.8 Leviton Manufacturing Co. Inc.
- 6.4.9 Hubbell Inc.
- 6.4.10 Tripp Lite (Eaton brand)
- 6.4.11 Belkin International Inc.
- 6.4.12 General Electric Co.
- 6.4.13 Phoenix Contact GmbH and Co. KG
- 6.4.14 Citel Electronics Inc.
- 6.4.15 OBO Bettermann Holding GmbH
- 6.4.16 Mersen SA
- 6.4.17 Raycap Corporation
- 6.4.18 nVent Electric plc (ERICO)
- 6.4.19 Hager Group
- 6.4.20 Delta Electronics Inc.
7 MARKET OPPORTUNITIES AND FUTURE OUTLOOK
- 7.1 White-space and Unmet Need Analysis

 住宅突波保護器市場:市場機會、成長要素、產業趨勢分析及2026-2035年預測
 突波保護器市場:依產品、產品類型、額定功率、最終用途、國家及地區分類-全球產業分析、市場規模、市場佔有率及2026年至2033年預測
 突波保護器市場:依產品類型、安裝類型、相數類型、技術類型、銷售管道和應用分類-全球預測,2026-2032年
 突波保護器(SPD)-2026-2032年全球市佔率及排名、總收入及需求預測
 突波保護裝置市場:按類型、功率範圍、最終用戶和地區分類。
 突波保護器市場規模、佔有率和趨勢分析報告:按產品、產品類型、額定功率、應用、地區和細分市場分類(2026-2033 年)
 2026年全球瞬態保護裝置市場報告颶風因應市場規模、佔有率和趨勢分析報告:按產品、材料、應用、分銷管道、最終用途、地區和細分市場預測(2026-2033 年)
 突波保護設備的全球市場(2025年):終端用戶,用途,競爭企業:分析與預測
 突波保護零組件的全球市場(2025年)- 終端用戶,用途,競爭企業