


 |
市場調查報告書
商品編碼
2066631
離網太陽能:市場佔有率分析、產業趨勢與統計及成長預測(2026-2031 年)Off-Grid Solar Energy - Market Share Analysis, Industry Trends & Statistics, Growth Forecasts (2026 - 2031) |
||||||

※ 本網頁內容可能與最新版本有所差異。詳細情況請與我們聯繫。
根據 Mordor Intelligence 預測,離網太陽能市場(按裝置容量計算)預計將從 2025 年的 12.75 吉瓦成長到 2026 年的 14.68 吉瓦,然後在 2031 年達到 40.02 吉瓦,2026 年至 2031 年的複合年成長率為 2.21%。
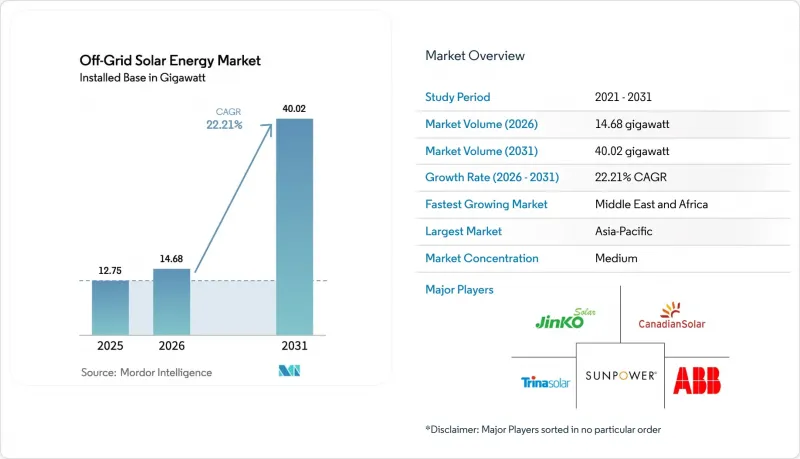
本報告按技術(光伏和聚光型太陽光電)、最終用戶(公用事業規模、商業和工業、住宅)以及地區(北美、歐洲、亞太、南美以及中東和非洲)進行細分。市場規模和預測均以裝置容量(GW)為基礎。
全球離網太陽能市場趨勢與洞察
太陽能模組價格更低、效率更高
2026年上半年,多晶矽供應過剩,使得中國離岸價(FOB)組件價格維持在每瓦0.12美元左右。然而,隨著9%出口增值稅政策的結束,成本趨於穩定,而白銀價格上漲又使太陽能電池原料成本增加了3-4%。串聯技術的創新在一定程度上抵消了這些不利因素。牛津光伏(Oxford PV)於2024年5月開始生產效率為27.3%的組件,並計劃在2029年實現7.5吉瓦的產能。同時,隆基(LONGi)於2024年4月實現了實驗室最高效率33.9%。效率超過26%的商用組件預計在2027年進入離網太陽能市場,將系統總成本降低高達20%。像隆基的「Hi-MO 9」這樣的雙面組件,在高反照率光伏電站中已經能夠額外提供5-30%的發電量,而由於碲化物供不應求,薄膜碲化鎘太陽能電池的全球產量低於10吉瓦,因此仍屬於小眾產品。然而,鈣鈦礦太陽能電池的耐久性和鉛含量等問題仍未解決,IEC 61215標準的修訂可能會導致認證延遲12-18個月。
農村電氣化目標不斷提高
光是在奈及利亞的DARES計畫中,「Mission 300」就已籌集了18.5億美元,整合了1,350個微電網,為1,750萬人供電。印度的PM-KUSUM計畫設定了30.8吉瓦的目標,但截至2024年中期,僅完成了2.8吉瓦。這是因為在信用評級較低的邦,專案部署停滯不前,農民必須自行承擔40-50%的成本。根據國際太陽能聯盟(ISA)的估計,3.96億未通電人口中有59%更適合透過微電網供電,而資金籌措是目前資金流入的49倍。印尼2500個未通電村莊生動地展現了「最後一公里」的風險。印尼國家電力公司 (PLN) 將每千瓦時電價上限設定為 0.15 美元,導致內部收益率 (IRR) 低於 8%,阻礙了未獲得政府支持的私人競標參與。
大型系統初始資本支出(CAPEX)較高
雖然混合通訊系統需要2萬至6萬美元的投資,但除非風險擔保能將利率降低300至400個基點,否則奈及利亞通訊塔的該地貨幣債務利率仍高於12%。在印度,PM-KUSUM計畫A部分要求農民共同投資40%至50%。信貸滲透率低於30%的州被迫依賴利率高達18%至24%的非正規貸款,這降低了專案的內部收益率(IRR)。由於貸款人要求25%的股本內部收益率,奈及利亞各地的微電網開發商到2025年初僅完成了其16億美元專案儲備中的15%的融資。
細分市場分析
到2025年,光伏發電將占到總裝置容量的100%,反映了離網太陽能市場整體規模的逐步擴大。聚光型太陽光電(CSP)的最小規模要求為10兆瓦,而熔鹽儲熱成本高達每千瓦時50至80美元,因此在離網太陽能市場蓬勃發展的50千瓦至5兆瓦範圍內,聚光光伏發電仍然無利可圖。鈣鈦礦矽疊層電池預計將在2027年滿足銀行融資要求,屆時可降低20%至30%的總安裝成本,並縮短整個微電網的投資回收期。雙面組件已將發電量提高了5%至30%,並在離網太陽能市場,尤其是在高反照率的薩赫勒地區,不斷擴大其市場佔有率。然而,與鉛相關的認證障礙可能會減緩鈣鈦礦技術的普及,並限制其短期成長。
磷酸鋰鐵(LFP)電池價格的持續下降,以及組件效率的提升,使得離網太陽能市場仍處於快速發展階段。由於碲化鎘薄膜太陽能電池的供應受限,預計晶體矽和串聯光伏系統仍將佔據出貨量的大部分。 Enphase公司於2024年推出的具有併網功能的併網邊緣微型逆變器,由於其單價超過每瓦0.25美元,且其連接要求會給農村電網帶來負擔,因此很可能仍將作為並聯型設備而非離網標準配置。
區域分析
到2025年,亞太地區將主導離網太陽能市場,佔59.87%的裝置容量佔有率。然而,印度的PM-KUSUM計畫截至2024年中期僅完成了其30.8吉瓦目標的9%,凸顯出儘管該計畫潛力巨大,但行政核准流程卻存在嚴重延誤。印尼2500個未通電村莊指出,如果沒有政府擔保,其內部收益率(IRR)將低於8%,從而限制私部門的擴張。菲律賓的目標是到2027年實現所有家庭100%通電,重點在每公里擴建成本超過1萬美元的地區建設微電網,但由於土地所有權糾紛,部署前的前置作業時間超過18個月。
預計中東和非洲地區的複合年成長率將達到26.3%,超過全球離網太陽能市場的平均水準。奈及利亞的DARES公司已籌集18.5億美元,用於部署1350個微電網,其中部分微電網已併網,以產生輔助服務收入。肯亞領先的按需付費(PAYGo)公司已獲得1.56億美元的資金,並計劃在2025年部署100萬套系統。同時,海灣地區的投資者,例如Amea Power,已為象牙海岸共和國一座50兆瓦的發電廠提供資金,該電廠計劃於2027年投入運作。外匯波動仍是主要阻力。由於奈及利亞奈拉在2024年可能貶值68%,d.light公司被迫透過發行多幣種債券進行對沖,導致發行價差增加了150-200個基點。
即使將北美、歐洲和南美合併,該地區的電網也已基本建成,因此離網太陽能發電僅佔市場總規模的不到15%。加拿大已投資3億加元用於替換292個偏遠原住民社區的柴油發電廠,但北極緯度將太陽能的運轉率降低至8-12%,減緩了其普及速度。巴西2023年對淨計量電價制度的修訂將使2024年分散式太陽能發電的成長減少40%。同時,阿根廷披索貶值導致RenovAr公司的專案停滯。歐洲有限的需求集中在島嶼和高海拔旅遊設施,這些地區可以利用柴油價格進行套利交易。
其他好處:
- Excel格式的市場預測(ME)表
- 3個月的分析師支持
目錄
第1章:引言
- 研究假設和市場定義
- 調查範圍
第2章:調查方法
第3章執行摘要
第4章 市場狀況
- 市場概覽
- 市場促進因素
- 太陽能模組價格更低、效率更高
- 提高農村電氣化目標
- 鋰離子電池的成本曲線正在下降。
- Pay-Go 與金融科技公司合作,實現了價格實惠。
- 透過與環境、社會及公司治理(ESG)相關的債務降低資本成本
- 電力公司對微電網競標商品搭售
- 市場限制因素
- 大型系統初始資本支出(CAPEX)較高
- 間歇性政策支持/補貼削減
- 早期採用者家庭的飽和度
- 隨意丟棄二手板材會削弱人們對板材品質的信心。
- 供應鏈分析
- 監管環境與政府政策
- 科技展望(下一代鈣鈦礦、人工智慧驅動的維運等)
- 波特五力模型
第5章 市場規模與成長預測
- 透過技術
- 太陽能發電(PV)
- 聚光型太陽熱能發電(CSP)
- 最終用戶
- 公用事業規模
- 商業和工業(C&I)
- 住宅
- 基於成分的(定性分析)
- 太陽能模組/面板
- 逆變器(組串式、集中式、微型)
- 安裝和追蹤系統
- 系統周邊設備和電氣設備
- 儲能和混合整合
- 按地區
- 北美洲
- 美國
- 加拿大
- 墨西哥
- 歐洲
- 英國
- 德國
- 法國
- 西班牙
- 北歐國家
- 俄羅斯
- 其他歐洲國家
- 亞太地區
- 中國
- 印度
- 日本
- 韓國
- 馬來西亞
- 泰國
- 印尼
- 越南
- 澳洲
- 其他亞太國家
- 南美洲
- 巴西
- 阿根廷
- 哥倫比亞
- 其他南美國家
- 中東和非洲
- 阿拉伯聯合大公國
- 沙烏地阿拉伯
- 南非
- 埃及
- 其他中東和非洲國家
- 北美洲
第6章 競爭情勢
- 市場集中度
- 策略趨勢(併購、聯盟、購電協議)
- 市場佔有率分析(主要公司的市場排名和佔有率)
- 公司簡介
- ABB Ltd.
- Schneider Electric SE
- Canadian Solar Inc.
- JinkoSolar Holding Co. Ltd.
- SunPower Corporation
- Trina Solar Ltd.
- LONGi Green Energy Technology Co. Ltd.
- JA Solar Technology Co. Ltd.
- Sharp Corporation
- Tesla Inc.
- First Solar Inc.
- Sunrun Inc.
- D.Light Design Inc.
- Bboxx Ltd.
- ENGIE Energy Access
- Zola Electric
- SMA Solar Technology AG
- Enphase Energy Inc.
- Fronius International GmbH
- Powerhive Inc.
- Greenlight Planet Inc.
第7章 市場機會與未來展望
According to Mordor Intelligence, the off-Grid solar energy market size in terms of installed base is expected to grow from 12.75 gigawatt in 2025 to 14.68 gigawatt in 2026 and is forecast to reach 40.02 gigawatt by 2031 at 22.21% CAGR over 2026-2031.
This report is Segmented by Technology (Solar Photovoltaic and Concentrated Solar Power), End-User (Utility-Scale, Commercial and Industrial, and Residential), and Geography (North America, Europe, Asia-Pacific, South America, and Middle East and Africa). The Market Sizes and Forecasts are Provided in Terms of Installed Capacity (GW).
Global Off-Grid Solar Energy Market Trends and Insights
Falling PV Module Prices & Efficiency Gains
Polysilicon oversupply held China FOB module prices near USD 0.12 per watt in 1H 2026, yet costs stabilized when the 9% export VAT rebate ended, and high silver prices added 3-4% to cell inputs PV. Tandem innovation partly offsets these headwinds: Oxford PV started 27.3% modules in May 2024 and targets 7.5 GW capacity by 2029, while LONGi's lab record reached 33.9% in April 2024. Commercial modules topping 26% efficiency could enter the off-grid solar energy market by 2027 and lower balance-of-system spending up to 20%. Bifacial designs such as LONGi's Hi-MO 9 already secure 5-30% extra yield on high-albedo sites, and thin-film cadmium-telluride remains niche because tellurium scarcity caps global output below 10 GW. Yet perovskite durability and lead content are unresolved, with possible IEC 61215 rule changes creating 12-18 months of certification lag.
Rising Rural Electrification Targets
Mission 300 mobilized USD 1.85 billion for Nigeria's DARES program alone, bundling 1,350 mini-grids to serve 17.5 million people. India's PM-KUSUM set a 30.8 GW target but reached only 2.8 GW by mid-2024 because 40-50% farmer co-payments stalled uptake in low-credit states. The International Solar Alliance calculates 59% of the 396 million unelectrified people are better served by mini-grids, yet the financing gap is forty-nine times current capital flows. Indonesia's 2,500 unelectrified villages illustrate last-mile risk: PLN's USD 0.15 per kWh tariff cap drags IRRs below 8%, deterring private bidders without sovereign backing.
High Upfront CAPEX for Large Systems
Telecom hybrid systems need USD 20,000-60,000, and Nigerian towers still face >12% local-currency debt unless risk guarantees cut rates by 300-400 bps. In India, PM-KUSUM Component A obliges 40-50% farmer co-funding; states with <30% credit penetration force reliance on informal 18-24% loans that erode project IRRs. Mini-grid developers across Nigeria secured financial close on only 15% of a USD 1.6 billion pipeline by early 2025 because lenders seek 25% equity IRRs.
Other drivers and restraints analyzed in the detailed report include:
- Declining Li-ion Battery Cost Curve
- Pay-Go Fintech Integration Boosts Affordability
- Intermittent Policy Support / Subsidy Cuts
For complete list of drivers and restraints, kindly check the Table Of Contents.
Segment Analysis
Solar PV accounted for 100% of capacity in 2025, mirroring the overall off-grid solar energy market size trajectory. Concentrated solar power's 10 MW minimum scale and molten-salt storage cost of USD 50-80 per kWh remain uneconomic for the 50 kW-5 MW band, where the off-grid solar energy market thrives. Over the forecast horizon, perovskite-silicon tandems entering bankability by 2027 could pare total installed cost 20-30%, compressing payback periods across mini-grids. Bifacial modules already raise yield 5-30% and expand the off-grid solar energy market share of bifacial shipments, especially in high-albedo Sahel zones. However, lead-related certification hurdles may delay perovskite adoption, tempering near-term upside.
Continuous LFP price declines align with module efficiency gains, keeping the off-grid solar energy market on its steep learning curve. With thin-film cadmium-telluride capped by tellurium supply, crystalline and tandem PV will continue to dominate volume. Edge-of-grid microinverters offering grid-forming capability, launched by Enphase in 2024, will likely remain a grid-connected feature rather than an off-grid standard because unit pricing exceeds USD 0.25 per watt and connectivity requirements strain rural networks.
Geography Analysis
Asia-Pacific dominated the off-grid solar energy market with 59.87% capacity in 2025. Yet India's PM-KUSUM realized only 9% of its 30.8 GW goal by mid-2024, indicating bureaucratic lag amid abundant potential. Indonesia's 2,500 unelectrified villages highlight IRR compression to <8% without sovereign guarantees, constraining private build-out. The Philippines targets 100% household electrification by 2027, focusing on mini-grids where extension costs exceed USD 10,000 per km, but land-title disputes extend lead times past 18 months.
The Middle East and Africa region is forecast to have a 26.3% CAGR, faster than the global off-grid solar energy market. Nigeria's DARES taps USD 1.85 billion to roll out 1,350 mini-grids, some grid-interactive for ancillary-service revenue. Kenyan PAYGo leaders secured USD 156 million in 2025 for 1 million systems, while Gulf investors such as Amea Power financed a 50 MW Ivory Coast plant coming online in 2027. Forex swings remain the key brake; a 68% naira drop in 2024 forced d.light to hedge via multi-currency notes, adding 150-200 bps to issuance spreads.
North America, Europe, and South America combined sit below 15% of the off-grid solar energy market size due to near-universal grid reach. Canada devoted CAD 300 million to replace diesel in 292 remote First Nations communities, but Arctic latitude cuts solar capacity factors to 8-12%, slowing uptake. Brazil's 2023 net-metering revision shrank distributed growth 40% in 2024, while Argentina's peso devaluation froze its RenovAr pipeline. Europe's limited demand centers on island or highland tourism assets where diesel prices supply the arbitrage.
- ABB Ltd.
- Schneider Electric SE
- Canadian Solar Inc.
- JinkoSolar Holding Co. Ltd.
- SunPower Corporation
- Trina Solar Ltd.
- LONGi Green Energy Technology Co. Ltd.
- JA Solar Technology Co. Ltd.
- Sharp Corporation
- Tesla Inc.
- First Solar Inc.
- Sunrun Inc.
- D.Light Design Inc.
- Bboxx Ltd.
- ENGIE Energy Access
- Zola Electric
- SMA Solar Technology AG
- Enphase Energy Inc.
- Fronius International GmbH
- Powerhive Inc.
- Greenlight Planet Inc.
Additional Benefits:
- The market estimate (ME) sheet in Excel format
- 3 months of analyst support
TABLE OF CONTENTS
1 Introduction
- 1.1 Study Assumptions & Market Definition
- 1.2 Scope of the Study
2 Research Methodology
3 Executive Summary
4 Market Landscape
- 4.1 Market Overview
- 4.2 Market Drivers
- 4.2.1 Falling PV module prices & efficiency gains
- 4.2.2 Rising rural electrification targets
- 4.2.3 Declining Li-ion battery cost curve
- 4.2.4 Pay-Go fintech integration boosts affordability
- 4.2.5 ESG-linked debt lowering cost of capital
- 4.2.6 Utility mini-grid tender bundling
- 4.3 Market Restraints
- 4.3.1 High upfront CAPEX for large systems
- 4.3.2 Intermittent policy support/subsidy cuts
- 4.3.3 Saturation of early adopter households
- 4.3.4 Used-panel dumping undermining quality trust
- 4.4 Supply-Chain Analysis
- 4.5 Regulatory Landscape & Government Policies
- 4.6 Technological Outlook (next-gen perovskite, AI-based O&M)
- 4.7 Porter's Five Forces
- 4.7.1 Bargaining Power of Suppliers
- 4.7.2 Bargaining Power of Consumers
- 4.7.3 Threat of New Entrants
- 4.7.4 Threat of Substitute Products & Services
- 4.7.5 Intensity of Competitive Rivalry
5 Market Size & Growth Forecasts
- 5.1 By Technology
- 5.1.1 Solar Photovoltaic (PV)
- 5.1.2 Concentrated Solar Power (CSP)
- 5.2 By End-User
- 5.2.1 Utility-Scale
- 5.2.2 Commercial and Industrial (C&I)
- 5.2.3 Residential
- 5.3 By Component (Qualitative Analysis)
- 5.3.1 Solar Modules/Panels
- 5.3.2 Inverters (String, Central, Micro)
- 5.3.3 Mounting and Tracking Systems
- 5.3.4 Balance-of-System and Electricals
- 5.3.5 Energy Storage and Hybrid Integration
- 5.4 By Geography
- 5.4.1 North America
- 5.4.1.1 United States
- 5.4.1.2 Canada
- 5.4.1.3 Mexico
- 5.4.2 Europe
- 5.4.2.1 United Kingdom
- 5.4.2.2 Germany
- 5.4.2.3 France
- 5.4.2.4 Spain
- 5.4.2.5 Nordic Countries
- 5.4.2.6 Russia
- 5.4.2.7 Rest of Europe
- 5.4.3 Asia-Pacific
- 5.4.3.1 China
- 5.4.3.2 India
- 5.4.3.3 Japan
- 5.4.3.4 South Korea
- 5.4.3.5 Malaysia
- 5.4.3.6 Thailand
- 5.4.3.7 Indonesia
- 5.4.3.8 Vietnam
- 5.4.3.9 Australia
- 5.4.3.10 Rest of Asia-Pacific
- 5.4.4 South America
- 5.4.4.1 Brazil
- 5.4.4.2 Argentina
- 5.4.4.3 Colombia
- 5.4.4.4 Rest of South America
- 5.4.5 Middle East and Africa
- 5.4.5.1 United Arab Emirates
- 5.4.5.2 Saudi Arabia
- 5.4.5.3 South Africa
- 5.4.5.4 Egypt
- 5.4.5.5 Rest of Middle East and Africa
- 5.4.1 North America
6 Competitive Landscape
- 6.1 Market Concentration
- 6.2 Strategic Moves (M&A, Partnerships, PPAs)
- 6.3 Market Share Analysis (Market Rank/Share for key companies)
- 6.4 Company Profiles (includes Global level Overview, Market level overview, Core Segments, Financials as available, Strategic Information, Products & Services, and Recent Developments)
- 6.4.1 ABB Ltd.
- 6.4.2 Schneider Electric SE
- 6.4.3 Canadian Solar Inc.
- 6.4.4 JinkoSolar Holding Co. Ltd.
- 6.4.5 SunPower Corporation
- 6.4.6 Trina Solar Ltd.
- 6.4.7 LONGi Green Energy Technology Co. Ltd.
- 6.4.8 JA Solar Technology Co. Ltd.
- 6.4.9 Sharp Corporation
- 6.4.10 Tesla Inc.
- 6.4.11 First Solar Inc.
- 6.4.12 Sunrun Inc.
- 6.4.13 D.Light Design Inc.
- 6.4.14 Bboxx Ltd.
- 6.4.15 ENGIE Energy Access
- 6.4.16 Zola Electric
- 6.4.17 SMA Solar Technology AG
- 6.4.18 Enphase Energy Inc.
- 6.4.19 Fronius International GmbH
- 6.4.20 Powerhive Inc.
- 6.4.21 Greenlight Planet Inc.
7 Market Opportunities & Future Outlook
- 7.1 White-space & Unmet-Need Assessment


