


 |
市場調查報告書
商品編碼
2066527
安全資訊和事件管理 (SIEM):市場佔有率分析、行業趨勢和統計數據、成長預測 (2026-2031)Security Information And Event Management (SIEM) - Market Share Analysis, Industry Trends & Statistics, Growth Forecasts (2026 - 2031) |
||||||
※ 本網頁內容可能與最新版本有所差異。詳細情況請與我們聯繫。
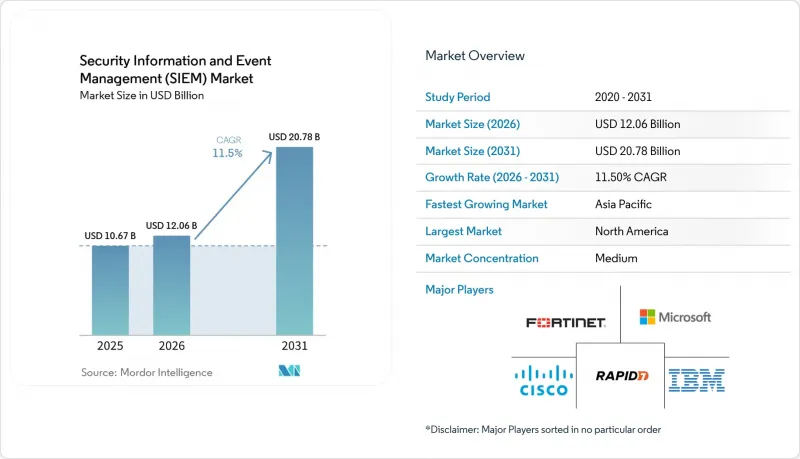
據 Mordor Intelligence 稱,2025 年安全資訊和事件管理 (SIEM) 市場價值為 106.7 億美元,預計到 2031 年將達到 207.8 億美元,而 2026 年為 120.6 億美元,預測期(2026-2031 年)的複合年成長率為 1.5%。
本報告按部署類型(本地部署、雲端部署、混合部署)、架構(傳統架構、雲端原生架構、開放原始碼)、元件(平台、服務等)、組織規模(中小企業、大型企業)、最終用戶(銀行、金融服務和保險、零售等)、應用程式(威脅偵測、合規性等)和地區進行細分。市場預測以美元計價。
全球安全資訊與事件管理 (SIEM) 市場趨勢與洞察
安全遙測資料量呈指數級成長
擁有超過 10,000 名員工的組織目前每天要處理超過 10 Terabyte的日誌數據,這些數據來自終端、多重雲端服務、SaaS 工具和營運技術 (OT) 網路。微軟報告稱,Sentinel 在 2025 年處理的事件數量將同比成長 150%,這凸顯了每個日誌都需要建立索引,從而給儲存預算帶來的巨大壓力。分層儲存、熱/溫/冷資料儲存以及流式分析管道正逐漸成為降低成本的標準設計方法。遠端辦公進一步加劇了資料過載,預計 2024 年至 2025 年間 VPN 身分驗證將成長五倍,這迫使對先前針對固定邊界最佳化的偵測邏輯進行重構。能夠有效壓縮、標準化和過濾這些大量資料的供應商正在獲得競爭優勢,從而加速安全資訊和事件管理 (SIEM) 市場的成長。
由於監管措施,處罰加大,審計頻率也更高。
歐洲的NIS2指令於2024年10月生效,該指令規定,如果事件日誌記錄不完整,企業將被處以最高相當於全球營業額2%的罰款。此外,《數位營運彈性法案》強制要求歐洲金融機構從2025年1月起,每季進行基於SIEM的劇本測試。在美國,美國證券交易委員會(SEC)於2023年底生效的規則要求上市公司在四個工作天內揭露重大網路安全事件。這些法規結構的趨同正在推動高監管行業及相關行業採用防篡改且搜尋的事件儲存系統以及即時關聯分析技術。
總擁有成本 (TCO) 高且授權複雜
在「基於流量的授權」模式下,隨著雲端、物聯網或SaaS服務的運作,成本飆升,令投資者措手不及。有些公司在2024年累計每天使用500GB的數據,但到2025年,實際使用量已超過2TB,年度支出翻了四倍。多年資料保存會產生Petabyte級的儲存成本,而規則調整的專業服務費用又佔總支出的四分之一。供應商正透過分離儲存和運算來應對這一問題,允許客戶將原始資料存儲在低成本的物件儲存庫中,僅在執行查詢或發現操作時才付費。然而,這種轉變需要掌握新的模式設計和專案查詢技能。
細分市場分析
預計到2031年,雲端運算採用率將以12.84%的複合年成長率成長,超過安全資訊和事件管理(SIEM)市場11.50%的整體成長率。付費使用制的柔軟性定價模式以及無需硬體更新周期的優勢對財務部門極具吸引力,而直接的API整合則能夠從無伺服器函數、容器編排器和SaaS租戶中獲取傳統代理無法測量的遙測資料。即使到了2025年,在現有投資和空氣間隙防禦網路的支持下,本地部署系統仍將佔據55.27%的市場。混合模式允許受監管的銀行和醫療保健機構在國內保留敏感日誌的同時,利用雲端運算日益強大的運算能力進行進階分析。
隨著企業逐漸意識到修補、擴展和調優叢集所需的人力成本,雲端的成本效益優勢愈發凸顯。公共雲端供應商接手基礎架構管理任務,使企業內部團隊能夠專注於威脅偵測而非磁碟配置。資料本地化法規使得統一策略難以實施,因此需要採用聯邦式架構,將區域實例關聯警報轉送至全域視圖。這種架構的柔軟性正在傳輸中型企業採用雲端技術,並鞏固安全資訊和事件管理 (SIEM) 市場。
預計到 2031 年,雲端原生和下一代技術堆疊將以每年 11.95% 的速度成長,這將對關聯資料庫平台在 2025 年佔據的 48.12% 的市場佔有率構成挑戰。儲存和運算的分離使得團隊能夠將原始日誌儲存在低成本的物件儲存中,並僅在需要時查詢。根據供應商對 2025 年的基準測試,這可以將基礎設施成本降低高達 60%。 Wazuh 和 Graylog 等開放原始碼替代方案對預算有限且需要程式碼透明性的機構來說極具吸引力,但它們需要建立連接器並進行全天候維護。
由於企業在客製化關聯規則和分析師培訓方面投入數百萬美元,切換成本阻礙了轉型進程。儘管如此,思科在2024年3月以280億美元收購Splunk的交易動搖了現有客戶的信心,並促使他們開始與新供應商進行試驗計畫。雲端原生供應商正透過快速部署、人工智慧驅動的故障排查和付費使用制來脫穎而出。傳統供應商則透過託管部署服務和資料庫平台遷移來反擊,但基於彈性擴展的架構發展勢頭強勁,這正在擴大現代安全資訊和事件管理(SIEM)解決方案的市場規模。
區域分析
預計到2025年,北美將佔全球收入的41.39%,這主要得益於美國證券交易委員會(SEC)的資訊揭露要求,該要求強制實現近乎即時的檢測和四天內報告違規行為。上市公司正優先遷移到雲端原生服務,這些服務能夠大規模地與SaaS和基礎設施日誌整合,從而加速淘汰本地部署環境。創投對網路安全新創企業的投資以及政府在保護關鍵基礎設施方面的支出,進一步鞏固了該地區的領先地位。
在歐洲,由於 GDPR、NIS2 和 DORA 的疊加影響,預計需求將大幅成長。到 2024 年底,將有超過 16 萬家營業單位受到 NIS2 的約束,這將迫使中型企業在預算有限的情況下實施集中式日誌管理。金融機構正在實現季度彈性測試的自動化,而製造出口商則利用 SIEM 分析向競爭激烈的安全資訊和事件管理 (SIEM) 市場中的客戶展示其供應鏈安全性。
亞太地區正以12.72%的複合年成長率引領成長,其中印度、印尼和越南正在推進支付數位化和數據在地化。中國的監管政策促使日誌在國內存儲,並建立了連接到監管儀表板的區域安全資訊和事件管理(SIEM)節點。新加坡正努力成為網路安全中心,而澳洲在發生一起備受矚目的資料外洩事件後,正在加強對關鍵基礎設施的法律保護。南美和中東地區正穩步投資智慧城市和電子政府項目,以擴展遙測技術的應用,但同時也面臨貨幣波動和技能短缺等挑戰。非洲擁有新興市場的潛力,以南非、奈及利亞和埃及為中心,這些國家的電信和銀行業正在推動相關技術的早期應用。
其他好處:
- Excel格式的市場預測(ME)表
- 3個月的分析師支持
目錄
第1章:引言
- 研究假設和市場定義
- 調查範圍
第2章:調查方法
第3章執行摘要
第4章 市場狀況
- 市場概覽
- 市場促進因素
- 安全遙測資料量呈指數級成長
- 增加對違反監管規定的處罰力度,並增加審計頻率。
- 加速企業工作負載採用雲端和混合式環境
- 基於人工智慧/機器學習的分析可以提高訊號雜訊比。
- 引入安全資料管道層可以降低 SIEM 的整體擁有成本 (TCO)。
- 供應商簽訂的大額合約會加快續約週期。
- 市場限制因素
- 總擁有成本高,授權複雜
- 熟練的SOC分析師短缺
- 集中式日誌聚合中資料主權的障礙
- 由於與 XDR/SOAR 平台存在衝突,預算核准被推遲。
- 產業價值鏈分析
- 技術展望
- 監理情勢
- 波特五力分析
- 價格分析
- 宏觀經濟因素對市場的影響
第5章 市場規模與成長預測
- 不同的發展
- 現場
- 雲
- 混合
- 透過 SIEM 架構
- 傳統/傳統安全資訊和事件管理 (SIEM)
- 雲端原生/下一代安全資訊和事件管理 (SIEM)
- 開放原始碼管理 (SIEM)
- 按組件
- 平台/軟體
- 專業服務
- 託管安全資訊和事件管理服務 (MSSP)
- 按組織規模
- 小型企業
- 大公司
- 按最終用戶行業分類
- 銀行業、金融服務業及保險業
- 零售與電子商務
- 政府/國防
- 醫療保健和生命科學
- 製造業
- 能源公用事業
- 通訊/IT
- 其他終端用戶產業
- 透過使用
- 威脅偵測與分析
- 合規與審計管理
- 事件回應和取證
- 日誌管理和報告生成
- 雲端工作負載的安全監控
- 物聯網/OT安全監控
- 按地區
- 北美洲
- 美國
- 加拿大
- 墨西哥
- 歐洲
- 英國
- 德國
- 法國
- 義大利
- 西班牙
- 北歐的
- 其他歐洲國家
- 亞太地區
- 中國
- 印度
- 日本
- 澳洲
- 其他亞太國家
- 南美洲
- 巴西
- 阿根廷
- 其他南美國家
- 中東
- 沙烏地阿拉伯
- 阿拉伯聯合大公國
- 土耳其
- 其他中東國家
- 非洲
- 南非
- 埃及
- 奈及利亞
- 其他非洲國家
- 北美洲
第6章 競爭情勢
- 市場集中度
- 策略趨勢
- 市佔率分析
- 公司簡介
- Cisco Systems, Inc.
- International Business Machines Corporation
- Microsoft Corporation
- Google LLC
- Fortinet, Inc.
- LogRhythm, Inc.
- Exabeam, Inc.
- Rapid7, Inc.
- Open Text Corporation
- RSA Security LLC
- Securonix, Inc.
- CrowdStrike, Inc.
- Elastic NV
- AT&T Inc.
- SolarWinds Worldwide, LLC
- Graylog, Inc.
- Logpoint A/S
- Zoho Corporation Pvt. Ltd.
- Hewlett Packard Enterprise Company
第7章 市場機會與未來展望
According to Mordor Intelligence, the security information and event management market size was valued at USD 10.67 billion in 2025 and is estimated to grow from USD 12.06 billion in 2026 to reach USD 20.78 billion by 2031, at a CAGR of 11.5% during the forecast period (2026-2031).
This report is Segmented by Deployment (On-Premise, Cloud, and Hybrid), Architecture (Legacy, Cloud-Native, and Open-Source), Component (Platform, Services, and More), Organization Size (SME, and Large Enterprises), End-User (BFSI, Retail, and More), Application (Threat Detection, Compliance, and More), and Geography. The Market Forecasts are Provided in Terms of Value (USD).
Global Security Information And Event Management (SIEM) Market Trends and Insights
Exponential Growth of Security Telemetry Volumes
Organizations with more than 10,000 employees now ingest over 10 terabytes of log data each day, spanning endpoints, multi-cloud services, SaaS tools, and operational-technology networks. Microsoft reported that events processed by Sentinel surged 150% year-over-year during 2025, underscoring the strain on storage budgets when every log line is indexed. Tiered retention, hot-warm-cold storage, and streaming analytics pipelines are emerging as default design choices to keep costs in check. Remote work further amplifies the data flood, VPN authentications quintupled between 2024 and 2025, reshaping detection logic calibrated for fixed perimeters. Vendors that efficiently compress, normalize, and triage this torrent gain an edge, accelerating the security information and event management (SIEM) market.
Escalating Regulatory Penalties and Audit Frequency
Europe's NIS2 directive became enforceable in October 2024 and allows fines of up to 2% of global revenue for inadequate incident logging. The Digital Operational Resilience Act obliges European financial entities to test SIEM-driven playbooks every quarter starting January 2025. In the United States, SEC rules that took effect in late 2023 require public companies to disclose material cybersecurity incidents within four business days. These converging frameworks demand immutable, searchable event stores and real-time correlation, propelling procurement among both heavily regulated and adjacent sectors.
High Total Cost of Ownership and Licensing Complexity
Pay-by-ingest licensing means costs spike when cloud, IoT, or SaaS sources are activated, blindsiding finance teams. Enterprises that budgeted for 500 GB per day in 2024 saw usage balloon past 2 TB by 2025, quadrupling annual spend. Multi-year retention adds petabyte storage bills, and professional services for rule-tuning consume another quarter of total outlay. Vendors are countering with decoupled storage and compute, letting customers push raw data into cheap object repositories and pay only when queries or detections run, but that shift demands new skills in schema design and ad-hoc querying.
Other drivers and restraints analyzed in the detailed report include:
- Accelerated Cloud and Hybrid Adoption of Enterprise Workloads
- AI/ML-Infused Analytics Improve Signal-to-Noise Ratios
- Shortage of Skilled SOC Analysts
For complete list of drivers and restraints, kindly check the Table Of Contents.
Segment Analysis
Cloud deployments are expanding at a 12.84% CAGR through 2031, eclipsing the 11.50% trajectory of the overall Security Information and Event Management market. The elasticity of pay-per-use pricing and the elimination of hardware refresh cycles appeal to finance teams, while direct API integrations pull telemetry from serverless functions, container orchestrators, and SaaS tenants that legacy agents cannot instrument. On-premises systems still held 55.27% share in 2025, anchored by sunk investments and air-gapped defense networks. Hybrid models let regulated banks and healthcare providers keep sensitive logs in-country yet harness cloud compute bursts for advanced analytics.
The operating-expense advantage of cloud grows when enterprises recognize the staff hours required to patch, scale, and tune on-premises clusters. Public-cloud providers absorb infrastructure chores, letting internal teams focus on threat-hunting rather than disk provisioning. Data-localization laws complicate one-size-fits-all strategies, prompting federated designs where regional instances forward correlated alerts to a global view. This architectural flexibility is widening adoption among mid-size organizations, reinforcing the security information and event management (SIEM) market.
Cloud-native and next-generation stacks are projected to grow at 11.95% through 2031, challenging the 48.12% foothold that legacy relational-database platforms enjoyed in 2025. Decoupled storage-compute designs let teams park raw logs in cheap object stores and spin up queries only during investigations, slicing infrastructure spend by as much as 60% according to 2025 vendor benchmarks. Open-source alternatives like Wazuh and Graylog appeal to budget-constrained agencies that need code transparency, but they require DIY connectors and round-the-clock maintenance.
Switching costs slow migration because enterprises have millions invested in custom correlation rules and analyst training. Nonetheless, Cisco's USD 28 billion purchase of Splunk in March 2024 rattled installed-base confidence and triggered pilot programs with newer vendors. Cloud-native providers differentiate on rapid onboarding, AI-assisted triage, and consumption pricing. Legacy vendors are countering through managed deployment offerings and database re-platforming, but the momentum favours architectures built for elastic scale, lifting the security information and event management (SIEM) market size for modern solutions.
Geography Analysis
North America generated 41.39% of 2025 revenue, propelled by SEC disclosure mandates that force near-real-time detection and four-day breach reporting. Public corporations accelerated decommissioning of on-premises stacks in favour of cloud-native services that integrate with SaaS and infrastructure logs at massive scale. Venture investment in cybersecurity startups and government spending on critical-infrastructure protection also reinforce the region's primacy.
Europe commands sizable demand thanks to the overlapping weight of GDPR, NIS2, and DORA. More than 160,000 additional entities fell under NIS2 by late 2024, compelling mid-tier operators to adopt centralized log management despite budget constraints. Financial houses are automating quarterly resilience tests, and manufacturing exporters rely on SIEM analytics to certify supply-chain security for customers in strict security information and event management (SIEM) markets.
Asia Pacific leads growth at 12.72% CAGR as India, Indonesia, and Vietnam digitize payments and enforce data-localization. Chinese mandates keep logs onshore, prompting regional SIEM nodes that federate to a supervisory dashboard. Singapore is positioning as a cybersecurity hub, while Australia tightens critical-infrastructure laws after high-profile breaches. South America and the Middle East invest steadily in smart-city and e-government programs that expand telemetry but face currency volatility and skills gaps. Africa remains an emerging opportunity centered on South Africa, Nigeria, and Egypt, where telecom and banking sectors shoulder early adoption.
- Cisco Systems, Inc.
- International Business Machines Corporation
- Microsoft Corporation
- Google LLC
- Fortinet, Inc.
- LogRhythm, Inc.
- Exabeam, Inc.
- Rapid7, Inc.
- Open Text Corporation
- RSA Security LLC
- Securonix, Inc.
- CrowdStrike, Inc.
- Elastic N.V.
- AT&T Inc.
- SolarWinds Worldwide, LLC
- Graylog, Inc.
- Logpoint A/S
- Zoho Corporation Pvt. Ltd.
- Hewlett Packard Enterprise Company
Additional Benefits:
- The market estimate (ME) sheet in Excel format
- 3 months of analyst support
TABLE OF CONTENTS
1 INTRODUCTION
- 1.1 Study Assumptions and Market Definition
- 1.2 Scope of the Study
2 RESEARCH METHODOLOGY
3 EXECUTIVE SUMMARY
4 MARKET LANDSCAPE
- 4.1 Market Overview
- 4.2 Market Drivers
- 4.2.1 Exponential Growth of Security Telemetry Volumes
- 4.2.2 Escalating Regulatory Penalties and Audit Frequency
- 4.2.3 Accelerated Cloud and Hybrid Adoption of Enterprise Workloads
- 4.2.4 AI/ML-Infused Analytics Improve Signal-to-Noise Ratios
- 4.2.5 Emergence of Security-Data-Pipeline Layer Reduces SIEM TCO
- 4.2.6 Vendor Mega-Deals Trigger Refresh Cycles
- 4.3 Market Restraints
- 4.3.1 High Total Cost of Ownership and Licensing Complexity
- 4.3.2 Shortage of Skilled SOC Analysts
- 4.3.3 Data-Sovereignty Barriers to Central Log Aggregation
- 4.3.4 Overlap with XDR/SOAR Platforms Delays Budget Approval
- 4.4 Industry Value Chain Analysis
- 4.5 Technological Outlook
- 4.6 Regulatory Landscape
- 4.7 Porter's Five Forces Analysis
- 4.7.1 Bargaining Power of Suppliers
- 4.7.2 Bargaining Power of Buyers
- 4.7.3 Threat of New Entrants
- 4.7.4 Threat of Substitutes
- 4.7.5 Competitive Rivalry
- 4.8 Pricing Analysis
- 4.9 Impact of Macroeconomic Factors on the Market
5 MARKET SIZE AND GROWTH FORECASTS (VALUE)
- 5.1 By Deployment
- 5.1.1 On-Premise
- 5.1.2 Cloud
- 5.1.3 Hybrid
- 5.2 By SIEM Architecture
- 5.2.1 Legacy / Traditional SIEM
- 5.2.2 Cloud-Native / Next-Gen SIEM
- 5.2.3 Open-Source SIEM
- 5.3 By Component
- 5.3.1 Platform / Software
- 5.3.2 Professional Services
- 5.3.3 Managed SIEM Services (MSSP)
- 5.4 By Organization Size
- 5.4.1 Small and Medium Enterprises
- 5.4.2 Large Enterprises
- 5.5 By End-User Industry
- 5.5.1 Banking, Financial Services and Insurance
- 5.5.2 Retail and E-Commerce
- 5.5.3 Government and Defense
- 5.5.4 Healthcare and Life Sciences
- 5.5.5 Manufacturing
- 5.5.6 Energy and Utilities
- 5.5.7 Telecom and IT
- 5.5.8 Other End-User Industries
- 5.6 By Application
- 5.6.1 Threat Detection and Analytics
- 5.6.2 Compliance and Audit Management
- 5.6.3 Incident Response and Forensics
- 5.6.4 Log Management and Reporting
- 5.6.5 Cloud-Workload Security Monitoring
- 5.6.6 IoT / OT Security Monitoring
- 5.7 By Geography
- 5.7.1 North America
- 5.7.1.1 United States
- 5.7.1.2 Canada
- 5.7.1.3 Mexico
- 5.7.2 Europe
- 5.7.2.1 United Kingdom
- 5.7.2.2 Germany
- 5.7.2.3 France
- 5.7.2.4 Italy
- 5.7.2.5 Spain
- 5.7.2.6 Nordics
- 5.7.2.7 Rest of Europe
- 5.7.3 Asia Pacific
- 5.7.3.1 China
- 5.7.3.2 India
- 5.7.3.3 Japan
- 5.7.3.4 Australia
- 5.7.3.5 Rest of Asia Pacific
- 5.7.4 South America
- 5.7.4.1 Brazil
- 5.7.4.2 Argentina
- 5.7.4.3 Rest of South America
- 5.7.5 Middle East
- 5.7.5.1 Saudi Arabia
- 5.7.5.2 United Arab Emirates
- 5.7.5.3 Turkey
- 5.7.5.4 Rest of Middle East
- 5.7.6 Africa
- 5.7.6.1 South Africa
- 5.7.6.2 Egypt
- 5.7.6.3 Nigeria
- 5.7.6.4 Rest of Africa
- 5.7.1 North America
6 COMPETITIVE LANDSCAPE
- 6.1 Market Concentration
- 6.2 Strategic Moves
- 6.3 Market Share Analysis
- 6.4 Company Profiles (includes Global Level Overview, Market Level Overview, Core Segments, Financials as Available, Strategic Information, Market Rank/Share for Key Companies, Products and Services, and Recent Developments)
- 6.4.1 Cisco Systems, Inc.
- 6.4.2 International Business Machines Corporation
- 6.4.3 Microsoft Corporation
- 6.4.4 Google LLC
- 6.4.5 Fortinet, Inc.
- 6.4.6 LogRhythm, Inc.
- 6.4.7 Exabeam, Inc.
- 6.4.8 Rapid7, Inc.
- 6.4.9 Open Text Corporation
- 6.4.10 RSA Security LLC
- 6.4.11 Securonix, Inc.
- 6.4.12 CrowdStrike, Inc.
- 6.4.13 Elastic N.V.
- 6.4.14 AT&T Inc.
- 6.4.15 SolarWinds Worldwide, LLC
- 6.4.16 Graylog, Inc.
- 6.4.17 Logpoint A/S
- 6.4.18 Zoho Corporation Pvt. Ltd.
- 6.4.19 Hewlett Packard Enterprise Company
7 MARKET OPPORTUNITIES AND FUTURE OUTLOOK
- 7.1 White-Space and Unmet-Need Assessment
 現代安全資訊和事件管理全球市場規模、佔有率、趨勢和成長分析報告(2026-2034年)
 全球安全資訊與事件管理 (SIEM) 市場(至 2031 年):按類型(高級 SIEM、下一代 SIEM)和應用(威脅偵測、調查和回應 (TDIR)、安全監控和視覺化、合規性、安全分析)分類
 安全資訊和事件管理 (SIEM) 市場規模、佔有率、趨勢和預測:按組件、部署類型、組織規模、應用、行業和地區分類,2026-2034 年
 安全資訊與事件管理市場:按交付方式、日誌類型、部署方式、組織規模和產業分類-2026年至2032年全球市場預測
 2026年全球安全資訊與事件管理市場報告2026年全球託管安全資訊與事件管理 (SIEM) 及日誌管理市場報告全球現代 SIEM 市場,2024–2029Frost Radar ™:現代安全資訊與事件管理,2026
 安全資訊與事件管理市場 - 全球產業規模、佔有率、趨勢、機會、預測:按解決方案、部署方式、產業垂直領域、地區和競爭對手分類,2021-2031 年安全資訊和事件管理軟體市場-全球產業規模、佔有率、趨勢、機會和預測(按組件、應用、組織規模、部署模式、垂直產業、地區和競爭格局分類,2020-2030 年預測)