


 |
市場調查報告書
商品編碼
2066494
天然橡膠:市場佔有率分析、產業趨勢與統計、成長預測(2026-2031)Natural Rubber - Market Share Analysis, Industry Trends & Statistics, Growth Forecasts (2026 - 2031) |
||||||
※ 本網頁內容可能與最新版本有所差異。詳細情況請與我們聯繫。
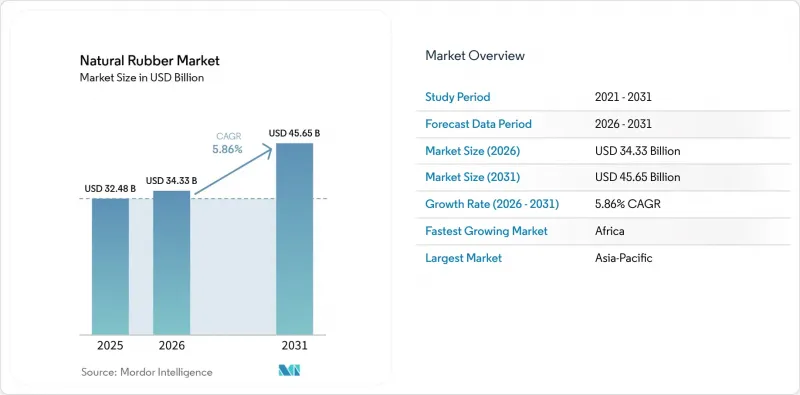
根據 Mordor Intelligence 預測,天然橡膠市場規模將從 2025 年的 324.8 億美元和 2026 年的 343.3 億美元成長到 2031 年的 456.5 億美元,2026 年至 2031 年的複合年成長率為 5.86%。
本報告按地區(北美、亞太及其他)分類,內容包括生產分析(數量)、消費分析(價值和數量)、進口分析(價值和數量)、出口分析(價值和數量)、批發價格趨勢分析和預測,以及主要公司列表。市場預測以價值(美元)和數量(公噸)兩種單位呈現。
全球天然橡膠市場趨勢與洞察
電動車導致的輪胎磨損和更換需求
電動車 (EV) 對輪胎性能的要求越來越高,因為電池組的重量增加以及瞬時扭力特性對胎面壽命和耐磨性提出了更高的要求。這直接影響了天然橡膠市場,因為輪胎製造商需要能夠承受快速磨損,同時在更重的車輛上保持抓地力、熱控制和耐久性的橡膠配方。此外,這種需求變化並非暫時的,而是持續的,因為更短的更換週期即使在新車銷售不穩定的情況下也會促使消費者重複購買輪胎。根據天然橡膠生產國協會的數據,2026 年的需求復甦部分得益於中國政府對電動車購買的持續獎勵,中國仍然是全球貿易中最具影響力的需求中心。這意味著天然橡膠市場與亞洲電動車的普及率以及大規模的輪胎更換市場密切相關。這也意味著,隨著汽車製造商和輪胎製造商不斷改進其產品以適應更重的車輛,市場對更高品質橡膠的需求可能會比低規格橡膠更強勁。
中國建築和採礦需求復甦
中國仍然是全球橡膠貿易中波動性最大的買家,其工業活動的變化會迅速影響區域採購、運輸和庫存水準。根據國際貿易中心(ITC)的貿易地圖(TradeMap)數據,預計中國天然橡膠進口量將從2024年的239萬噸增加到2025年的317萬噸,年增32.3%。這凸顯了隨著採購條件和下游需求的改善,進口流量會迅速成長。中國農業農村部指出,汽車和卡車需求以及出口訂單的部分復甦可能會對進口起到支撐作用。這一點至關重要,因為卡車、越野車和工業設備都透過輪胎需求來推動橡膠消費。在天然橡膠市場,即使中國建築、物流和採礦活動逐步復甦,也可能導致近期供應趨緊,因為國內產量無法滿足國內需求。泰國、越南和印尼的供應商將受到最顯著的影響。這是因為中國的採購趨勢往往會重新定義整個亞洲的價格預測。因此,即使其他地區的需求喜憂參半,天然橡膠市場仍然對中國的進口趨勢高度敏感。
葉斑病、白根腐病和氣候相關因素導致產量下降。
即使在世界最大的橡膠生產國,病害壓力也正在降低有效產能。根據天然橡膠生產國協會(ANRPC)預測,世界最大的橡膠生產國泰國預計2026年產量將保持平穩,而第二大生產國印尼預計將延續自2022年以來因價格低迷、葉部病害以及土地轉為油棕櫚種植而開始的產量下滑趨勢。中國農業農村部也報告稱,2025年5月海南省出現中度至重度白粉病和間歇性落葉,阻礙了乳膠採集季節的進行。歐洲森林研究所進一步指出,土地資源限制、氣候變遷、人事費用、天災和落葉病害等因素導致泰國2017年至2022年間橡膠種植面積減少了4.5%。天然橡膠市場面臨的問題不僅限於收成不佳導致的產量下降。受病害影響而衰弱的樹木更容易受到暴雨、洪水和季節性脅迫的影響,導致恢復速度減慢,且多個生產週期內的產量不穩定。因此,儘管名義產量比去年同期略有成長,但供應的脆弱性仍然反映在天然橡膠市場的價格中。
區域分析
預計到2025年,亞太地區將佔天然橡膠市場67.8%的佔有率,成為全球最大的區域市場。亞太地區天然橡膠市場擁有廣闊的人工林面積、高密度的加工能力、主要的輪胎製造地以及世界上最發達的出口路線之一。然而,病蟲害和氣候變遷的壓力正在降低幾個主要橡膠生產國的有效產能。根據天然橡膠生產國協會(ANRPC)預測,全球最大的橡膠生產國泰國的產量預計在2026年將保持平穩,而第二大生產國印尼的產量預計將延續自2022年以來因價格低迷、葉部病害以及土地轉為油棕櫚種植而開始的下滑趨勢。中國天然橡膠進口量預計將從2024年的239萬噸增加至2025年的317萬噸,年增32.3%。這凸顯了該國持續依賴進口來滿足國內消費需求。印度仍然是天然橡膠市場的主要推動要素。天然橡膠生產國協會(ANRPC)預測,2026年的需求量將比2025年增加3.6%,而汽車輪胎製造商協會(ATMA)報告稱,年需求量將達到140萬噸,而國內產量僅85萬噸。
非洲是天然橡膠市場成長最快的地區,預計從2026年到2031年將以8.4%的複合年成長率成長。隨著新的人工林擴大將原料出口與本地加工能力相結合,非洲天然橡膠市場正在加速發展。象牙海岸共和國鞏固了其作為非洲最大橡膠生產國和世界第三大橡膠生產國的地位,其天然橡膠產量從2019年的約82萬噸增加到2023年的155萬噸。為滿足不斷成長的產量需求,該國也在擴大下游加工能力。位於大貝萊維(Grand-Bélévy)的一座年處理能力為10萬噸的新工廠將於2024年10月投產,另有兩座工廠預計將於2025年投入運作。這些發展預計將使該公司在象牙海岸共和國的總加工能力達到每年約48萬噸。
北美、歐洲、南美和中東雖然在天然橡膠市場中所佔佔有率較小,但由於其中許多地區嚴重依賴進口,因此它們對貿易流向的影響仍然不容忽視。天然橡膠生產國協會(ANRPC)指出,美國輪胎出貨量的強勁前景是支撐2026年需求的因素之一,而北美儘管缺乏大規模的人工林園,仍然是一個重要的市場。在南美,巴西的天然橡膠市場情況依然複雜,因為國內產量無法滿足消費需求。巴西聯邦政府已批准撥款420萬美元(2,220萬巴西幣),用於支持2025/2026年度的天然橡膠種植。歐洲是天然橡膠市場的關鍵地區,因為合規採購和檢驗驗證等因素會影響供應商的選擇,而不僅僅是價格競爭。對於那些有嚴格實質審查要求的進口商而言,這種趨勢尤其明顯。中東地區對天然橡膠的需求相對穩定,其採購更多是與基礎設施和物流、輪胎使用以及來自亞洲的進口趨勢相關,而不是與當地原料生產相關。
- Excel格式的市場預測(ME)表
- 3個月的分析師支持
目錄
第1章:引言
- 研究假設和市場定義
- 調查範圍
第2章:調查方法
第3章執行摘要
第4章 市場狀況
- 市場概覽
- 市場促進因素
- 電動車導致的輪胎磨損和更換需求
- 中國建築和採礦需求復甦
- 補充醫用手套庫存,使乳膠需求正常化。
- 與原油價格相關的合成橡膠成本不斷上漲,推動了人們轉向替代材料。
- 為符合歐盟森林砍伐法規的可追溯橡膠創造溢價。
- 人工智慧驅動的樹液採集、農場監控和產量最佳化。
- 市場限制因素
- 葉斑病、白根腐病和氣候相關因素導致產量下降。
- 特百惠產業勞動力老化與長期人手不足
- 森林砍伐的合規成本與土地利用限制
- 貿易壁壘、輪胎出口中斷、買方庫存減少。
- 機會
- 任務
- 價值鏈分析
- 人工智慧技術及其在產業的應用
- 原物料市場分析
- 種子
- 肥料
- 殺蟲劑
- 分銷通路分析
- 市場情緒分析
- PESTLE分析
第5章 市場規模與成長預測
- 按地區
- 北美洲
- 美國
- 生產分析(種植面積、產量、產量)
- 消費分析(消費量和消費體積)
- 進口分析(進口額、進口量、主要供應市場)
- 出口分析(出口額、出口量、主要出口目的地市場)
- 批發價格趨勢分析與預測。
- 法律規範
- 主要公司列表
- 物流和基礎設施
- 季節性分析
- 加拿大
- 生產分析(種植面積、產量、產量)
- 消費分析(消費量和消費體積)
- 進口分析(進口額、進口量、主要供應市場)
- 出口分析(出口額、出口量、主要出口目的地市場)
- 批發價格趨勢分析與預測。
- 法律規範
- 主要公司列表
- 物流和基礎設施
- 季節性分析
- 墨西哥
- 生產分析(種植面積、產量、產量)
- 消費分析(消費量和消費體積)
- 進口分析(進口額、進口量、主要供應市場)
- 出口分析(出口額、出口量、主要出口目的地市場)
- 批發價格趨勢分析與預測。
- 法律規範
- 主要公司列表
- 物流和基礎設施
- 季節性分析
- 美國
- 南美洲
- 巴西
- 生產分析(種植面積、產量、產量)
- 消費分析(消費量和消費體積)
- 進口分析(進口額、進口量、主要供應市場)
- 出口分析(出口額、出口量、主要出口目的地市場)
- 批發價格趨勢分析與預測。
- 法律規範
- 主要公司列表
- 物流和基礎設施
- 季節性分析
- 哥倫比亞
- 生產分析(種植面積、產量、產量)
- 消費分析(消費量和消費體積)
- 進口分析(進口額、進口量、主要供應市場)
- 出口分析(出口額、出口量、主要出口目的地市場)
- 批發價格趨勢分析與預測。
- 法律規範
- 主要公司列表
- 物流和基礎設施
- 季節性分析
- 巴西
- 歐洲
- 德國
- 生產分析(種植面積、產量、產量)
- 消費分析(消費量和消費體積)
- 進口分析(進口額、進口量、主要供應市場)
- 出口分析(出口額、出口量、主要出口目的地市場)
- 批發價格趨勢分析與預測。
- 法律規範
- 主要公司列表
- 物流和基礎設施
- 季節性分析
- 法國
- 生產分析(種植面積、產量、產量)
- 消費分析(消費量和消費體積)
- 進口分析(進口額、進口量、主要供應市場)
- 出口分析(出口額、出口量、主要出口目的地市場)
- 批發價格趨勢分析與預測。
- 法律規範
- 主要公司列表
- 物流和基礎設施
- 季節性分析
- 義大利
- 生產分析(種植面積、產量、產量)
- 消費分析(消費量和消費體積)
- 進口分析(進口額、進口量、主要供應市場)
- 出口分析(出口額、出口量、主要出口目的地市場)
- 批發價格趨勢分析與預測。
- 法律規範
- 主要公司列表
- 物流和基礎設施
- 季節性分析
- 俄羅斯
- 生產分析(種植面積、產量、產量)
- 消費分析(消費量和消費體積)
- 進口分析(進口額、進口量、主要供應市場)
- 出口分析(出口額、出口量、主要出口目的地市場)
- 批發價格趨勢分析與預測。
- 法律規範
- 主要公司列表
- 物流和基礎設施
- 季節性分析
- 德國
- 亞太地區
- 中國
- 生產分析(種植面積、產量、產量)
- 消費分析(消費量和消費體積)
- 進口分析(進口額、進口量、主要供應市場)
- 出口分析(出口額、出口量、主要出口目的地市場)
- 批發價格趨勢分析與預測。
- 法律規範
- 主要公司列表
- 物流和基礎設施
- 季節性分析
- 印度
- 生產分析(種植面積、產量、產量)
- 消費分析(消費量和消費體積)
- 進口分析(進口額、進口量、主要供應市場)
- 出口分析(出口額、出口量、主要出口目的地市場)
- 批發價格趨勢分析與預測。
- 法律規範
- 主要公司列表
- 物流和基礎設施
- 季節性分析
- 日本
- 生產分析(種植面積、產量、產量)
- 消費分析(消費量和消費體積)
- 進口分析(進口額、進口量、主要供應市場)
- 出口分析(出口額、出口量、主要出口目的地市場)
- 批發價格趨勢分析與預測。
- 法律規範
- 主要公司列表
- 物流和基礎設施
- 季節性分析
- 泰國
- 生產分析(種植面積、產量、產量)
- 消費分析(消費量和消費體積)
- 進口分析(進口額、進口量、主要供應市場)
- 出口分析(出口額、出口量、主要出口目的地市場)
- 批發價格趨勢分析與預測。
- 法律規範
- 主要公司列表
- 物流和基礎設施
- 季節性分析
- 印尼
- 生產分析(種植面積、產量、產量)
- 消費分析(消費量和消費體積)
- 進口分析(進口額、進口量、主要供應市場)
- 出口分析(出口額、出口量、主要出口目的地市場)
- 批發價格趨勢分析與預測。
- 法律規範
- 主要公司列表
- 物流和基礎設施
- 季節性分析
- 馬來西亞
- 生產分析(種植面積、產量、產量)
- 消費分析(消費量和消費體積)
- 進口分析(進口額、進口量、主要供應市場)
- 出口分析(出口額、出口量、主要出口目的地市場)
- 批發價格趨勢分析與預測。
- 法律規範
- 主要公司列表
- 物流和基礎設施
- 季節性分析
- 越南
- 生產分析(種植面積、產量、產量)
- 消費分析(消費量和消費體積)
- 進口分析(進口額、進口量、主要供應市場)
- 出口分析(出口額、出口量、主要出口目的地市場)
- 批發價格趨勢分析與預測。
- 法律規範
- 主要公司列表
- 物流和基礎設施
- 季節性分析
- 中國
- 中東
- 沙烏地阿拉伯
- 生產分析(種植面積、產量、產量)
- 消費分析(消費量和消費體積)
- 進口分析(進口額、進口量、主要供應市場)
- 出口分析(出口額、出口量、主要出口目的地市場)
- 批發價格趨勢分析與預測。
- 法律規範
- 主要公司列表
- 物流和基礎設施
- 季節性分析
- 土耳其
- 生產分析(種植面積、產量、產量)
- 消費分析(消費量和消費體積)
- 進口分析(進口額、進口量、主要供應市場)
- 出口分析(出口額、出口量、主要出口目的地市場)
- 批發價格趨勢分析與預測。
- 法律規範
- 主要公司列表
- 物流和基礎設施
- 季節性分析
- 阿拉伯聯合大公國
- 生產分析(種植面積、產量、產量)
- 消費分析(消費量和消費體積)
- 進口分析(進口額、進口量、主要供應市場)
- 出口分析(出口額、出口量、主要出口目的地市場)
- 批發價格趨勢分析與預測。
- 法律規範
- 主要公司列表
- 物流和基礎設施
- 季節性分析
- 沙烏地阿拉伯
- 非洲
- 象牙海岸共和國
- 生產分析(種植面積、產量、產量)
- 消費分析(消費量和消費體積)
- 進口分析(進口額、進口量、主要供應市場)
- 出口分析(出口額、出口量、主要出口目的地市場)
- 批發價格趨勢分析與預測。
- 法律規範
- 主要公司列表
- 物流和基礎設施
- 季節性分析
- 奈及利亞
- 生產分析(種植面積、產量、產量)
- 消費分析(消費量和消費體積)
- 進口分析(進口額、進口量、主要供應市場)
- 出口分析(出口額、出口量、主要出口目的地市場)
- 批發價格趨勢分析與預測。
- 法律規範
- 主要公司列表
- 物流和基礎設施
- 季節性分析
- 南非
- 生產分析(種植面積、產量、產量)
- 消費分析(消費量和消費體積)
- 進口分析(進口額、進口量、主要供應市場)
- 出口分析(出口額、出口量、主要出口目的地市場)
- 批發價格趨勢分析與預測。
- 法律規範
- 主要公司列表
- 物流和基礎設施
- 季節性分析
- 象牙海岸共和國
- 北美洲
第6章 最終用途和行業
- 主要應用和新興應用
- 產業特定消費細分
第7章 競爭情勢
- 競爭格局概述
- 市場集中度分析
第8章 市場機會與未來展望
According to Mordor Intelligence, the natural rubber market size is projected to expand from USD 32.48 billion in 2025 and USD 34.33 billion in 2026 to USD 45.65 billion by 2031, registering a compound annual growth rate (CAGR) of 5.86% during 2026-2031.
This report is Segmented by Geography (North America, Asia-Pacific, and More). The Report Includes Production Analysis (Volume), Consumption Analysis (Value and Volume), Import Analysis (Value and Volume), Export Analysis (Value and Volume), Wholesale Price Trend Analysis and Forecast, List of Key Players, and More. The Market Forecasts are Provided in Terms of Value (USD) and Volume (Metric Tons).
Global Natural Rubber Market Trends and Insights
EV-Driven Tire Wear and Replacement Demand
Electric vehicles are raising tire performance requirements because heavier battery packs and instant torque profiles increase stress on tread life and abrasion resistance. That matters directly for the natural rubber market because tire makers need compounds that can withstand faster wear while maintaining grip, heat control, and durability in a heavier vehicle base. The demand effect is also recurring rather than one-time, because shorter replacement cycles can boost repeat tire purchases even when new-vehicle sales move unevenly. The Association of Natural Rubber Producing Countries said demand recovery in 2026 is supported in part by continued government incentives for electric vehicle purchases in China, which remains the most influential demand center in global trade flows . That keeps the natural rubber market closely tied to how fast electric mobility expands in Asia and in large replacement tire markets. It also means premium rubber grades are likely to see firmer interest than lower-specification supply as vehicle makers and tire companies refine products for heavier fleets.
Rebound in Chinese Construction and Mining Demand
China remains the single most important swing buyer in the global rubber trade because changes in its industrial activity quickly affect regional procurement, shipping, and working inventory. According to International Trade Center (ITC) Trade Map data, China's natural rubber import volumes increased from 2.39 million tons in 2024 to 3.17 million tons in 2025, representing a 32.3% year-over-year increase, highlighting how quickly import flows can accelerate when buying conditions and downstream demand improve. China's Ministry of Agriculture and Rural Affairs has pointed to possible support from auto and truck demand and a partial recovery in export orders, which matters because trucks, off-road vehicles, and industrial equipment all feed rubber consumption through tire demand. In the natural rubber market, even a measured rebound in Chinese construction, logistics, and mining activity can tighten nearby availability, as domestic production does not cover domestic demand. That effect is strongest for suppliers in Thailand, Vietnam, and Indonesia because China's buying patterns often reset price expectations across Asia. As a result, the natural rubber market remains highly sensitive to Chinese import momentum even when demand conditions elsewhere are mixed.
Leaf Fall Disease, White Root Rot, and Climate-Linked Yield Loss
Disease pressure is reducing effective production capacity even in the largest rubber-producing countries. The Association of Natural Rubber Producing Countries stated that output in Thailand, the world's largest rubber producer, is projected to remain flat in 2026, while Indonesia, the second-largest producer, is set to continue its production decline that began after 2022 due to low prices, leaf diseases, and land conversion to oil palm. China's Ministry of Agriculture and Rural Affairs also reported that Hainan experienced moderate to severe powdery mildew and intermittent defoliation in May 2025, disrupting latex collection during the tapping season. The European Forest Institute added that Thailand's cultivation area fell by 4.5% from 2017 to 2022 due to land constraints, climate change, labor costs, natural disasters, and leaf fall disease . For the natural rubber market, the problem is not only lower yield in a bad year. Disease-weakened trees are more exposed to heavy rain, flooding, and seasonal stress, which slows recovery and makes output less reliable across multiple cycles. That is why the natural rubber market continues to price in supply fragility, even as headline production shows modest year-on-year growth.
Other drivers and restraints analyzed in the detailed report include:
- Medical Glove Restocking and Latex Demand Normalization
- Higher Crude-Linked Synthetic Rubber Costs Supporting Substitution
- Aging Tapper Workforce and Chronic Labor Scarcity
For complete list of drivers and restraints, kindly check the Table Of Contents.
Geography Analysis
Asia-Pacific accounted for 67.8% of the natural rubber market in 2025, making it the largest regional segment by a wide margin. The natural rubber market in Asia-Pacific is built on the overlap between large plantation acreage, dense processing capacity, major tire manufacturing hubs, and the world's deepest export channels. Disease pressure and climate-related stress are reducing effective production capacity across several major rubber-producing countries. The Association of Natural Rubber Producing Countries stated that output in Thailand, the world's largest rubber producer, is projected to remain flat in 2026, while Indonesia, the second-largest producer, is set to continue its production decline that began after 2022 due to low prices, leaf diseases, and land conversion to oil palm. China's natural rubber imports increased from 2.39 million tons in 2024 to 3.17 million metric tons in 2025, marking a 32.3% year-over-year rise and underscoring the country's continued reliance on imports to meet domestic consumption requirements. India also remains a key pull factor for the natural rubber market, as the Association of Natural Rubber Producing Countries projected 3.6% demand growth in 2026 compared to 2025, while the Automotive Tire Manufacturers Association said the annual requirement stands at 1.4 million metric tons, against domestic output of 0.85 million metric tons.
Africa is the fastest regional segment in the natural rubber market, with a projected CAGR of 8.4% during 2026-2031. The natural rubber market in Africa is gaining ground as new plantation supply is increasingly paired with local processing capacity rather than solely for raw material exports. Cote d'Ivoire increased natural rubber production from approximately 0.82 million metric tons in 2019 to 1.55 million metric tons in 2023, reinforcing its emergence as Africa's largest producer and the world's third-largest producer. The country is also expanding downstream processing capacity to support growing output, with a new 100,000 metric ton-per-year plant commencing operations in Grand-Bereby in October 2024 and two additional plants projected in 2025, which together are projected to raise the company's total processing capacity in Cote d'Ivoire to nearly 0.48 million metric tons annually.
North America, Europe, South America, and the Middle East hold smaller positions in the natural rubber market, but they continue to shape trade flows because most of them rely heavily on imports. The Association of Natural Rubber Producing Countries said stronger tire shipment projections in the United States were one of the demand supports for 2026, which keeps North America important even without a large plantation base. In South America, Brazil remains a mixed case for the natural rubber market because domestic production is not enough to cover consumption, and the federal government authorized USD 4.2 million (BRL 22.2 million) in support for cultivated natural rubber from the 2025/2026 harvest. Europe is important to the natural rubber market because compliance-driven sourcing and verified traceability can influence supplier selection beyond simple price competition, especially for importers with strict due diligence requirements. The Middle East is a steadier demand pocket in the natural rubber market, with procurement linked to infrastructure logistics, tire use, and import flows from Asia rather than to local raw material production.
- The market estimate (ME) sheet in Excel format
- 3 months of analyst support
TABLE OF CONTENTS
1 Introduction
- 1.1 Study Assumptions and Market Definition
- 1.2 Scope of the Study
2 Research Methodology
3 Executive Summary
4 Market Landscape
- 4.1 Market Overview
- 4.2 Market Drivers
- 4.2.1 EV-driven tire wear and replacement demand
- 4.2.2 Rebound in Chinese construction and mining demand
- 4.2.3 Medical glove restocking and latex demand normalization
- 4.2.4 Higher crude-linked synthetic rubber costs supporting substitution
- 4.2.5 The European Union deforestation regulation-compliant and traceable rubber premium creation
- 4.2.6 AI-enabled tapping, farm monitoring, and yield optimization
- 4.3 Market Restraints
- 4.3.1 Leaf fall disease, white root rot, and climate-linked yield loss
- 4.3.2 Aging tapper workforce and chronic labor scarcity
- 4.3.3 Deforestation compliance costs and land-use constraints
- 4.3.4 Trade barriers, tire-export disruptions, and buyer destocking
- 4.4 Opportunities
- 4.5 Challenges
- 4.6 Value Chain Analysis
- 4.7 Technologies and usage of AI in the Industry
- 4.8 Input Market Analysis
- 4.8.1 Seeds
- 4.8.2 Fertilizers
- 4.8.3 Crop Protection Chemicals
- 4.9 Distribution Channel Analysis
- 4.10 Market Sentiment Analysis
- 4.11 PESTLE Analysis
5 Market Size and Growth Forecasts (Value and Volume)
- 5.1 By Geography
- 5.1.1 North America
- 5.1.1.1 United States
- 5.1.1.1.1 Production Analysis (Area Harvested, Yield, and Production Volume)
- 5.1.1.1.2 Consumption Analysis (Consumption Value and Volume)
- 5.1.1.1.3 Import Analysis (Import Value, Volume, and Key Supplying Markets)
- 5.1.1.1.4 Export Analysis (Export Value, Volume, and Key Destination Markets)
- 5.1.1.1.5 Wholesale Price Trend Analysis and Forecast
- 5.1.1.1.6 Regulatory Framework
- 5.1.1.1.7 List of Key Players
- 5.1.1.1.8 Logistics and Infrastructure
- 5.1.1.1.9 Seasonality Analysis
- 5.1.1.2 Canada
- 5.1.1.2.1 Production Analysis (Area Harvested, Yield, and Production Volume)
- 5.1.1.2.2 Consumption Analysis (Consumption Value and Volume)
- 5.1.1.2.3 Import Analysis (Import Value, Volume, and Key Supplying Markets)
- 5.1.1.2.4 Export Analysis (Export Value, Volume, and Key Destination Markets)
- 5.1.1.2.5 Wholesale Price Trend Analysis and Forecast
- 5.1.1.2.6 Regulatory Framework
- 5.1.1.2.7 List of Key Players
- 5.1.1.2.8 Logistics and Infrastructure
- 5.1.1.2.9 Seasonality Analysis
- 5.1.1.3 Mexico
- 5.1.1.3.1 Production Analysis (Area Harvested, Yield, and Production Volume)
- 5.1.1.3.2 Consumption Analysis (Consumption Value and Volume)
- 5.1.1.3.3 Import Analysis (Import Value, Volume, and Key Supplying Markets)
- 5.1.1.3.4 Export Analysis (Export Value, Volume, and Key Destination Markets)
- 5.1.1.3.5 Wholesale Price Trend Analysis and Forecast
- 5.1.1.3.6 Regulatory Framework
- 5.1.1.3.7 List of Key Players
- 5.1.1.3.8 Logistics and Infrastructure
- 5.1.1.3.9 Seasonality Analysis
- 5.1.1.1 United States
- 5.1.2 South America
- 5.1.2.1 Brazil
- 5.1.2.1.1 Production Analysis (Area Harvested, Yield, and Production Volume)
- 5.1.2.1.2 Consumption Analysis (Consumption Value and Volume)
- 5.1.2.1.3 Import Analysis (Import Value, Volume, and Key Supplying Markets)
- 5.1.2.1.4 Export Analysis (Export Value, Volume, and Key Destination Markets)
- 5.1.2.1.5 Wholesale Price Trend Analysis and Forecast
- 5.1.2.1.6 Regulatory Framework
- 5.1.2.1.7 List of Key Players
- 5.1.2.1.8 Logistics and Infrastructure
- 5.1.2.1.9 Seasonality Analysis
- 5.1.2.2 Colombia
- 5.1.2.2.1 Production Analysis (Area Harvested, Yield, and Production Volume)
- 5.1.2.2.2 Consumption Analysis (Consumption Value and Volume)
- 5.1.2.2.3 Import Analysis (Import Value, Volume, and Key Supplying Markets)
- 5.1.2.2.4 Export Analysis (Export Value, Volume, and Key Destination Markets)
- 5.1.2.2.5 Wholesale Price Trend Analysis and Forecast
- 5.1.2.2.6 Regulatory Framework
- 5.1.2.2.7 List of Key Players
- 5.1.2.2.8 Logistics and Infrastructure
- 5.1.2.2.9 Seasonality Analysis
- 5.1.2.1 Brazil
- 5.1.3 Europe
- 5.1.3.1 Germany
- 5.1.3.1.1 Production Analysis (Area Harvested, Yield, and Production Volume)
- 5.1.3.1.2 Consumption Analysis (Consumption Value and Volume)
- 5.1.3.1.3 Import Analysis (Import Value, Volume, and Key Supplying Markets)
- 5.1.3.1.4 Export Analysis (Export Value, Volume, and Key Destination Markets)
- 5.1.3.1.5 Wholesale Price Trend Analysis and Forecast
- 5.1.3.1.6 Regulatory Framework
- 5.1.3.1.7 List of Key Players
- 5.1.3.1.8 Logistics and Infrastructure
- 5.1.3.1.9 Seasonality Analysis
- 5.1.3.2 France
- 5.1.3.2.1 Production Analysis (Area Harvested, Yield, and Production Volume)
- 5.1.3.2.2 Consumption Analysis (Consumption Value and Volume)
- 5.1.3.2.3 Import Analysis (Import Value, Volume, and Key Supplying Markets)
- 5.1.3.2.4 Export Analysis (Export Value, Volume, and Key Destination Markets)
- 5.1.3.2.5 Wholesale Price Trend Analysis and Forecast
- 5.1.3.2.6 Regulatory Framework
- 5.1.3.2.7 List of Key Players
- 5.1.3.2.8 Logistics and Infrastructure
- 5.1.3.2.9 Seasonality Analysis
- 5.1.3.3 Italy
- 5.1.3.3.1 Production Analysis (Area Harvested, Yield, and Production Volume)
- 5.1.3.3.2 Consumption Analysis (Consumption Value and Volume)
- 5.1.3.3.3 Import Analysis (Import Value, Volume, and Key Supplying Markets)
- 5.1.3.3.4 Export Analysis (Export Value, Volume, and Key Destination Markets)
- 5.1.3.3.5 Wholesale Price Trend Analysis and Forecast
- 5.1.3.3.6 Regulatory Framework
- 5.1.3.3.7 List of Key Players
- 5.1.3.3.8 Logistics and Infrastructure
- 5.1.3.3.9 Seasonality Analysis
- 5.1.3.4 Russia
- 5.1.3.4.1 Production Analysis (Area Harvested, Yield, and Production Volume)
- 5.1.3.4.2 Consumption Analysis (Consumption Value and Volume)
- 5.1.3.4.3 Import Analysis (Import Value, Volume, and Key Supplying Markets)
- 5.1.3.4.4 Export Analysis (Export Value, Volume, and Key Destination Markets)
- 5.1.3.4.5 Wholesale Price Trend Analysis and Forecast
- 5.1.3.4.6 Regulatory Framework
- 5.1.3.4.7 List of Key Players
- 5.1.3.4.8 Logistics and Infrastructure
- 5.1.3.4.9 Seasonality Analysis
- 5.1.3.1 Germany
- 5.1.4 Asia-Pacific
- 5.1.4.1 China
- 5.1.4.1.1 Production Analysis (Area Harvested, Yield, and Production Volume)
- 5.1.4.1.2 Consumption Analysis (Consumption Value and Volume)
- 5.1.4.1.3 Import Analysis (Import Value, Volume, and Key Supplying Markets)
- 5.1.4.1.4 Export Analysis (Export Value, Volume, and Key Destination Markets)
- 5.1.4.1.5 Wholesale Price Trend Analysis and Forecast
- 5.1.4.1.6 Regulatory Framework
- 5.1.4.1.7 List of Key Players
- 5.1.4.1.8 Logistics and Infrastructure
- 5.1.4.1.9 Seasonality Analysis
- 5.1.4.2 India
- 5.1.4.2.1 Production Analysis (Area Harvested, Yield, and Production Volume)
- 5.1.4.2.2 Consumption Analysis (Consumption Value and Volume)
- 5.1.4.2.3 Import Analysis (Import Value, Volume, and Key Supplying Markets)
- 5.1.4.2.4 Export Analysis (Export Value, Volume, and Key Destination Markets)
- 5.1.4.2.5 Wholesale Price Trend Analysis and Forecast
- 5.1.4.2.6 Regulatory Framework
- 5.1.4.2.7 List of Key Players
- 5.1.4.2.8 Logistics and Infrastructure
- 5.1.4.2.9 Seasonality Analysis
- 5.1.4.3 Japan
- 5.1.4.3.1 Production Analysis (Area Harvested, Yield, and Production Volume)
- 5.1.4.3.2 Consumption Analysis (Consumption Value and Volume)
- 5.1.4.3.3 Import Analysis (Import Value, Volume, and Key Supplying Markets)
- 5.1.4.3.4 Export Analysis (Export Value, Volume, and Key Destination Markets)
- 5.1.4.3.5 Wholesale Price Trend Analysis and Forecast
- 5.1.4.3.6 Regulatory Framework
- 5.1.4.3.7 List of Key Players
- 5.1.4.3.8 Logistics and Infrastructure
- 5.1.4.3.9 Seasonality Analysis
- 5.1.4.4 Thailand
- 5.1.4.4.1 Production Analysis (Area Harvested, Yield, and Production Volume)
- 5.1.4.4.2 Consumption Analysis (Consumption Value and Volume)
- 5.1.4.4.3 Import Analysis (Import Value, Volume, and Key Supplying Markets)
- 5.1.4.4.4 Export Analysis (Export Value, Volume, and Key Destination Markets)
- 5.1.4.4.5 Wholesale Price Trend Analysis and Forecast
- 5.1.4.4.6 Regulatory Framework
- 5.1.4.4.7 List of Key Players
- 5.1.4.4.8 Logistics and Infrastructure
- 5.1.4.4.9 Seasonality Analysis
- 5.1.4.5 Indonesia
- 5.1.4.5.1 Production Analysis (Area Harvested, Yield, and Production Volume)
- 5.1.4.5.2 Consumption Analysis (Consumption Value and Volume)
- 5.1.4.5.3 Import Analysis (Import Value, Volume, and Key Supplying Markets)
- 5.1.4.5.4 Export Analysis (Export Value, Volume, and Key Destination Markets)
- 5.1.4.5.5 Wholesale Price Trend Analysis and Forecast
- 5.1.4.5.6 Regulatory Framework
- 5.1.4.5.7 List of Key Players
- 5.1.4.5.8 Logistics and Infrastructure
- 5.1.4.5.9 Seasonality Analysis
- 5.1.4.6 Malaysia
- 5.1.4.6.1 Production Analysis (Area Harvested, Yield, and Production Volume)
- 5.1.4.6.2 Consumption Analysis (Consumption Value and Volume)
- 5.1.4.6.3 Import Analysis (Import Value, Volume, and Key Supplying Markets)
- 5.1.4.6.4 Export Analysis (Export Value, Volume, and Key Destination Markets)
- 5.1.4.6.5 Wholesale Price Trend Analysis and Forecast
- 5.1.4.6.6 Regulatory Framework
- 5.1.4.6.7 List of Key Players
- 5.1.4.6.8 Logistics and Infrastructure
- 5.1.4.6.9 Seasonality Analysis
- 5.1.4.7 Vietnam
- 5.1.4.7.1 Production Analysis (Area Harvested, Yield, and Production Volume)
- 5.1.4.7.2 Consumption Analysis (Consumption Value and Volume)
- 5.1.4.7.3 Import Analysis (Import Value, Volume, and Key Supplying Markets)
- 5.1.4.7.4 Export Analysis (Export Value, Volume, and Key Destination Markets)
- 5.1.4.7.5 Wholesale Price Trend Analysis and Forecast
- 5.1.4.7.6 Regulatory Framework
- 5.1.4.7.7 List of Key Players
- 5.1.4.7.8 Logistics and Infrastructure
- 5.1.4.7.9 Seasonality Analysis
- 5.1.4.1 China
- 5.1.5 Middle East
- 5.1.5.1 Saudi Arabia
- 5.1.5.1.1 Production Analysis (Area Harvested, Yield, and Production Volume)
- 5.1.5.1.2 Consumption Analysis (Consumption Value and Volume)
- 5.1.5.1.3 Import Analysis (Import Value, Volume, and Key Supplying Markets)
- 5.1.5.1.4 Export Analysis (Export Value, Volume, and Key Destination Markets)
- 5.1.5.1.5 Wholesale Price Trend Analysis and Forecast
- 5.1.5.1.6 Regulatory Framework
- 5.1.5.1.7 List of Key Players
- 5.1.5.1.8 Logistics and Infrastructure
- 5.1.5.1.9 Seasonality Analysis
- 5.1.5.2 Turkey
- 5.1.5.2.1 Production Analysis (Area Harvested, Yield, and Production Volume)
- 5.1.5.2.2 Consumption Analysis (Consumption Value and Volume)
- 5.1.5.2.3 Import Analysis (Import Value, Volume, and Key Supplying Markets)
- 5.1.5.2.4 Export Analysis (Export Value, Volume, and Key Destination Markets)
- 5.1.5.2.5 Wholesale Price Trend Analysis and Forecast
- 5.1.5.2.6 Regulatory Framework
- 5.1.5.2.7 List of Key Players
- 5.1.5.2.8 Logistics and Infrastructure
- 5.1.5.2.9 Seasonality Analysis
- 5.1.5.3 United Arab Emirates
- 5.1.5.3.1 Production Analysis (Area Harvested, Yield, and Production Volume)
- 5.1.5.3.2 Consumption Analysis (Consumption Value and Volume)
- 5.1.5.3.3 Import Analysis (Import Value, Volume, and Key Supplying Markets)
- 5.1.5.3.4 Export Analysis (Export Value, Volume, and Key Destination Markets)
- 5.1.5.3.5 Wholesale Price Trend Analysis and Forecast
- 5.1.5.3.6 Regulatory Framework
- 5.1.5.3.7 List of Key Players
- 5.1.5.3.8 Logistics and Infrastructure
- 5.1.5.3.9 Seasonality Analysis
- 5.1.5.1 Saudi Arabia
- 5.1.6 Africa
- 5.1.6.1 Cote d'Ivoire
- 5.1.6.1.1 Production Analysis (Area Harvested, Yield, and Production Volume)
- 5.1.6.1.2 Consumption Analysis (Consumption Value and Volume)
- 5.1.6.1.3 Import Analysis (Import Value, Volume, and Key Supplying Markets)
- 5.1.6.1.4 Export Analysis (Export Value, Volume, and Key Destination Markets)
- 5.1.6.1.5 Wholesale Price Trend Analysis and Forecast
- 5.1.6.1.6 Regulatory Framework
- 5.1.6.1.7 List of Key Players
- 5.1.6.1.8 Logistics and Infrastructure
- 5.1.6.1.9 Seasonality Analysis
- 5.1.6.2 Nigeria
- 5.1.6.2.1 Production Analysis (Area Harvested, Yield, and Production Volume)
- 5.1.6.2.2 Consumption Analysis (Consumption Value and Volume)
- 5.1.6.2.3 Import Analysis (Import Value, Volume, and Key Supplying Markets)
- 5.1.6.2.4 Export Analysis (Export Value, Volume, and Key Destination Markets)
- 5.1.6.2.5 Wholesale Price Trend Analysis and Forecast
- 5.1.6.2.6 Regulatory Framework
- 5.1.6.2.7 List of Key Players
- 5.1.6.2.8 Logistics and Infrastructure
- 5.1.6.2.9 Seasonality Analysis
- 5.1.6.3 South Africa
- 5.1.6.3.1 Production Analysis (Area Harvested, Yield, and Production Volume)
- 5.1.6.3.2 Consumption Analysis (Consumption Value and Volume)
- 5.1.6.3.3 Import Analysis (Import Value, Volume, and Key Supplying Markets)
- 5.1.6.3.4 Export Analysis (Export Value, Volume, and Key Destination Markets)
- 5.1.6.3.5 Wholesale Price Trend Analysis and Forecast
- 5.1.6.3.6 Regulatory Framework
- 5.1.6.3.7 List of Key Players
- 5.1.6.3.8 Logistics and Infrastructure
- 5.1.6.3.9 Seasonality Analysis
- 5.1.6.1 Cote d'Ivoire
- 5.1.1 North America
6 End Use Applications and Industries
- 6.1 Primary Applications and Emerging Applications
- 6.2 Consumption Breakdown by Industries
7 Competitive Landscape
- 7.1 Overview of the Competition
- 7.2 Recent Developments
- 7.3 Market Concentration Analysis
8 Market Opportunities and Future Outlook
 全球天然橡膠市場規模、佔有率、趨勢和成長分析報告(2026-2034年)
 肋狀煙片市場:依材料類型、厚度、最終用途及通路分類-2026-2032年全球市場預測
 天然橡膠市場報告:趨勢、預測與競爭分析(至2031年)
 羅紋煙燻板材全球市場,2024-2028