


 |
市場調查報告書
商品編碼
2066482
消費電池:市場佔有率分析、產業趨勢與統計、成長預測(2026-2031)Consumer Battery - Market Share Analysis, Industry Trends & Statistics, Growth Forecasts (2026 - 2031) |
||||||

※ 本網頁內容可能與最新版本有所差異。詳細情況請與我們聯繫。
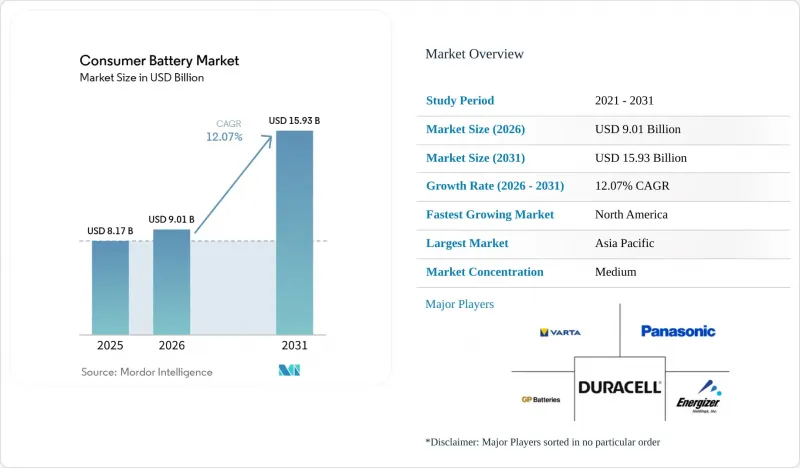
據 Mordor Intelligence 稱,2025 年消費電池市值為 81.7 億美元,預計到 2031 年將達到 159.3 億美元,而 2026 年為 90.1 億美元,預測期(2026-2031 年)的複合年成長率為 12.07%。
本報告按類型(鋰離子電池、鹼性電池、固體微型電池等)、可充電性(一次電池)、形狀(圓柱形、聚合物薄膜等)、容量(低於 1,000 mAh、1,000–3,000 mAh、3,000–10,000 mAh 和高於 10,000 mAh)、應用(智慧型手機、筆記型電腦和平板電腦等)和地區(北美、歐洲、亞太地區等)進行分類。
全球消費電池市場趨勢及洞察
家用攜帶式電子設備的需求正在激增。
2025年,包括智慧型手機、平板電腦和筆記型電腦在內的攜帶式設備出貨量將超過21億台,每台設備需要1到3節電池。無線耳機和智慧型手錶等其他電子產品也將大幅提升電池需求,預期消費者平均擁有4.2台設備。在印度和東南亞,低價行動電話劣化迅速,即使成熟市場成長趨於平緩,更短的更換週期仍然推動出貨量的成長。這種差異催生了雙軌供應策略:旗艦機型採用循環壽命超過1000次的優質鋰離子電池,而一次性應用則採用成本最佳化的鎳氫電池或鹼性電池。能夠提供多種化學成分組合產品系列的供應商正在贏得更大的市場佔有率。
鋰離子電池成本更低
鋰離子電池的價格已從兩年前的每千瓦時132美元降至2025年的每千瓦時89美元。這主要歸功於富鎳NMC 811正極材料的應用,該材料的能量密度提高了20%。成本降低33%使得可充電電池和鹼性電池在其整個生命週期內都具有成本效益,從而促進了它們在遙控器和手電筒等設備中的應用。然而,這種成本下降的趨勢正在放緩。人事費用的上升和原料避險合約意味著,預計到2027年,價格將穩定在每千瓦時85美元左右,這將對那些在2023年鋰價達到峰值時鎖定價格的生產商的利潤率構成壓力。雖然垂直整合的公司可以透過其自有礦業資產來對沖風險,但依賴現貨市場的電池組裝製造商則面臨著盈利波動的問題。
關鍵礦產供應鏈的波動性
碳酸鋰價格從2024年1月的每噸13,000美元波動至2025年12月的每噸22,000美元,導致依賴現貨市場20-30%供應的製造商毛利率下降高達500個基點。印尼的出口禁令以及澳洲和剛果民主共和國(剛果(金))礦業開發的延誤加劇了供應的不確定性,刺激了對精煉設施的投資,同時也使前置作業時間延長了兩年。固態電池減少了鈷的使用量,但在實現規模經濟之前,其商業化仍將局限於小眾消費電子設備。
細分市場分析
預計到2025年,鋰離子電池將佔據消費電池市場42.1%的佔有率,這得益於其成熟的全球供應鏈網路和接近300Wh/kg的能量密度。微型電池(一種固態電池)預計到2031年將以22.6%的複合年成長率成長,因為穿戴式裝置、醫療貼片、智慧卡和其他應用需要容量小於100mAh且壽命長達10年的電池。這一細分市場的擴張反映了消費者願意為本質安全和超薄設計支付更高的價格。鹼性電池、鋅碳電池和鎳氫電池仍用於低功耗設備,但其市場佔有率正在逐年下降。
儘管競爭對手正致力於研發不含易燃溶劑的陶瓷或聚合物電解質,但這些材料在高階市場之外仍然過於昂貴,阻礙了其廣泛應用。投資建造大規模生產線的供應商的目標是在2028年前縮小價格差距,這有望促進主流穿戴裝置對這些材料的採用。
預計到2025年,可充電電池將佔總銷售額的67.5%,年複合成長率達12.8%,並優於整體消費性電池市場。這一次電池。除煙霧偵測器和緊急手電筒外,與一次電池相關的消費電池市場持續萎縮。在這些產品中,較長的保存期限抵消了較高的生命週期成本。
零售商承諾到 2027 年停止銷售 AA 和 AAA 型一次性電池,鹼性電池的貨架空間將進一步縮小,迫使老牌企業將產品線轉向可充電電池和麵向物聯網設備的鋰一次電池。
區域分析
基於中國420GWh的電池產能和具有成本競爭力的價值鏈,亞太地區預計到2025年將佔全球電池銷售額的49.7%。日本和韓國企業正專注於高階圓柱形電池和固態電池,並在其核心電子產品領域維持著60%以上的利潤率。印度透過擴大補貼支持的組裝基地獲得了一定的價值,但由於其對正極材料和電解進口的依賴,其與上游工程的整合程度有限。
北美地區到2031年將以17.7%的複合年成長率成長,這主要得益於每千瓦時35美元的先進製造業生產稅額扣抵(AMPC)。Panasonic、LG和三星SDI宣布的超過730億美元的產能將推動智慧型手機、筆記型電腦和穿戴式裝置的本地供應。加拿大的關鍵礦產策略旨在滿足高達20%的區域需求,並降低進口依賴度。
歐洲佔消費電池市場18.4%的佔有率,但由於「電池法規」導致合規成本上升,其複合年成長率僅9.3%。 VARTA和Northvolt等本土企業正在擴大產能,但難以獲得資金籌措,凸顯了監管成本對利潤率的巨大壓力。南美和中東/非洲地區的市場佔有率雖然較小,但由於收入成長帶動智慧型手機和穿戴式裝置的普及,這些地區的成長率卻達到了兩位數。
其他好處:
- Excel格式的市場預測(ME)表
- 3個月的分析師支持
目錄
第1章:引言
- 研究假設和市場定義
- 調查範圍
第2章:調查方法
第3章執行摘要
第4章 市場狀況
- 市場概覽
- 市場促進因素
- 攜帶式家用電器需求激增
- 降低鋰離子電池的成本
- 智慧型穿戴裝置和物聯網生態系統的擴展
- 關於「維修權」的法律正在鼓勵以舊換新。
- 固體微型電池在穿戴式音訊裝置的應用
- 訂閱式「電池即服務 (BaaS)」模式的興起
- 市場限制因素
- 關鍵礦產供應鏈的波動性
- 因過熱事件引發安全召回
- 一次性電池的廢棄物處理規定
- 低功耗半導體導致更換需求下降。
- 供應鏈分析
- 監理情勢
- 技術展望
- 波特五力模型
第5章 市場規模與成長預測
- 按類型
- 鋰離子
- 鹼性電池
- 鋅和碳
- 鎳氫電池
- 鎳和鎘
- 固體電池
- 鋅 - 空氣
- 其他
- 性收費
- 一次電池
- 備用電池(可充電)
- 按形狀
- 圓柱形
- 棱鏡
- 小袋
- 硬幣/按鈕
- 聚合物薄膜
- 按產能
- 1000mAh 或更少
- 1,000~3,000 mAh
- 3,000~10,000 mAh
- 10,000毫安時或以上
- 透過使用
- 智慧型手機
- 筆記型電腦和平板電腦
- 穿戴式裝置
- 遊戲控制器和掌上型遊戲機
- 智慧家庭設備
- 小型家用電器
- 個人行動裝置
- 醫療消費性設備
- 其他
- 按地區
- 北美洲
- 美國
- 加拿大
- 墨西哥
- 歐洲
- 英國
- 德國
- 法國
- 西班牙
- 北歐國家
- 俄羅斯
- 其他歐洲國家
- 亞太地區
- 中國
- 印度
- 日本
- 韓國
- 東南亞國協
- 澳洲和紐西蘭
- 其他亞太國家
- 南美洲
- 巴西
- 阿根廷
- 哥倫比亞
- 其他南美國家
- 中東和非洲
- 沙烏地阿拉伯
- 阿拉伯聯合大公國
- 南非
- 埃及
- 其他中東和非洲國家
- 北美洲
第6章 競爭情勢
- 市場集中度
- 策略趨勢(併購、聯盟、購電協議)
- 市場佔有率分析(主要公司的市場排名和佔有率)
- 公司簡介
- Duracell Inc.
- Energizer Holdings Inc.
- Panasonic Holdings Corp.
- VARTA AG
- GP Batteries International Ltd.
- LG Energy Solution Ltd.
- Samsung SDI Co. Ltd.
- Sony Group Corp.
- Maxell Holdings Ltd.
- Amperex Technology Ltd.(ATL)
- TDK Corp.(incl. Murata)
- Toshiba Corp.
- A123 Systems LLC
- BYD Co. Ltd.
- EVE Energy Co. Ltd.
- Renata SA
- FDK Corp.
- Ultralife Corp.
- NantEnergy Inc.
- PolyPlus Battery Co. Inc.
第7章 市場機會與未來展望
According to Mordor Intelligence, the consumer battery market size was valued at USD 8.17 billion in 2025 and is estimated to grow from USD 9.01 billion in 2026 to reach USD 15.93 billion by 2031, at a CAGR of 12.07% during the forecast period (2026-2031).
This report is Segmented by Type (Lithium-Ion, Alkaline, Solid-State Micro-Batteries, and More), Rechargeability (Primary and Secondary), Form Factor (Cylindrical, Polymer Thin-Film, and More), Capacity (Up To 1, 000 MAh, 1, 000 To 3, 000 MAh, 3, 000 To 10, 000 MAh, and Above 10, 000 MAh), Application (Smartphones, Laptops and Tablets, and More), and Geography (North America, Europe, Asia-Pacific, and More).
Global Consumer Battery Market Trends and Insights
Surging Demand for Portable Consumer Electronics
More than 2.1 billion portable devices were shipped in 2025, spanning smartphones, tablets, and laptops, and each required between one and three battery cells. Secondary gadgets such as wireless earbuds and smartwatches added sizeable incremental cell demand, pushing the average consumer's device count to 4.2. Shorter replacement cycles in India and Southeast Asia, where budget handsets degrade faster, reinforce volume growth even as mature markets plateau. This divergence shapes a dual-track supply strategy: premium lithium-ion cells with 1,000-plus charge cycles for flagship phones and cost-optimized nickel-metal hydride or alkaline cells for disposable uses. Suppliers that manage multi-chemistry portfolios capture broader wallet share.
Declining Lithium-Ion Battery Costs
Lithium-ion cell pricing slid to USD 89 per kilowatt-hour in 2025 from USD 132 two years prior, chiefly due to nickel-rich NMC 811 cathodes delivering 20% higher energy density. This 33% cost retreat places rechargeables on parity with alkalines over the full duty cycle, catalyzing substitution in remote controls and flashlights. The down-cycle, however, is flattening: inflated labor charges and hedged raw-material contracts are expected to cap further declines near USD 85 through 2027, tightening margins for producers that locked in lithium at 2023 peaks. Vertically integrated players hedge risk via captive mining assets, while cell assemblers reliant on spot markets face profitability swings.
Critical-Mineral Supply Chain Volatility
Lithium carbonate prices swung from USD 13,000 per ton in January 2024 to USD 22,000 by December 2025, compressing gross margins by up to 500 basis points for manufacturers with 20-30% spot exposure. Export bans in Indonesia and mine delays in Australia and the DRC prolong supply uncertainty, spurring refinery investments yet adding two-year lead times. Although solid-state batteries reduce cobalt intensity, commercialization remains limited to niche consumer devices pending scale economics.
Other drivers and restraints analyzed in the detailed report include:
- Expansion of Smart Wearables & IoT Ecosystem
- Right-to-Repair Laws Boosting Replacement Sales
- Safety Recalls from Thermal-Runaway Incidents
For complete list of drivers and restraints, kindly check the Table Of Contents.
Segment Analysis
Lithium-ion held 42.1% consumer battery market share in 2025, thanks to mature global supply networks and energy densities near 300 Wh/kg. Solid-state micro-batteries are projected to grow 22.6% CAGR through 2031 as hearables, medical patches, and smart cards require sub-100 mAh capacities and ten-year lifespans. The consumer battery market size expansion in this niche reflects a premium willingness to pay for intrinsic safety and ultra-thin profiles. Alkaline, zinc-carbon, and nickel-metal hydride chemistries continue to serve low-drain devices but yield a share each year.
Competition centers on ceramic or polymer electrolytes that remove flammable solvents, yet cost remains prohibitive outside high-value segments. Suppliers investing in mass-production lines aim to close the price gap by 2028, potentially widening adoption into mainstream wearables.
Secondary batteries controlled 67.5% of 2025 revenue and will outpace the overall consumer battery market at 12.8% CAGR thanks to falling lithium-ion costs and extended producer responsibility fees on disposables. EU rules mandating minimum recycled content and California's USD 0.10 fee per primary cell tilt total-cost-of-ownership decisively toward rechargeables. The consumer battery market size attached to primary cells continues to shrink except in smoke detectors and emergency flashlights, where long shelf life offsets higher life-cycle cost.
Retailers pledging to pull AA and AAA disposables by 2027 will compress shelf space for alkalines further, forcing legacy brands to pivot toward rechargeable or lithium primary lines positioned for IoT devices.
Geography Analysis
Asia-Pacific generated 49.7% of 2025 revenue, anchored by China's 420 GWh of cell capacity and cost-advantaged supply chains. Japanese and South Korean firms concentrate on premium cylindrical and solid-state formats, sustaining margins above 60% in flagship electronics. India's subsidy-backed assembly expansions capture partial value yet rely on imported cathode and electrolyte inputs, limiting upstream integration.
North America, buoyed by a USD 35 per kWh Advanced Manufacturing Production Credit, is expanding at a 17.7% CAGR through 2031. Over USD 73 billion of announced capacity from Panasonic, LG, and Samsung SDI is bringing localized supply to smartphones, laptops, and wearables. Canada's critical-mineral strategy seeks to supply up to 20% of regional demand, reducing import dependence.
Europe holds 18.4% of the consumer battery market size, but grows at a slower 9.3% CAGR as the Battery Regulation raises compliance costs. Domestic players VARTA and Northvolt expand capacity yet struggle with financing, highlighting regulatory cost pressure on margins. South America and the Middle East & Africa contribute smaller shares, yet post double-digit growth where rising incomes boost smartphone and wearable penetration.
- Duracell Inc.
- Energizer Holdings Inc.
- Panasonic Holdings Corp.
- VARTA AG
- GP Batteries International Ltd.
- LG Energy Solution Ltd.
- Samsung SDI Co. Ltd.
- Sony Group Corp.
- Maxell Holdings Ltd.
- Amperex Technology Ltd. (ATL)
- TDK Corp. (incl. Murata)
- Toshiba Corp.
- A123 Systems LLC
- BYD Co. Ltd.
- EVE Energy Co. Ltd.
- Renata SA
- FDK Corp.
- Ultralife Corp.
- NantEnergy Inc.
- PolyPlus Battery Co. Inc.
Additional Benefits:
- The market estimate (ME) sheet in Excel format
- 3 months of analyst support
TABLE OF CONTENTS
1 Introduction
- 1.1 Study Assumptions & Market Definition
- 1.2 Scope of the Study
2 Research Methodology
3 Executive Summary
4 Market Landscape
- 4.1 Market Overview
- 4.2 Market Drivers
- 4.2.1 Surging demand for portable consumer electronics
- 4.2.2 Declining lithium-ion battery costs
- 4.2.3 Expansion of smart wearables & IoT ecosystem
- 4.2.4 Right-to-repair laws boosting replacement sales
- 4.2.5 Emergence of solid-state micro-batteries for hearables
- 4.2.6 Rise of subscription-based battery-as-a-service models
- 4.3 Market Restraints
- 4.3.1 Critical-mineral supply chain volatility
- 4.3.2 Safety recalls from thermal-runaway incidents
- 4.3.3 Waste-disposal rules targeting single-use cells
- 4.3.4 Low-power semiconductors cutting replacement demand
- 4.4 Supply-Chain Analysis
- 4.5 Regulatory Landscape
- 4.6 Technological Outlook
- 4.7 Porter's Five Forces
- 4.7.1 Bargaining Power of Suppliers
- 4.7.2 Bargaining Power of Buyers
- 4.7.3 Threat of New Entrants
- 4.7.4 Threat of Substitutes
- 4.7.5 Competitive Rivalry
5 Market Size & Growth Forecasts
- 5.1 By Type
- 5.1.1 Lithium-ion
- 5.1.2 Alkaline
- 5.1.3 Zinc-Carbon
- 5.1.4 Nickel-Metal Hydride
- 5.1.5 Nickel-Cadmium
- 5.1.6 Solid-state Micro-batteries
- 5.1.7 Zinc-Air
- 5.1.8 Others
- 5.2 By Rechargeability
- 5.2.1 Primary (Disposable)
- 5.2.2 Secondary (Rechargeable)
- 5.3 By Form Factor
- 5.3.1 Cylindrical
- 5.3.2 Prismatic
- 5.3.3 Pouch
- 5.3.4 Coin/Button
- 5.3.5 Polymer Thin-Film
- 5.4 By Capacity Range
- 5.4.1 Up to 1,000 mAh
- 5.4.2 1,000 to 3,000 mAh
- 5.4.3 3,000 to 10,000 mAh
- 5.4.4 Above 10,000 mAh
- 5.5 By Application
- 5.5.1 Smartphones
- 5.5.2 Laptops and Tablets
- 5.5.3 Wearables
- 5.5.4 Gaming Controllers and Handhelds
- 5.5.5 Smart-Home Devices
- 5.5.6 Small Home Appliances
- 5.5.7 Personal Mobility Devices
- 5.5.8 Medical Consumer Devices
- 5.5.9 Others
- 5.6 By Geography
- 5.6.1 North America
- 5.6.1.1 United States
- 5.6.1.2 Canada
- 5.6.1.3 Mexico
- 5.6.2 Europe
- 5.6.2.1 United Kingdom
- 5.6.2.2 Germany
- 5.6.2.3 France
- 5.6.2.4 Spain
- 5.6.2.5 NORDIC Countries
- 5.6.2.6 Russia
- 5.6.2.7 Rest of Europe
- 5.6.3 Asia-Pacific
- 5.6.3.1 China
- 5.6.3.2 India
- 5.6.3.3 Japan
- 5.6.3.4 South Korea
- 5.6.3.5 ASEAN Countries
- 5.6.3.6 Australia and New Zealand
- 5.6.3.7 Rest of Asia-Pacific
- 5.6.4 South America
- 5.6.4.1 Brazil
- 5.6.4.2 Argentina
- 5.6.4.3 Colombia
- 5.6.4.4 Rest of South America
- 5.6.5 Middle East and Africa
- 5.6.5.1 Saudi Arabia
- 5.6.5.2 United Arab Emirates
- 5.6.5.3 South Africa
- 5.6.5.4 Egypt
- 5.6.5.5 Rest of Middle East and Africa
- 5.6.1 North America
6 Competitive Landscape
- 6.1 Market Concentration
- 6.2 Strategic Moves (M&A, Partnerships, PPAs)
- 6.3 Market Share Analysis (Market Rank/Share for key companies)
- 6.4 Company Profiles (includes Global level Overview, Market level overview, Core Segments, Financials as available, Strategic Information, Products & Services, and Recent Developments)
- 6.4.1 Duracell Inc.
- 6.4.2 Energizer Holdings Inc.
- 6.4.3 Panasonic Holdings Corp.
- 6.4.4 VARTA AG
- 6.4.5 GP Batteries International Ltd.
- 6.4.6 LG Energy Solution Ltd.
- 6.4.7 Samsung SDI Co. Ltd.
- 6.4.8 Sony Group Corp.
- 6.4.9 Maxell Holdings Ltd.
- 6.4.10 Amperex Technology Ltd. (ATL)
- 6.4.11 TDK Corp. (incl. Murata)
- 6.4.12 Toshiba Corp.
- 6.4.13 A123 Systems LLC
- 6.4.14 BYD Co. Ltd.
- 6.4.15 EVE Energy Co. Ltd.
- 6.4.16 Renata SA
- 6.4.17 FDK Corp.
- 6.4.18 Ultralife Corp.
- 6.4.19 NantEnergy Inc.
- 6.4.20 PolyPlus Battery Co. Inc.
7 Market Opportunities & Future Outlook
- 7.1 White-Space & Unmet-Need Assessment

 鋅碳圓柱形電池市場:全球市場預測,2026-2032年消費性電池市場:全球市場預測,2026-2032年
 消費電池市場-全球產業規模、佔有率、趨勢、機會、預測:按類型、電池化學成分、應用、地區和競爭格局分類,2021-2031年
 消費性電池市場:按電池類型、形狀、應用和地區分類
 消費電池市場規模、佔有率、成長及全球產業分析:按類型、應用和地區分類,並預測至2026-2034年
 2025-2029年全球消費電池市場
 消費電池市場規模、佔有率和成長分析(按電池類型、電池化學成分、容量、外形尺寸、應用、最終用戶、分銷管道和地區分類)—產業預測(2026-2033 年)
 中東和非洲消費電池市場:市場佔有率分析、行業趨勢和成長預測(2025-2030 年)北美消費電池市場佔有率分析、產業趨勢及成長預測(2025-2030)
 2030 年消費電池市場預測:按類型、電池化學、應用、最終用戶和地區進行的全球分析