

 |
市場調查報告書
商品編碼
2066475
合成氣:市場佔有率分析、產業趨勢與統計、成長預測(2026-2031)Syngas - Market Share Analysis, Industry Trends & Statistics, Growth Forecasts (2026 - 2031) |
||||||
※ 本網頁內容可能與最新版本有所差異。詳細情況請與我們聯繫。
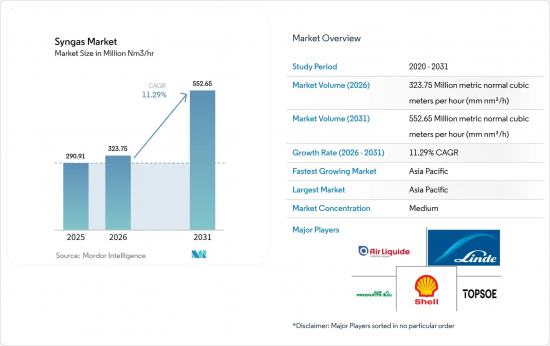
據 Mordor Intelligence 稱,合成氣市場規模預計將從 2025 年的 2.9091 億公制標準立方米/小時 (mm nm3/h) 擴大到 2026 年的 3.2375 億公制標準立方米/小時 (mm nm3/h),並預計到 20262 年標準1535
預計從 2026 年到 2031 年,產能將擴大到每小時 7,500 萬公制標準立方公尺(mm nm3/h),複合年成長率為 11.29%,到 2031 年將達到每小時 5.5265 億公制標準立方公尺(mm nm3/h)。
本報告按原料(煤、天然氣等)、技術(蒸氣重組和氣化)、氣化爐類型(固定台、流體化床和氣流床)、應用(甲醇、氨等)以及地區(亞太、北美、歐洲、南美、中東和非洲)進行細分。市場預測以銷售量(單位)為基礎。
全球合成氣市場趨勢與洞察
中國對甲醇制烯烴(MTO)聯合裝置的需求激增
中國石化產業正從以汽油為中心的煉製模式轉型為高附加價值化工產品生產。寧夏煤炭工業投資118億元建設的年產360萬噸DMTO-III裝置的完工,體現了對MTO製程的信心。該項目實現了焦煤和天然氣的節約,並減少了二氧化碳排放,凸顯了國家從燃料生產轉向最大化煤炭價值(透過化學產品)的趨勢。在MTO裝置中,合成氣是提高烯烴產量的限制因素,因為生產1噸乙烯當量大約需要2.8噸合成氣。中國石油化學股份有限公司(中石化)引進的先進催化熱解技術提高了低碳烯烴的產率,並進一步降低了排放。隨著從原油到化學產品的一體化裝置的成熟,這些裝置將提供柔軟性,從而在需求波動時穩定利潤率,並推動合成氣市場的持續成長。
提高南亞和非洲的化肥生產能力
受糧食安全和人口成長的驅動,大規模氨計畫正在推進,進一步推高了合成氣的需求。 AM Green Ammonia公司已最終決定在卡基納達建造一座年產100萬噸的綠色氨工廠,目標是到2030年實現年產500萬噸。該計畫已獲得歐盟RFNBO法規的預先認證,顯示其旨在開拓歐洲高階市場的戰略意圖。預計全球氨日消費量將從2024年的2.01億噸增加到2040年的3.1億噸,其中大部分仍將用於生產尿素肥料。 Perdaman公司在其日產3500噸的工廠中採用了Topsaw公司的「SynCOR」技術,實現了規模經濟,顯著降低了單位成本並提高了合成氣利用效率。這種超大規模設計將合成氣需求集中在少數中心,凸顯了區域需求的激增,並加速了相關基礎設施的發展。
美國和歐盟對俄羅斯製造的氣化設備的相關規定
制裁收緊了對出口至俄羅斯的油氣設備的出口許可,其中包括合成氣生產所必需的氣化爐和輔助系統。美國商務部對大多數申請採取了「拒絕式」政策,而歐盟的第14輪制裁方案則禁止投資在建的俄羅斯液化天然氣計畫。超過180艘船舶因非法運輸行為(包括運輸合成氣技術)而禁止出口。歐洲開發商現在被迫應對更長的採購週期和更高的價格,因為他們需要採購非俄羅斯設備,這導致試運行計劃延長。金融機構已將這些地緣政治風險反映在其貸款條款中,提高了依賴受供應限制供應商的專案的借貸成本。因此,在替代供應鏈穩定之前,合成氣市場將面臨短期低迷。
細分市場分析
到2025年,天然氣將佔合成氣市場佔有率的69.10%,這反映了蒸氣重整基礎設施的普及和具有競爭力的供應。預計到2031年,該細分市場的複合年成長率將達到16.38%,在所有原料中位居榜首,這主要得益於對藍氫將碳捕獲技術融入現有設施。埃克森美孚等業者計劃在貝城綜合設施中去除重整流程中98%的二氧化碳,凸顯了脫碳的潛力。與儲存中心和氫氣管道的整合將降低額外的物流成本,並保持成長動能。隨著石化生產商轉向低碳分子,以天然氣為基礎的合成氣市場規模預計將快速擴張。
煤炭在能源結構中仍佔有重要地位,尤其是在中國,國內蘊藏量保障了能源安全和成本穩定性。監管要求提高冷氣效率和碳捕獲能力,這將增加資本投資,但也能改善環境績效。石油焦氣化解決了煉廠廢棄物的有效利用問題,使業者能夠將高硫廢料變現,並減輕廢棄物處理的負擔。可再生原料,主要是都市固態廢棄物和農業殘餘物,目前市佔率較小,但在低碳燃料標準的推動下,其價值正在不斷提升。隨著技術的成熟,人們對原料組合多樣化的期望日益提高,長期投資者也持續關注合成氣市場。
2025年,氣化技術佔銷售額的54.40%,而蒸氣重整技術預計到2031年將以12.71%的複合年成長率成長,這體現了其對藍氫生產過程的適應性。蒸氣重整器與廢熱回收相結合,可實現超過80%的熱效率;透過引入碳捕獲技術,可顯著降低生命週期排放,從而獲得高價銷售合約。液化空氣集團的可再生氫計畫表明,回收的生物來源產品可以取代化石烴作為重整器的原料,在無需對設備進行大規模改造的情況下降低排放強度。自發性熱重組技術的創新進一步降低了氧氣需求,從而降低了公用事業成本和資本投資。
氣化技術在原料柔軟性方面仍具有優勢,可在同一反應器系列中處理煤、石油焦和生質能。氣流床氣化爐和流體化床氣化爐分別針對提高處理能力和適應多種原料進行了最佳化。美國國家能源技術實驗室(NETL)的催化蒸氣氣化方法僅使用蒸氣即可消除氮氣稀釋,從而提高了氨合成和費托合成產品的純度。混合方法,例如林德公司的“熱氧技術”,結合了重整和氣化,將殘餘焦油轉化為額外的合成氣,從而提高總收率。這些持續的改進確保了氣化技術的競爭力,即使蒸氣重整在脫碳領域發展迅速,也保證了合成氣市場中各種技術的應用。
區域分析
預計到2025年,亞太地區將佔全球需求的59.02%,並將在2031年之前保持13.57%的複合年成長率,為所有地區中最高。中國龐大的煤化工產業基地正隨著寧夏煤業投資118億元所興建的DMTO-III裝置的投產而進一步擴張,這必將產生對上游合成氣的龐大需求。印度的「國家綠色氫能計畫」正在支持諸如AM綠色氨等項目,目標是到2030年實現500萬噸的出口產能。東南亞國家正在引進分散式氣化裝置,將農業廢棄物轉化為電力和化學肥料的中間原料,從而降低進口成本。這些措施正在支撐該地區的合成氣市場,並促進專業工程基地的發展。
在北美,低成本的頁岩氣和慷慨的碳捕獲獎勵正被充分利用。空氣產品公司在路易斯安那州投資45億美元的綜合設施將每天供應7.5億標準立方英尺的藍氫,每年封存500萬噸二氧化碳,並連接700英里的管道網路。林德公司在亞伯達投資超過20億美元的Path2Zero工廠,將自熱重整與碳捕獲和封存技術結合,以增強整個北美大陸的供應韌性。加拿大各省已成為氨和甲醇出口亞洲的樞紐,進一步鞏固了跨太平洋貿易中的合成氣市場。
歐洲正引領可再生能源發展。液化空氣集團及其合作夥伴正在鹿特丹和澤蘭開發450兆瓦的電解,預計每年可生產5.3萬噸綠色氫氣。德國和荷蘭關於永續航空燃料(SAF)的法律義務確保了電力製液態燃料(P2L)轉化裝置的可靠市場,從而提振了資本市場的信心。中東和非洲受益於豐富的天然氣資源和成熟的石化港口,預計到2028年,沙烏地阿美公司的擴建計畫將使日產量增加31.5億標準立方英尺。南美洲的潛力正透過智利Volta AG公司投資25億美元的綠色氨計畫而逐漸顯現。這種地理分佈凸顯了合成氣市場在多元化的政策和資源環境下蓬勃發展。
其他好處:
- Excel格式的市場預測(ME)表
- 3個月的分析師支持
目錄
第1章:引言
- 研究假設和市場定義
- 調查範圍
第2章:調查方法
第3章執行摘要
第4章 市場狀況
- 市場概覽
- 市場促進因素
- 中國對甲醇制烯烴(MTO)聯合裝置的需求激增
- 提高南亞和非洲的化肥生產能力
- 嚴格的排放法規正在推動煤改氣(CTG)轉型計畫。
- 強制使用碳中和航空燃料(電力製液)
- 利用都市固態廢棄物氣化生產電網級氫氣
- 市場限制因素
- 美國和歐盟對俄羅斯製造的氣化設備的相關規定
- 煤炭和天然氣等原料價格的波動
- 生質能氣化計畫資金籌措可能性的局限性
- 價值鏈分析
- 波特五力模型
第5章 市場規模與成長預測
- 按原料
- 煤炭
- 天然氣
- 石油焦
- 其他原料類型
- 透過技術
- 蒸氣重組
- 氣化
- 依燃氣火類型
- 固定台
- 流體化床
- 夾帶流
- 透過使用
- 甲醇
- 氨
- 氫
- 液體燃料
- 合成天然氣
- 直接還原鐵
- 電力
- 其他用途
- 按地區
- 亞太地區
- 中國
- 印度
- 其他亞太國家
- 北美洲
- 美國
- 加拿大
- 千里達及托巴哥
- 歐洲
- 俄羅斯
- 其他歐洲國家
- 南美洲
- 巴西
- 委內瑞拉
- 其他南美國家
- 中東和非洲
- 沙烏地阿拉伯
- 卡達
- 南非
- 伊朗
- 其他中東和非洲國家
- 亞太地區
第6章 競爭情勢
- 市場集中度
- 策略趨勢
- 市佔率和排名分析
- 公司簡介
- AHT Syngas Technology NV
- Air Liquide
- Air Products and Chemicals, Inc.
- BASF SE
- John Wood Group PLC
- KBR Inc.
- Linde plc
- MAIRE SpA
- POSCO
- Sasol
- Shell plc
- Technip Energies NV
- Thyssenkrupp
- Topsoe A/S
第7章 市場機會與未來展望
According to Mordor Intelligence, the syngas market size is expected to grow from 290.91 Million metric normal cubic meters per hour (mm nm3/h) in 2025 to 323.75 Million metric normal cubic meters per hour (mm nm3/h) in 2026 and is forecast to reach 552.65 Million metric normal cubic meters per hour (mm nm3/h) by 2031 at 11.29% CAGR over 2026-2031.
This report is Segmented by Feedstock (Coal, Natural Gas, and More), Technology (Steam Reforming and Gasification), Gasifier Type (Fixed Bed, Fluidized Bed, and Entrained Flow), Application (Methanol, Ammonia, and More), and Geography (Asia-Pacific, North America, Europe, South America, and Middle-East and Africa). The Market Forecasts are Provided in Terms of Volume (Units).
Global Syngas Market Trends and Insights
Surging Demand for Methanol-To-Olefins (MTO) Complexes in China
China's petrochemical industry is shifting from gasoline centric refining to higher-value chemical production. Completion of Ningxia Coal Industry's 3.6 million tons per annum DMTO-III plant, a CNY 11.8 billion investment, demonstrates confidence in the MTO route. The project saves raw coal and natural gas while cutting CO2 emissions, underscoring a broader national pivot toward monetizing coal via chemicals rather than fuels. MTO capacity requires about 2.8 tons of syngas to yield 1 ton of ethylene equivalent, so syngas becomes the limiting reagent for incremental olefins output. Advanced catalytic pyrolysis from SINOPEC boosts light-olefin yields and further lowers emissions. As integrated crude-to-chemical complexes mature, they unlock flexibility that buffers margins during demand swings, creating enduring syngas market growth.
Fertilizer Capacity Additions in South Asia and Africa
Food security priorities and population expansion drive large ammonia projects that intensify syngas demand. AM Green Ammonia reached a final investment decision on a 1 million ton green plant in Kakinada and targets 5 million tons per year by 2030. The project has pre-certification under EU RFNBO rules, signaling strategic intent to capture premium European offtake. Global ammonia consumption is forecast to rise from 201 million tons in 2024 to 310 million tons by 2040, with the bulk still routed to urea fertilizers. Perdaman selected Topsoe's SynCOR for a 3,500 metric tons per day plant, achieving economies of scale that slash unit costs and raise syngas utilization efficiency. Such gigascale designs concentrate syngas requirements in fewer hubs, heightening regional demand spikes and stimulating supporting infrastructure.
US-EU Restrictions on Russian Gasification Equipment
Sanctions have tightened export licensing for oil and gas equipment to Russia, covering gasifiers and ancillary systems critical for syngas production. The US Commerce Department applies a presumption of denial for most applications, while the EU's 14th package bars investment in Russian LNG projects under construction. More than 180 vessels face prohibition due to illicit shipping practices that include syngas technology deliveries. European developers now navigate longer procurement cycles and premium pricing to source non-Russian equipment, delaying commissioning schedules. Financing institutions incorporate these geopolitical risks into credit terms, raising debt costs for projects exposed to restricted suppliers. As a result, the syngas market faces near-term setbacks until alternative supply chains stabilize.
Other drivers and restraints analyzed in the detailed report include:
- Stringent Emission Norms Driving Coal-To-Gas Projects
- Carbon-Neutral Aviation Fuel Mandates (Power-To-Liquids)
- Volatility in Coal and Natural-Gas Feedstock Pricing
For complete list of drivers and restraints, kindly check the Table Of Contents.
Segment Analysis
Natural gas generated 69.10% of syngas market share in 2025, reflecting widespread steam reforming infrastructure and competitively priced supply. The segment is forecast to post a 16.38% CAGR through 2031, the highest among all feedstocks, driven by blue hydrogen investments that embed carbon capture into existing facilities. Operators such as ExxonMobil plan to remove 98% of CO2 from reforming streams at the Baytown complex, underscoring decarbonization potential. Integration with sequestration hubs and hydrogen pipelines lowers incremental logistics cost and sustains growth momentum. The syngas market size for natural gas feedstock is projected to expand quickly as petrochemical producers shift toward lower-carbon molecules.
Coal remains structurally important, especially in China where domestic reserves offer energy security and cost certainty. Regulatory mandates compel higher cold-gas efficiencies and carbon capture, which raises capital expenditure but improves environmental performance. Petroleum coke gasification addresses refinery waste valorization, allowing operators to monetize high-sulfur streams and reduce disposal liabilities. Renewable feedstocks, led by municipal solid waste and agricultural residues, currently represent a small portion but earn credits under low-carbon fuel standards. As technology matures, expectations of a broader feedstock mix keep long-term investors engaged in the syngas market.
Gasification technologies delivered 54.40% of 2025 revenue, yet steam reforming is expected to expand at a 12.71% CAGR through 2031, reflecting its adaptability to blue hydrogen pathways. Steam reformers achieve thermal efficiencies above 80% when complemented by waste-heat recovery, and carbon capture insertion lowers lifecycle emissions enough to earn premium offtake contracts. Air Liquide's renewable hydrogen projects demonstrate how recycled biogenic by-products can replace fossil hydrocarbons in reformer feedstocks, cutting emission intensity without major hardware changes. Innovations in autothermal reforming further reduce oxygen demand, thereby lowering utility cost and capital expenditure.
Gasification retains an edge in feedstock flexibility, processing coal, petcoke, and biomass within the same reactor family. Entrained flow and fluidized bed gasifiers optimize for higher throughput or feedstock variability, respectively. NETL's catalytic steam gasification eliminates nitrogen dilution by operating with steam alone, boosting product purity for ammonia or Fischer-Tropsch synthesis. Hybrid approaches such as Linde's Hot Oxygen Technology combine reforming and gasification, converting residual tars into additional syngas and lifting overall yield. These continuous improvements keep gasification competitive even as steam reforming gains low-carbon momentum, ensuring diverse technology adoption within the syngas market.
Geography Analysis
Asia-Pacific commanded 59.02% of 2025 demand and is forecast to register a 13.57% CAGR through 2031, the highest among regions. China's massive coal chemical base expands further with Ningxia Coal Industry's CNY 11.8 billion DMTO-III installation, ensuring a vast pull on upstream syngas. India's National Green Hydrogen Mission supports projects like AM Green Ammonia, aiming for 5 million tons of export-oriented capacity by 2030. Southeast Asian countries add distributed gasifiers to convert agricultural residues into power and fertiliser intermediates, thereby reducing import bills. These activities anchor the syngas market in the region and foster specialized engineering hubs.
North America leverages low-cost shale gas and generous carbon capture incentives. Air Products' USD 4.5 billion Louisiana complex will deliver 750 million scf/d of blue hydrogen and sequester 5 million tons of CO2 annually, integrating with 700 miles of pipeline. Linde's Path2Zero facility in Alberta invests more than USD 2 billion to combine autothermal reforming with CCS, strengthening continental supply resilience. Canadian provinces position themselves as export gateways for ammonium and methanol to Asia, further embedding the syngas market in trans-Pacific trade.
Europe pushes renewable pathways. Air Liquide and its partners are developing 450 MW of electrolyzers in Rotterdam and Zeeland, collectively producing 53,000 tons of green hydrogen each year. Statutory obligations on SAF create guaranteed offtake for power-to-liquid plants in Germany and the Netherlands, raising capital confidence. Middle-East and Africa benefit from abundant natural gas and established petrochemical ports, with Aramco's expansion adding 3.15 billion scf/d by 2028. South American potential emerges through Chile's Volta USD 2.5 billion green ammonia venture. The geographic spread underscores how the syngas market thrives in diverse policy and resource settings.
List of Companies Covered in this Report:
- AHT Syngas Technology N.V.
- Air Liquide
- Air Products and Chemicals, Inc.
- BASF SE
- John Wood Group PLC
- KBR Inc.
- Linde plc
- MAIRE S.p.A.
- POSCO
- Sasol
- Shell plc
- Technip Energies N.V.
- Thyssenkrupp
- Topsoe A/S
Additional Benefits:
- The market estimate (ME) sheet in Excel format
- 3 months of analyst support
TABLE OF CONTENTS
1 Introduction
- 1.1 Study Assumptions and Market Definition
- 1.2 Scope of the Study
2 Research Methodology
3 Executive Summary
4 Market Landscape
- 4.1 Market Overview
- 4.2 Market Drivers
- 4.2.1 Surging Demand for Methanol-To-Olefins (MTO) Complexes in China
- 4.2.2 Fertilizer Capacity Additions in South Asia and Africa
- 4.2.3 Stringent Emission Norms Driving Coal-To-Gas (CTG) Projects
- 4.2.4 Carbon-Neutral Aviation Fuel Mandates (Power-To-Liquids)
- 4.2.5 Municipal-Solid-Waste Gasification for Grid-Scale Hydrogen
- 4.3 Market Restraints
- 4.3.1 US-EU Restrictions on Russian Gasification Equipment
- 4.3.2 Volatility in Coal and Natural-Gas Feedstock Pricing
- 4.3.3 Limited Bankability of Biomass Gasification Projects
- 4.4 Value Chain Analysis
- 4.5 Porter's Five Forces
- 4.5.1 Bargaining Power of Suppliers
- 4.5.2 Bargaining Power of Buyers
- 4.5.3 Threat of New Entrants
- 4.5.4 Threat of Substitutes
- 4.5.5 Degree of Competition
5 Market Size and Growth Forecasts (Volume)
- 5.1 By Feedstock
- 5.1.1 Coal
- 5.1.2 Natural Gas
- 5.1.3 Petroleum Coke
- 5.1.4 Other Feedstock Types
- 5.2 By Technology
- 5.2.1 Steam Reforming
- 5.2.2 Gasification
- 5.3 By Gasifier Type
- 5.3.1 Fixed Bed
- 5.3.2 Fluidized Bed
- 5.3.3 Entrained Flow
- 5.4 By Application
- 5.4.1 Methanol
- 5.4.2 Ammonia
- 5.4.3 Hydrogen
- 5.4.4 Liquid Fuels
- 5.4.5 Synthetic Natural Gas
- 5.4.6 Direct Reduced Iron
- 5.4.7 Electricity
- 5.4.8 Others Applications
- 5.5 By Geography
- 5.5.1 Asia-Pacific
- 5.5.1.1 China
- 5.5.1.2 India
- 5.5.1.3 Rest of Asia-Pacific
- 5.5.2 North America
- 5.5.2.1 United States
- 5.5.2.2 Canada
- 5.5.2.3 Trinidad and Tobago
- 5.5.3 Europe
- 5.5.3.1 Russia
- 5.5.3.2 Rest of Europe
- 5.5.4 South America
- 5.5.4.1 Brazil
- 5.5.4.2 Venezuela
- 5.5.4.3 Rest of South America
- 5.5.5 Middle-East and Africa
- 5.5.5.1 Saudi Arabia
- 5.5.5.2 Qatar
- 5.5.5.3 South Africa
- 5.5.5.4 Iran
- 5.5.5.5 Rest of Middle-East and Africa
- 5.5.1 Asia-Pacific
6 Competitive Landscape
- 6.1 Market Concentration
- 6.2 Strategic Moves
- 6.3 Market Share(%)/Ranking Analysis
- 6.4 Company Profiles (includes Global level Overview, Market level overview, Core Segments, Financials as available, Strategic Information, Market Rank/Share for key companies, Products and Services, and Recent Developments)
- 6.4.1 AHT Syngas Technology N.V.
- 6.4.2 Air Liquide
- 6.4.3 Air Products and Chemicals, Inc.
- 6.4.4 BASF SE
- 6.4.5 John Wood Group PLC
- 6.4.6 KBR Inc.
- 6.4.7 Linde plc
- 6.4.8 MAIRE S.p.A.
- 6.4.9 POSCO
- 6.4.10 Sasol
- 6.4.11 Shell plc
- 6.4.12 Technip Energies N.V.
- 6.4.13 Thyssenkrupp
- 6.4.14 Topsoe A/S
7 Market Opportunities and Future Outlook
- 7.1 White-space and Unmet-Need Assessment
 合成氣及其衍生物市場規模、佔有率和成長分析:按產品類型、原料類型、技術、應用、終端用戶產業和地區分類-2026-2033年產業預測
 合成氣及其衍生物市場-全球產業規模、佔有率、趨勢、競爭格局、機會及預測:依生產技術、應用、化學衍生物、消費量、地區及競爭格局分類,2021-2031年
 合成氣及其衍生市場:依衍生、原料、技術及終端應用產業分類-2026-2032年全球市場預測
 歐洲合成氣:市場佔有率分析、產業趨勢與統計、成長預測(2026-2031 年)
 合成氣市場規模、佔有率、趨勢和預測:按氣化設備類型、原料、技術、應用和地區分類,2026-2034年
 全球合成氣市場規模、佔有率、趨勢和成長分析報告(2026-2034年)合成氣市場規模、佔有率、成長及全球產業分析:按類型、應用和地區分類-2026-2034年洞察與預測
 2026年全球合成氣及衍生物市場報告合成氣市場:依原料、技術、壓力、應用和最終用途產業分類,全球預測(2026-2032年)日本合成氣市場規模、佔有率、趨勢及預測(依氣化爐類型、原料、技術、最終用途及地區分類),2026-2034年