

 |
市場調查報告書
商品編碼
2066470
農藥:市場佔有率分析、產業趨勢與統計、成長預測(2026-2031 年)Agrochemicals - Market Share Analysis, Industry Trends & Statistics, Growth Forecasts (2026 - 2031) |
||||||
※ 本網頁內容可能與最新版本有所差異。詳細情況請與我們聯繫。
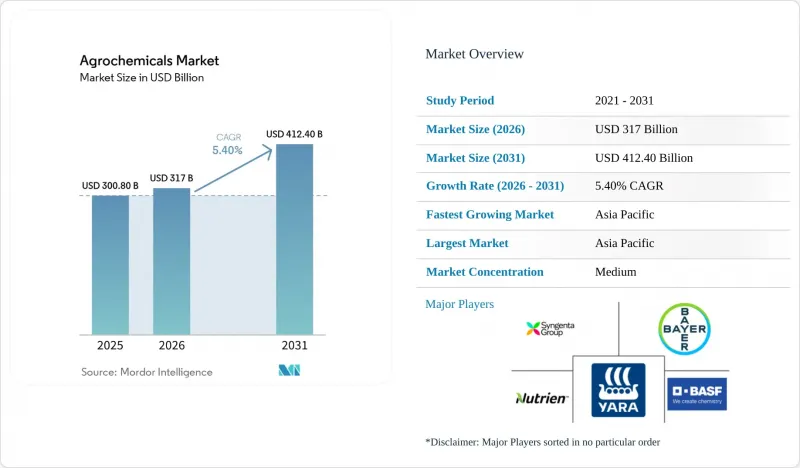
根據 Mordor Intelligence 預測,農藥市場規模預計將從 2025 年的 3,008 億美元成長到 2026 年的 3,170 億美元,預計到 2031 年將達到 4,124 億美元,預測期內複合年成長率為 5.4%。
本報告按產品類型(化肥、農藥等)、作物類型(穀物、豆類和油籽、水果和蔬菜、經濟作物等)以及地區(北美、歐洲、亞太、南美等)進行細分。市場預測以美元計價。
全球農藥市場趨勢及洞察
抗除草劑雜草的出現和病原體抗藥性的壓力
在農藥市場,由於雜草抗藥性不再侷限於單一作物種植系統,市場需求持續強勁。根據國際抗除草劑雜草資料庫(IDR)的數據,截至2026年5月,已記錄到76個國家/地區274個物種共546例獨特的抗藥性案例,其中美國138例,澳洲91例,加拿大56例。在長期輪作中廣泛使用Glyphosate和ALS抑制劑類除草劑的地區,這個問題尤其嚴重。 2024年發表的一項同行評審研究表明,除草劑組內的交叉抗性正變得日益複雜,這意味著種植者無法僅透過改變施藥順序來恢復藥效。這一趨勢預示著,在2026年,具有全新作用機制的除草劑,例如先正達的“VIRESTINA”技術、富美實的“Dodhylex”活性成分以及拜耳的“Stryax”麥草畏,將獲得更高的溢價。此外,HRAC 的 2025 年指南使人工智慧驅動的特定地點雜草管理更接近成為常規做法,除草劑的性能現在與數位偵察和可變施用工具直接相關。
精密農業及可變施肥量的推廣
農藥市場的成長不僅受銷售量提升的驅動,也得益於噴灑精準度的提升。預計到2024年,中國農業無人機的涵蓋範圍積將達到1.73億公頃,並在2025年擴大到1.78億公頃,這凸顯了精準噴灑技術在大規模農業系統中的快速普及。可變劑量噴灑技術使種植者能夠根據田間條件噴灑不同劑量的農藥,從而有助於在作物耐受性壓力不均的地區保持藥效,並支持在日益嚴格的殘留物法規下遵守相關規定。 Yara公司於2026年2月在英國推出與John Deere硬體整合的數位化平台YaraPlus,顯示主要供應商如今已將數位農藝定位為一項商業產品,而不僅僅是輔助功能。 Corteva公司2026年第一季的淨銷售額達到49億美元,年增11%。這印證了這樣一種觀點:將高品質化學品與精準噴灑相結合的策略,其表現優於整個農藥市場。事實上,精密農業可以在田間減少浪費,同時提高差異化產品的每公升或每噸利潤。
禁用活性成分並加強殘留量限制
歐洲農藥市場正面臨日益嚴峻的監管壓力。該地區的政策措施限制了多種具有重要商業性價值的活性成分的使用。近期訂定的法規,包括歐盟委員會實施條例(EU) 2025/910,撤銷了氟苯乙胺的批准,並強制分階段撤銷相關授權。此外,授權條例2024/3199將30多種物質列入出口通報要求或禁用物質清單。這些措施並非僅限於歐洲。向歐盟供應產品的出口商也必須遵守更嚴格的殘留限量,導致即使在某些市場,相同活性成分仍然獲得批准,可供選擇的農藥產品範圍也更加狹窄。因此,農藥生產商在規劃產品系列和確保產品連續性方面面臨越來越大的挑戰,尤其是那些依賴成熟化學品且替代品有限的公司。日益嚴格的法規環境增加了合規成本,延長了產品過渡期,並加劇了長期商業化策略的不確定性。因此,全球農藥市場整體正經歷創新放緩和營運複雜性增加的局面。
細分市場分析
2025年,化肥將佔據農藥市場佔有率的近75%,其中尿素、硝酸銨和尿素硝銨溶液等氮基產品仍將是亞太地區和北美糧食生產的關鍵要素。同時,植物生長調節劑預計將以13.0%的複合年成長率實現最快成長,這主要得益於市場對促進開花同步和延長果蔬保存期限的解決方案的需求不斷成長。除草劑仍將佔據農藥市場的大部分佔有率,尤其是在實施嚴格零殘留法規的地區,但助劑的重要性日益凸顯,因為它們可以在保持藥效的同時減少用量。受此趨勢的影響,科迪華農業科技公司(Corteva AgriScience)的吉貝素類植物生長調節劑ProGibb在2025年實現了強勁的銷售成長。
隨著有毒活性成分逐步淘汰以及對包衣製劑需求的成長,各公司正積極推動肥料和作物保護解決方案的整合。同時提供營養效率提升和病蟲害防治產品的製造商正在加強與銷售夥伴的關係,並透過交叉銷售擴大市場佔有率。儘管通用肥料市場波動,但這些趨勢仍能支撐盈利。此外,透過第三方檢驗展現環境績效的公司也越來越容易獲得溢價,這表明農藥市場正在轉向以永續性和價值為優先的競爭模式。
區域分析
預計到2025年,亞太地區將佔全球農藥市場佔有率的53%,並在2031年之前以6.6%的複合年成長率持續成長。中國正在進行結構性重組,到2025年,排名前十的技術製造商將佔據CR10市場53%的佔有率。 2024年,無人機噴灑農藥的面積佔全國總噴灑面積的34%。印度仍是農藥市場的重要成長引擎,2025會計年度化肥銷售額年增7.3%,糧食產量達到創紀錄的3.32億噸。 2025年,住友化學印度公司在其塔拉普爾工廠開始商業化生產氯Chlorantraniliprole胺(CTPR),並獲得了殺菌劑「Excaria Max」和「Lentigo」在印度的上市許可。此外,ICL 於 2026 年 4 月在馬哈拉斯特拉邦開設了一家特殊肥料廠,而 Coromandel International 在 2026 會計年度創下了 NPK(氮、磷、鉀)以季度為基礎產量 100 萬噸的紀錄。
非洲農藥市場的發展動力源自於化肥普及率低和巨大的增產潛力。鑑於該地區日益成長的戰略重要性,福斯農業(FosAgro)在2025年上半年將其對非洲的化肥出口量提高了三分之一,併計劃在未來五年內進一步擴大業務。在南美洲,巴西的化肥分銷量顯著成長,特種肥料的銷售額也呈現強勁成長。歐羅化學(Eurochem)於2025年3月在塞拉杜薩利特雷(Serra do Salitre)運作了一座磷肥綜合體,而OCP NutriCrops則透過在法國和印度設立新的子公司擴大了其國際企業發展。同時,北美市場預計將保持穩定成長,這主要得益於化學技術的進步、精準施肥技術的改進以及低碳氮肥計畫的實施,而非耕地面積的擴大。
在北美,農藥市場成長持續受到成熟面積和訴訟相關壓力的影響,但數位農業平台和排碳權計畫的進步正在為農藥公司創造新的服務型收入來源。在歐洲,由於「從農場到餐桌」計劃下嚴格的農藥減量目標,預計成長將保持相對溫和。然而,在碳邊境調節機制(CBAM)等監管措施的支持下,該地區在低碳肥料的推廣應用方面主導作用。同時,在中東,企業正利用具有成本競爭力的天然氣蘊藏量來加強氨的出口生產,並投資於藍氨和綠氨項目,以支持其長期永續性目標。綜上所述,這些區域趨勢表明,儘管亞太地區在農藥市場整體銷售額方面仍然佔據主導地位,但非洲和南美洲的高成長機會正日益影響全球業務擴張和投資策略。
其他好處:
- Excel格式的市場預測(ME)表
- 3個月的分析師支持
目錄
第1章:引言
- 研究假設和市場定義
- 調查範圍
第2章:調查方法
第3章執行摘要
第4章 市場狀況
- 市場概覽
- 市場促進因素
- 抗除草劑雜草的出現以及抗性病原體帶來的壓力。
- 精密農業及可變施肥量的推廣
- 緩釋肥和緩釋包膜性肥料的廣泛應用
- 將高效利用氮肥的投入物與碳排放掛鉤,以實現貨幣化。
- 擴大對專利到期的使用途徑
- 高附加價值園藝產業的整合將促進對特殊材料的需求。
- 市場限制因素
- 禁止使用活性成分,並制定更嚴格的殘留物限制。
- 重新註冊和數據包費用增加
- Glyphosate及其主要原料的價格波動
- 傳統化學物質相關的訴訟風險
- 監理情勢
- 技術展望
- 波特五力分析
第5章 市場規模與成長預測
- 依產品類型
- 肥料
- 氮基
- 磷酸鹽
- 加州
- 其他肥料
- 殺蟲劑
- 除草劑
- 殺蟲劑
- 消毒劑
- 其他農藥
- 佐劑
- 植物生長調節劑
- 肥料
- 按作物類型
- 穀物和穀類
- 豆類和油籽
- 水果和蔬菜
- 經濟作物
- 草坪和觀賞植物
- 按地區
- 北美洲
- 美國
- 加拿大
- 墨西哥
- 其他北美國家
- 歐洲
- 德國
- 法國
- 英國
- 義大利
- 西班牙
- 俄羅斯
- 其他歐洲國家
- 亞太地區
- 中國
- 印度
- 日本
- 澳洲
- 其他亞太國家
- 南美洲
- 巴西
- 阿根廷
- 其他南美國家
- 中東
- 沙烏地阿拉伯
- 阿拉伯聯合大公國
- 其他中東國家
- 非洲
- 南非
- 埃及
- 其他非洲國家
- 北美洲
第6章 競爭情勢
- 市場集中度
- 策略趨勢
- 市佔率分析
- 公司簡介
- Syngenta Group
- Bayer AG
- BASF SE
- Corteva Agriscience
- Nutrien Ltd.
- Yara International ASA
- Mosaic Company
- CF Industries Holdings Inc.
- UPL Ltd.
- FMC Corporation
- Sumitomo Chemical Co., Ltd.
- Nufarm Ltd.
- K+S Aktiengesellschaft
- ICL Group
- OCP Group
第7章 市場機會與未來展望
According to Mordor Intelligence, the agrochemicals market size is estimated to grow from USD 300.8 billion in 2025 to USD 317.0 billion in 2026, and is forecast to reach USD 412.4 billion by 2031, at a 5.4% CAGR over the forecast period.
This report is Segmented by Product Type (Fertilizers, Pesticides, and More), by Crop Type (Grains and Cereals, Pulses and Oilseeds, Fruits and Vegetables, and Commercial Crops, and More), and by Geography (North America, Europe, Asia-Pacific, South America, and More). The Market Forecasts are Provided in Terms of Value (USD).
Global Agrochemicals Market Trends and Insights
Rising Herbicide-Resistant Weeds and Resistant Pathogen Pressure
The agrochemicals market is seeing durable demand because weed resistance is no longer limited to isolated crop systems. The International Herbicide-Resistant Weed Database recorded 546 unique resistance cases involving 274 species across 76 countries as of May 2026, with the United States at 138 cases, Australia at 91, and Canada at 56. The problem is more severe in regions where glyphosate and ALS-inhibitor chemistries were used heavily across repeated crop rotations. Peer-reviewed work published in 2024 showed that cross-resistance within herbicide groups is becoming more complex, which means growers cannot rely on simple sequence changes to restore efficacy. This trend supports premium pricing for new modes-of-action herbicides, including Syngenta's VIRESTINA technology, FMC's Dodhylex active, and Bayer's Stryax dicamba for the 2026 season. The HRAC's 2025 guideline also moved AI-based site-specific weed management closer to routine practice, linking herbicide performance directly to digital scouting and variable-rate application tools.
Precision Agriculture and Variable-Rate Application Scaling
The agrochemicals market is also being supported by better application accuracy rather than by simple volume expansion. China's agricultural drone coverage reached 173 million hectares in 2024, rising to 178 million hectares in 2025, underscoring how quickly precision delivery is spreading across large farming systems. Variable-rate technology lets growers apply different doses based on field conditions, helping preserve efficacy where resistance pressure is uneven and supporting compliance as residue oversight becomes stricter. Yara's February 2026 launch of the YaraPlus digital platform in the United Kingdom, integrated with John Deere hardware, showed that major suppliers now treat digital agronomy as a commercial product rather than a support feature. Corteva's Q1 2026 net sales rose 11% year on year to USD 4.9 billion, which supports the view that premium chemistry paired with targeted application is outperforming the broader agrochemicals market. The practical outcome is that precision farming can reduce waste at the field level while still supporting higher revenue per litre or tonne for differentiated products.
Tightening Active-Ingredient Bans and Residue Limits
The agrochemicals market is facing increasing regulatory pressure in Europe, where policy actions are restricting the use of several commercially important active ingredients. Recent regulations, including Commission Implementing Regulation (EU) 2025/910, have withdrawn approval for flufenacet and mandated the phased withdrawal of related authorizations, while Delegated Regulation 2024/3199 added more than 30 substances to export notification or ban status. These measures are not limited to Europe alone, as exporters supplying the EU must also comply with stricter residue standards, reducing the range of usable agrochemical products even in markets where the same active ingredients remain approved. As a result, agrochemical companies are facing increasing challenges in portfolio planning and product continuity, particularly those relying on mature chemistries with limited replacement pipelines. The tightening regulatory environment is increasing compliance costs, extending product transition timelines, and creating uncertainty around long-term commercialization strategies, ultimately slowing innovation and raising operational complexity across the global agrochemicals market.
Other drivers and restraints analyzed in the detailed report include:
- Controlled-Release and Inhibitor-Coated Fertilizers Adoption
- Carbon-Linked Monetization for Nitrogen-Efficiency Inputs
- Re-Registration and Data-Package Costs Rising
For complete list of drivers and restraints, kindly check the Table Of Contents.
Segment Analysis
Fertilizers accounted for nearly 75% of the agrochemicals market share in 2025, with nitrogen-based products such as urea, ammonium nitrate, and UAN solutions remaining essential for cereal production across Asia-Pacific and North America. Meanwhile, plant growth regulators are projected to register the fastest growth at a CAGR of 13.0%, driven by rising demand for solutions that enhance flowering synchronization and extend the shelf life of fruits and vegetables. Herbicides continue to hold a significant share of the pesticide segment, particularly in regions with stringent zero-residue regulations, while adjuvants are gaining strategic importance due to their ability to reduce spray rates while maintaining efficacy. Reflecting this trend, Corteva Agriscience's ProGibb, a gibberellin-based regulator, recorded high revenue growth in 2025.
The increasing phase-out of toxic active ingredients and growing preference for coated formulations are encouraging companies to integrate fertilizer and crop protection solutions. Manufacturers that offer both nutrient efficiency and pest control capabilities are strengthening relationships with channel partners and expanding market share through cross-selling. These trends are supporting profitability despite volatility in commodity fertilizer cycles, while companies demonstrating environmental performance through third-party validation are increasingly securing premium pricing, signaling a shift toward sustainability- and value-driven competition in the agrochemicals market.
Geography Analysis
Asia-Pacific accounted for 53% of the agrochemicals market in 2025 and is anticipated to expand at a CAGR of 6.6% through 2031. China continues to undergo structural consolidation, with the top 10 technical producers achieving a CR10 of 53% in 2025, while drone-based crop protection applications covered 34% of the country's total spray area in 2024. India also remains a key growth engine for the agrochemicals market, supported by a 7.3% year-on-year increase in fertilizer sales in FY2025 and record food production of 332 million metric tons. In 2025, Sumitomo Chemical India Limited commenced commercial production of CTPR (Chlorantraniliprole) at its Tarapur facility and secured approvals for the Excalia Max and Lentigo fungicides in India. In addition, ICL inaugurated its specialty fertilizer plant in Maharashtra in April 2026, while Coromandel International reported record quarterly NPK (Nitrogen, Phosphorus, and Potassium) production of 1.0 million metric tons in FY2026.
Africa agrochemicals market is driven by low fertilizer penetration and significant yield-improvement potential. Reflecting the region's rising strategic importance, PhosAgro increased fertilizer exports to Africa by one-third during H1 2025 and plans to further scale operations over the next five years. In South America, Brazil's fertilizer distribution increased significantly, while special fertilizer revenues also saw strong growth. EuroChem launched its phosphate fertilizer complex in Serra do Salitre in March 2025, and OCP Nutricrops expanded its international footprint through new subsidiaries in France and India. Meanwhile, North America is anticipated to witness steady growth, supported by chemistry upgrades, precision-application technologies, and low-carbon nitrogen programs rather than agricultural acreage expansion.
In North America, the agrochemicals market growth continues to be influenced by mature farming acreage and litigation-related pressures, although advances in digital agriculture platforms and carbon-credit programs are creating new service-oriented revenue streams for agrochemical companies. Europe is projected to experience comparatively slower growth due to stringent Farm to Fork pesticide-reduction targets; however, the region is emerging as a leader in low-carbon fertilizer adoption, supported by regulatory initiatives such as the Carbon Border Adjustment Mechanism (CBAM). At the same time, the Middle East is leveraging its cost-competitive natural gas reserves to strengthen ammonia production for exports while investing in blue and green ammonia projects to support long-term sustainability objectives. Collectively, these regional trends indicate that while Asia-Pacific remains the dominant agrochemicals market by overall sales, high-growth opportunities in Africa and South America are increasingly influencing global expansion and investment strategies.
- Syngenta Group
- Bayer AG
- BASF SE
- Corteva Agriscience
- Nutrien Ltd.
- Yara International ASA
- Mosaic Company
- CF Industries Holdings Inc.
- UPL Ltd.
- FMC Corporation
- Sumitomo Chemical Co., Ltd.
- Nufarm Ltd.
- K+S Aktiengesellschaft
- ICL Group
- OCP Group
Additional Benefits:
- The market estimate (ME) sheet in Excel format
- 3 months of analyst support
TABLE OF CONTENTS
1 Introduction
- 1.1 Study Assumptions and Market Definition
- 1.2 Scope of the Study
2 Research Methodology
3 Executive Summary
4 Market Landscape
- 4.1 Market Overview
- 4.2 Market Drivers
- 4.2.1 Rising herbicide-resistant weeds and resistant pathogen pressure
- 4.2.2 Precision agriculture and variable-rate application scaling
- 4.2.3 Controlled-release and inhibitor-coated fertilizers adoption
- 4.2.4 Carbon-linked monetization for nitrogen-efficiency inputs
- 4.2.5 Expanding access to off-patent active ingredients
- 4.2.6 High-value horticulture intensity lifts specialty input demand
- 4.3 Market Restraints
- 4.3.1 Tightening active-ingredient bans and residue limits
- 4.3.2 Re-registration and data-package costs rising
- 4.3.3 Price volatility in glyphosate and key feedstocks
- 4.3.4 Litigation exposure around legacy chemistries
- 4.4 Regulatory Landscape
- 4.5 Technological Outlook
- 4.6 Porter's Five Forces Analysis
- 4.6.1 Bargaining Power of Suppliers
- 4.6.2 Bargaining Power of Buyers
- 4.6.3 Threat of New Entrants
- 4.6.4 Threat of Substitutes
- 4.6.5 Intensity of Competitive Rivalry
5 Market Size and Growth Forecasts (Value, USD)
- 5.1 By Product Type
- 5.1.1 Fertilizers
- 5.1.1.1 Nitrogenous
- 5.1.1.2 Phosphatic
- 5.1.1.3 Potassic
- 5.1.1.4 Other Fertilizers
- 5.1.2 Pesticides
- 5.1.2.1 Herbicides
- 5.1.2.2 Insecticides
- 5.1.2.3 Fungicides
- 5.1.2.4 Other Pesticides
- 5.1.3 Adjuvants
- 5.1.4 Plant Growth Regulators
- 5.1.1 Fertilizers
- 5.2 By Crop Type
- 5.2.1 Grains and Cereals
- 5.2.2 Pulses and Oilseeds
- 5.2.3 Fruits and Vegetables
- 5.2.4 Commercial Crops
- 5.2.5 Turf and Ornamental
- 5.3 By Geography
- 5.3.1 North America
- 5.3.1.1 United States
- 5.3.1.2 Canada
- 5.3.1.3 Mexico
- 5.3.1.4 Rest of North America
- 5.3.2 Europe
- 5.3.2.1 Germany
- 5.3.2.2 France
- 5.3.2.3 United Kingdom
- 5.3.2.4 Italy
- 5.3.2.5 Spain
- 5.3.2.6 Russia
- 5.3.2.7 Rest of Europe
- 5.3.3 Asia-Pacific
- 5.3.3.1 China
- 5.3.3.2 India
- 5.3.3.3 Japan
- 5.3.3.4 Australia
- 5.3.3.5 Rest of Asia-Pacific
- 5.3.4 South America
- 5.3.4.1 Brazil
- 5.3.4.2 Argentina
- 5.3.4.3 Rest of South America
- 5.3.5 Middle East
- 5.3.5.1 Saudi Arabia
- 5.3.5.2 United Arab Emirates
- 5.3.5.3 Rest of Middle East
- 5.3.6 Africa
- 5.3.6.1 South Africa
- 5.3.6.2 Egypt
- 5.3.6.3 Rest of Africa
- 5.3.1 North America
6 Competitive Landscape
- 6.1 Market Concentration
- 6.2 Strategic Moves
- 6.3 Market Share Analysis
- 6.4 Company Profiles (Includes Global Level Overview, Market Level Overview, Core Segments, Financials as Available, Strategic Information, Market Rank/Share for Key Companies, Products and Services, and Recent Developments)
- 6.4.1 Syngenta Group
- 6.4.2 Bayer AG
- 6.4.3 BASF SE
- 6.4.4 Corteva Agriscience
- 6.4.5 Nutrien Ltd.
- 6.4.6 Yara International ASA
- 6.4.7 Mosaic Company
- 6.4.8 CF Industries Holdings Inc.
- 6.4.9 UPL Ltd.
- 6.4.10 FMC Corporation
- 6.4.11 Sumitomo Chemical Co., Ltd.
- 6.4.12 Nufarm Ltd.
- 6.4.13 K+S Aktiengesellschaft
- 6.4.14 ICL Group
- 6.4.15 OCP Group
7 Market Opportunities and Future Outlook
 工業化學品市場預測至2034年-按產品類型、形態、製造流程、最終用戶、通路和地區分類的全球分析
 工業維護化學品市場規模、佔有率和趨勢分析報告:按產品、原料、最終用途、地區和細分市場分類(2026-2033 年)
 農藥添加劑:市場佔有率分析、產業趨勢與統計、成長預測(2026-2031)
 農藥市場:全球市場按產品類型、性質、作物類型、配方和應用進行預測 - 2026-2032年農藥儲槽市場:2026-2032年全球市場預測(依儲槽類型、材質、容量、運作模式、壓力類型、移動性、應用、最終用戶和通路分類)
 農藥市場規模、佔有率、趨勢和預測:按肥料類型、農藥類型、作物類型和地區分類,2026-2034年
 農藥市場:依產地、產品類型、作物類型、應用及地區分類農業化學品市場規模、佔有率和趨勢分析報告:按產品、應用、地區和細分市場分類的預測(2026-2033 年)
 全球農業化學品儲罐市場規模、佔有率、趨勢和成長分析報告(2026-2034年)
 2026年全球農藥市場報告