

 |
市場調查報告書
商品編碼
2066465
奈米材料:市場佔有率分析、產業趨勢與統計、成長預測(2026-2031)Nanomaterials - Market Share Analysis, Industry Trends & Statistics, Growth Forecasts (2026 - 2031) |
||||||
※ 本網頁內容可能與最新版本有所差異。詳細情況請與我們聯繫。
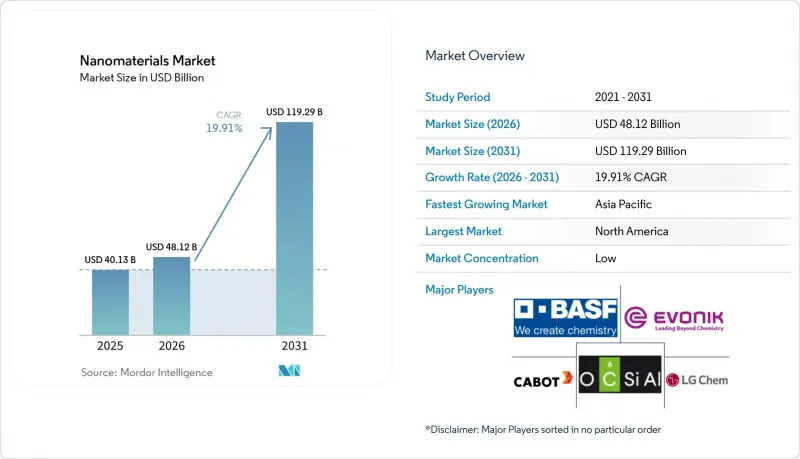
根據 Mordor Intelligence 預測,奈米材料市場規模預計將在 2025 年達到 401.3 億美元,2026 年達到 481.2 億美元,到 2031 年達到 1,192.9 億美元,2026 年至 2031 年的複合年成長率為 19.91%。
本報告按產品類型(奈米顆粒、奈米纖維、奈米管、奈米黏土、奈米線)、結構類型(非聚合物有機物和聚合物)、材料類別(碳基、金屬、金屬氧化物/陶瓷、聚合物/脂質)、終端用戶產業(建築、電子、能源等)和地區(亞太地區、北美等)進行細分。市場預測以美元計價。
全球奈米材料市場趨勢與洞察
擴大高純度奈米漿料在半導體製造的應用。
為了達到其環柵(GAA)良率目標,台積電位於亞利桑那州的工廠和三星位於德克薩斯的工廠正在轉向使用氧化鈰和氧化鋁化學機械拋光(CMP)漿料,特別是粒徑小於50奈米的漿料。同時,英特爾已批准卡博特微電子公司供應膠質氧化矽組合藥物,預計將降低缺陷密度,使其低於基準水平。美國《晶片工業產品安全法案》(CHIPS Act)包含國內採購要求,正在將採購重心轉向北美生產商,有效地分散了先前以亞洲為中心的供應鏈。不具備線上動態光散射(DLS)控制能力的供應商可能會被排除在採購範圍之外,導致訂單集中在整合供應商手中。隨著晶圓廠轉向背面供電,漿料的複雜性日益增加,特定應用等級漿料的價格溢價也不斷上升。
將奈米材料整合到mRNA疫苗平台中
2025年,Moderna擴大了其離子化和聚乙二醇化脂質的加工規模,以支持流感疫苗和聯合呼吸道疫苗的生產。同時,BioN-Tech正在透過整合連續流微流體混合器來最佳化吸收效率,從而實現即時顆粒大小的調節。輝瑞正在測試自擴增RNA(saRNA)構建體,以減少每劑脂質的使用量,從而降低每瓶管瓶的成本。目前,脂質供應鏈主要由保證供應量的「照付不議」合約控制。然而,這種合約類型對供應商構成風險,因為持續高企的膽固醇和DSPC價格可能會擠壓他們的利潤空間。從積極的一面來看,現有供應商擁有數年的前瞻性,而新參與企業將面臨越來越高的進入門檻。
重要奈米級原料的價格波動
2025年,莫三比克巴拉馬礦區遭遇颶風,導致天然鱗片石墨供應中斷,氧化石墨烯現貨價格飆升。同時,由於中國冶煉廠為因應更嚴格的環保法規而減產,四氯化鈦價格也大幅上漲。此外,用於氧化鈰漿料的稀土元素氧化物出口許可證限制也導致價格劇烈波動。沒有長期承購合約的加工商難以維持利潤率。作為一項策略性舉措,BASF收購了一家加拿大石墨開發公司的少數股權,以確保原物料供應穩定。此類上游整合策略雖然降低了對波動劇烈的現貨市場的風險敞口,但也增加了資本需求。
細分市場分析
預計到2025年,奈米顆粒將佔奈米材料市場銷售額的66.78%。這反映出市場對二氧化鈦基防曬油、二氧化矽增強型汽車塗料和氧化鋁填料的強勁需求。金和銀等奈米金屬正助力皮莫耳級生物標記檢測的診斷技術。就產量而言,非金屬氧化物佔市場主導地位。BASF位於路德維希港的工廠透過生產氣相二氧化矽(主要用於輪胎增強材料)展現了規模經濟效益。同時,鈦酸鋰等複合氧化物在固態電池領域取得了顯著進展,為深圳和首爾的公車充電提供了解決方案。
多壁奈米碳管被應用於電動車溫度控管系統和5G天線陣列中作為電磁干擾屏蔽材料,預計到2031年,奈米管市場將以21.43%的複合年成長率成長。 OCSiAl公司已提高單壁奈米碳管的產量,將其作為電池添加劑以延長電池循環壽命。同時,奈米纖維、奈米黏土和奈米線分別被應用於過濾、包裝和透明導電領域,但就銷售而言,它們仍屬於小眾市場。符合ISO 10808標準的顆粒表徵正逐漸成為準入標準,這為擁有先進分析能力的供應商帶來了競爭優勢。
到2025年,非聚合物有機奈米材料將佔據55.12%的市場佔有率,這主要得益於用於低滾動阻力輪胎的炭黑和使用奈米碳管的導電添加劑。適體在即時診斷領域也取得了進展,獲得CE認證的COVID-19檢測試劑盒預計將於2025年初上市。目前,旗艦智慧型手機正在採用利用銥配合錯合的低分子量OLED發光元件,以實現高量子效率。
受奈米二氧化矽耐刮擦塗層和高效CRISPR-Cas9轉染試劑需求的推動,聚合物級產品預計將以20.05%的複合年成長率成長。 2024年,利用量子點的診斷劑取得了突破性成果,只需一份血清樣本即可進行12項參數的免疫檢測。在製藥業, Doxil和Abraxane處於領先地位,人們越來越關注使用脂質體和樹狀聚合物的藥物遞送系統。在歐洲一系列新型除生物劑的提案中,先前依賴銀奈米粒子的紡織加工產業正在轉向氧化鋅基替代品。同時,在利潤豐厚的光學和介電薄膜細分市場,獲得ISO 14001認證正成為一項策略採購優勢。
區域分析
預計到2025年,北美將佔全球銷售額的38.78%,這主要得益於台積電和英特爾在亞利桑那州的晶圓廠(這兩家公司每年共同使用奈米漿料)以及輝瑞莫德納的脂質體生產網路,後者得到了CHIPS和BARDA獎勵的支持。加拿大NanoXplore計劃擴大石墨烯的生產,用於汽車和建築複合材料;墨西哥蒙特雷走廊則聚集了一系列奈米塗層生產線,為德克薩斯州的超級工廠提供服務。美國環保署(EPA)預計於2026年中期最終確定奈米材料報告規則,強制要求揭露相關資訊。這可能會給小規模生產商帶來負擔,但也會提高市場透明度。
亞太地區預計將以22.32%的複合年成長率成長,這主要得益於中國在石墨烯和奈米管領域的積極擴張。特別是,江蘇康諾預計到2026年將提高其多壁奈米碳管的產量。同時,在日本,三菱化學和住友化學等大型企業正在鞏固其在OLED發光材料領域的領先地位。韓國巨頭LG化學和三星SDI正在將矽奈米線負極材料應用於下一代電池。在印度,奈米二氧化鈦生產商正在擴大生產,以滿足油漆和防曬油的激增需求。在東南亞國協,特別是越南,在電子產業外商直接投資的推動下,用於供水的氧化石墨烯薄膜試點計畫正在進行中。
在歐洲,嚴格的REACH預註冊制度已初見成效,BASF、贏創和瓦克等老牌巨頭從中受益。這三家公司佔據了特種奈米材料市場的重要佔有率。在英國,Versalian和義大利的Direkta Plus正在擴大石墨烯的生產,用於複合材料應用。法國的阿科瑪在富勒烯基有機太陽能電池材料的商業化方面取得了顯著進展。南美洲仍處於起步階段,巴西正在進行奈米黏土水泥示範項目,用於聖保羅地鐵系統的擴建。以沙烏地阿拉伯延布鈦白粉聯合企業為首的中東地區,正透過利用氣基四氯化鈦生產路線,將自身打造成為一個經濟高效的前驅生產中心。
其他好處:
- Excel格式的市場預測(ME)表
- 3個月的分析師支持
目錄
第1章:引言
- 研究假設和市場定義
- 調查範圍
第2章:調查方法
第3章執行摘要
第4章 市場狀況
- 市場概覽
- 市場促進因素
- 半導體製造業的擴張推動了對高純度奈米漿料的需求。
- 奈米材料在mRNA疫苗平台的應用日益廣泛
- 利用奈米技術的水處理系統迅速普及
- 奈米結構電極的應用推動電動車電池產量快速成長
- 歐盟CBAM推廣使用奈米黏土的低碳水泥。
- 市場限制因素
- 重要奈米級原料的價格波動
- 精密合成(例如ALD反應器)的高額資本投入
- 由於新的EHS法規(歐盟和加拿大)導致批准延誤
- 價值鏈分析
- 波特五力模型
第5章 市場規模與成長預測
- 依產品類型
- 奈米顆粒
- 奈米金屬
- 金子
- 銀
- 鉑
- 鈦
- 鋁
- 非金屬氧化物
- 氧化鋁
- 氧化鐵
- 氧化鈦
- 二氧化矽
- 氧化鋅
- 複合氧化物
- 磷酸鈣
- 稀土元素氧化物
- 鈦酸鋰
- 矽氫化物
- 奈米金屬
- 奈米纖維
- 奈米管
- 奈米黏土
- 奈米線
- 奈米顆粒
- 依結構類型
- 非聚合物有機奈米材料
- 炭黑
- 奈米碳管
- 適體
- 低分子OLED材料
- 活性碳
- 奈米碳管複合材料
- 聚合物奈米材料
- 油漆和黏合劑
- 轉染試劑
- 診斷試劑
- 藥物輸送載體
- 紡織加工
- 光學鍍膜
- 奈米多孔過濾膜
- 介電膜
- OLED薄膜
- 非聚合物有機奈米材料
- 按材料類別
- 碳基
- 金屬
- 金屬氧化物和陶瓷
- 聚合物和脂質體系
- 按最終用戶行業分類
- 建造
- 電子設備
- 能源
- 衛生保健
- 個人護理
- 橡皮
- 其他終端用戶產業
- 按地區
- 亞太地區
- 中國
- 印度
- 日本
- 韓國
- ASEAN
- 其他亞太國家
- 北美洲
- 美國
- 加拿大
- 墨西哥
- 歐洲
- 德國
- 英國
- 義大利
- 法國
- 其他歐洲國家
- 南美洲
- 巴西
- 阿根廷
- 其他南美國家
- 中東和非洲
- 沙烏地阿拉伯
- 南非
- 其他中東和非洲國家
- 亞太地區
第6章 競爭情勢
- 市場集中度
- 策略趨勢
- 市佔率和排名分析
- 公司簡介
- ACS Material
- American Elements
- Arkema
- Ascensus
- BASF SE
- Cabot Corporation
- Chasm Advanced Materials, Inc.
- Evonik Industries AG
- Jiangsu Cnano Technology Co., Ltd.
- LG Chem
- Merck KGaA
- Nano-C
- Nanocyl SA
- NAWAH
- OCSiAl
- QuantumSphere, Inc.
- Raymor Industries Inc.
- Resonac Holdings Corporation
- Solesence
- US Research Nanomaterials, Inc.
- Zyvex Technologies
第7章 市場機會與未來展望
According to Mordor Intelligence, the nanomaterials market size is projected to be USD 40.13 billion in 2025, USD 48.12 billion in 2026, and reach USD 119.29 billion by 2031, growing at a CAGR of 19.91% from 2026 to 2031.
This report is Segmented by Product Type (Nanoparticles, Nanofibers, Nanotubes, Nanoclays, and Nanowires), Structure Type (Non-Polymer Organic and Polymeric), Material Category (Carbon-Based, Metal-Based, Metal-Oxide/Ceramic, and Polymeric/Lipid), End-User Industry (Construction, Electronics, Energy, and More), and Geography (Asia-Pacific, North America, and More). Market Forecasts are Provided in Value (USD).
Global Nanomaterials Market Trends and Insights
Semiconductor Fabs Scaling High-Purity Nano-Slurries
TSMC's Arizona and Samsung's Texas fabs are turning to ceria and alumina CMP slurries, specifically those with sub-50 nm particle sizes, to achieve gate-all-around yield targets. Meanwhile, Intel has greenlit Cabot Microelectronics to provide colloidal-silica formulations, which promise a reduction in defect density compared to benchmarks. The U.S. CHIPS Act, with its domestic-content clauses, is steering procurement towards North American producers, effectively fragmenting the previously Asia-centric supply chain. Vendors lacking inline dynamic-light-scattering controls face disqualification, leading to a concentration of orders with integrated suppliers. As fabs shift towards backside-power delivery, the rising complexity of slurries is driving price premiums for application-engineered grades.
Integration of Nanomaterials in mRNA-Vaccine Platforms
In 2025, Moderna ramped up its processing of ionizable and PEGylated lipids to support flu and combination respiratory vaccines. Meanwhile, BioNTech has integrated continuous-flow microfluidic mixers, enabling real-time adjustments of particle sizes to optimize uptake. Pfizer is testing self-amplifying RNA constructs, which utilize less lipid per dose, translating to a cost reduction per vial. The lipid supply chain is now largely governed by take-or-pay contracts, ensuring guaranteed volumes. However, this arrangement poses a risk for suppliers, as they might face margin compression if prices for cholesterol and DSPC remain high. The silver lining? Established vendors gain multi-year visibility, while newcomers face heightened entry barriers.
Volatile Prices of Critical Nanoscale Feedstocks
In 2025, cyclone damage at Mozambique's Balama mine disrupted the supply of natural-flake graphite, leading to a sharp rise in graphene-oxide spot prices. Simultaneously, costs for titanium tetrachloride surged as Chinese smelters, responding to tightened environmental quotas, curtailed their output. Additionally, export-license restrictions on rare-earth oxides, commonly used in cerium-oxide slurries, resulted in significant price fluctuations. Converters, lacking long-term offtake agreements, find it challenging to safeguard their margins. In a strategic move, BASF acquired a minority stake in a Canadian graphite developer, aiming to secure a steady feedstock. While such forward-integration strategies mitigate exposure to volatile spot markets, they also come with heightened capital demands.
Other drivers and restraints analyzed in the detailed report include:
- Rapid Adoption of Nano-Enabled Water Treatment Systems
- EV Battery Production Using Nano-Structured Electrodes
- High CAPEX for Precision Synthesis Equipment
For complete list of drivers and restraints, kindly check the Table Of Contents.
Segment Analysis
Nanoparticles accounted for 66.78% of 2025 revenue within the nanomaterials market, reflecting entrenched demand for titanium-dioxide sunscreens, silica-reinforced automotive coatings, and alumina fillers. Nanometals such as gold and silver underpin diagnostics that detect biomarkers at picomolar levels. By volume, non-metal oxides lead the market. BASF's Ludwigshafen complex showcased its scale economies by producing fumed silica, primarily for tire reinforcement. Meanwhile, complex oxides, such as lithium titanate, are making strides in solid-state batteries, enabling bus charges in both Shenzhen and Seoul.
Nanotubes are poised for a 21.43% CAGR to 2031 as EV thermal-management systems and 5G antenna arrays embed multi-walled carbon nanotubes for EMI shielding. OCSiAl ramped up its production of single-walled nanotubes, providing battery additives that enhance cycle life. While nanofibers, nanoclays, and nanowires find applications in filtration, packaging, and as transparent conductors, respectively, each remains a niche in terms of value. Compliance with ISO 10808 particle characterization is emerging as a standard entry requirement, giving an edge to vendors equipped with advanced analytics.
Non-polymer organic nanomaterials held 55.12% share in 2025, led by carbon black for low-rolling-resistance tires and carbon-nanotube conductive additives. Aptamers advanced in point-of-care diagnostics, with CE-marked COVID-19 detection kits launched in early 2025. Flagship smartphones now boast small-molecule OLED emitters, harnessing iridium complexes, achieving high quantum efficiencies.
Polymeric grades are set to expand at a 20.05% CAGR, riding demand for nano-silica scratch-resistant coatings and high-efficiency CRISPR-Cas9 transfection reagents. In 2024, diagnostic reagents leveraging quantum dots achieved a milestone, facilitating 12-plex immunoassays from just one serum sample. The pharmaceutical industry has increasingly focused on liposomal and dendrimer drug-delivery vehicles, with Doxil and Abraxane leading the charge. Amidst emerging European biocide proposals, fabric treatments previously reliant on silver nanoparticles are now shifting focus to zinc oxide alternatives. Meanwhile, in the realm of optical and dielectric films, a high-margin niche, securing an ISO 14001 certification has become a strategic procurement advantage.
Geography Analysis
North America contributed 38.78% of 2025 sales, anchored by Arizona's TSMC and Intel fabs that together use nano-slurries annually and by Pfizer-Moderna lipid networks supported by the CHIPS Act and BARDA incentives. Canada's NanoXplore plans to scale graphene output for automotive and construction composites, while Mexico's Monterrey corridor attracts nano-coating lines serving Gigafactory Texas. The U.S. Environmental Protection Agency expects to finalize a nanomaterial reporting rule in mid-2026, mandating disclosure, which may burden smaller producers but increase market transparency.
Asia-Pacific is projected to deliver a 22.32% CAGR, fueled by China's aggressive expansions in graphene and nanotubes. Notably, Jiangsu Cnano is on track to boost its multi-walled nanotube output by 2026. Meanwhile, Japan solidifies its dominance in OLED emitters, thanks to key players like Mitsubishi Chemical and Sumitomo Chemical. South Korea's giants, LG Chem and Samsung SDI, are integrating silicon-nanowire anodes into next-gen batteries. In India, producers of nano-titanium dioxide are ramping up production to cater to the surging demand in paints and sunscreens. ASEAN nations, with Vietnam at the forefront, are piloting graphene-oxide membranes for municipal water, bolstered by foreign direct investment in electronics.
Europe reaps the rewards of stringent REACH pre-registration, a move that benefits established players like BASF, Evonik, and Wacker, who together account for a significant share of the specialty-nanomaterial revenue. In the UK, Versarien and Italy's Directa Plus are scaling up graphene for composite applications. France's Arkema is making strides by commercializing fullerene-based organic photovoltaic materials. South America is still in its nascent stages, with Brazil experimenting with nano-clay cement for the metro expansion in Sao Paulo. The Middle East, spearheaded by Saudi Arabia's Yanbu titanium dioxide complex, is carving out a niche as a cost-effective precursor hub, capitalizing on gas-based titanium tetrachloride production routes.
- ACS Material
- American Elements
- Arkema
- Ascensus
- BASF SE
- Cabot Corporation
- Chasm Advanced Materials, Inc.
- Evonik Industries AG
- Jiangsu Cnano Technology Co., Ltd.
- LG Chem
- Merck KGaA
- Nano-C
- Nanocyl SA
- NAWAH
- OCSiAl
- QuantumSphere, Inc.
- Raymor Industries Inc.
- Resonac Holdings Corporation
- Solesence
- US Research Nanomaterials, Inc.
- Zyvex Technologies
Additional Benefits:
- The market estimate (ME) sheet in Excel format
- 3 months of analyst support
TABLE OF CONTENTS
1 Introduction
- 1.1 Study Assumptions and Market Definition
- 1.2 Scope of the Study
2 Research Methodology
3 Executive Summary
4 Market Landscape
- 4.1 Market Overview
- 4.2 Market Drivers
- 4.2.1 Expansion of semiconductor fabs driving high-purity nano-slurries
- 4.2.2 Rising integration of nanomaterials in mRNA-vaccine platforms
- 4.2.3 Rapid adoption of nano-enabled water treatment systems
- 4.2.4 Surge in EV battery production using nano-structured electrodes
- 4.2.5 EU CBAM incentivising nano-clay low-carbon cement
- 4.3 Market Restraints
- 4.3.1 Volatile prices of critical nanoscale feedstocks
- 4.3.2 High CAPEX for precision synthesis (ALD reactors, etc.)
- 4.3.3 Emerging EHS rules delaying approvals (EU and Canada)
- 4.4 Value Chain Analysis
- 4.5 Porter's Five Forces
- 4.5.1 Bargaining Power of Suppliers
- 4.5.2 Bargaining Power of Buyers
- 4.5.3 Threat of New Entrants
- 4.5.4 Threat of Substitutes
- 4.5.5 Competitive Rivalry
5 Market Size and Growth Forecasts (Value)
- 5.1 By Product Type
- 5.1.1 Nanoparticles
- 5.1.1.1 Nanometals
- 5.1.1.1.1 Gold
- 5.1.1.1.2 Silver
- 5.1.1.1.3 Platinum
- 5.1.1.1.4 Titanium
- 5.1.1.1.5 Aluminium
- 5.1.1.2 Non-metal Oxides
- 5.1.1.2.1 Alumina
- 5.1.1.2.2 Iron Oxide
- 5.1.1.2.3 Titanium Oxide
- 5.1.1.2.4 Silica
- 5.1.1.2.5 Zinc Oxide
- 5.1.1.3 Complex Oxides
- 5.1.1.3.1 Calcium Phosphate
- 5.1.1.3.2 Rare-earth Metal Oxides
- 5.1.1.3.3 Lithium Titanate
- 5.1.1.3.4 Silica Hydride
- 5.1.1.1 Nanometals
- 5.1.2 Nanofibers
- 5.1.3 Nanotubes
- 5.1.4 Nanoclays
- 5.1.5 Nanowires
- 5.1.1 Nanoparticles
- 5.2 By Structure Type
- 5.2.1 Non-polymer Organic Nanomaterials
- 5.2.1.1 Carbon Black
- 5.2.1.2 Carbon Nanotubes
- 5.2.1.3 Aptamers
- 5.2.1.4 Small-molecule OLED Materials
- 5.2.1.5 Activated Carbon
- 5.2.1.6 Carbon Nanotube Composites
- 5.2.2 Polymeric Nanomaterials
- 5.2.2.1 Coatings and Adhesives
- 5.2.2.2 Transfection Reagents
- 5.2.2.3 Diagnostic Reagents
- 5.2.2.4 Drug-delivery Vehicles
- 5.2.2.5 Fabric Treatments
- 5.2.2.6 Optical Coatings
- 5.2.2.7 Nano-porous Filtration Membranes
- 5.2.2.8 Dielectric Films
- 5.2.2.9 OLED Films
- 5.2.1 Non-polymer Organic Nanomaterials
- 5.3 By Material Category
- 5.3.1 Carbon-based
- 5.3.2 Metal-based
- 5.3.3 Metal-oxide and Ceramic-based
- 5.3.4 Polymeric and Lipid-based
- 5.4 By End-user Industry
- 5.4.1 Construction
- 5.4.2 Electronics
- 5.4.3 Energy
- 5.4.4 Healthcare
- 5.4.5 Personal Care
- 5.4.6 Rubber
- 5.4.7 Other End-user Industries
- 5.5 By Geography
- 5.5.1 Asia-Pacific
- 5.5.1.1 China
- 5.5.1.2 India
- 5.5.1.3 Japan
- 5.5.1.4 South Korea
- 5.5.1.5 ASEAN
- 5.5.1.6 Rest of Asia-Pacific
- 5.5.2 North America
- 5.5.2.1 United States
- 5.5.2.2 Canada
- 5.5.2.3 Mexico
- 5.5.3 Europe
- 5.5.3.1 Germany
- 5.5.3.2 United Kingdom
- 5.5.3.3 Italy
- 5.5.3.4 France
- 5.5.3.5 Rest of Europe
- 5.5.4 South America
- 5.5.4.1 Brazil
- 5.5.4.2 Argentina
- 5.5.4.3 Rest of South America
- 5.5.5 Middle-East and Africa
- 5.5.5.1 Saudi Arabia
- 5.5.5.2 South Africa
- 5.5.5.3 Rest of Middle-East and Africa
- 5.5.1 Asia-Pacific
6 Competitive Landscape
- 6.1 Market Concentration
- 6.2 Strategic Moves
- 6.3 Market Share/Ranking Analysis
- 6.4 Company Profiles (includes Global Overview, Market-level Overview, Core Segments, Financials, Strategic Information, Products and Services, and Recent Developments)
- 6.4.1 ACS Material
- 6.4.2 American Elements
- 6.4.3 Arkema
- 6.4.4 Ascensus
- 6.4.5 BASF SE
- 6.4.6 Cabot Corporation
- 6.4.7 Chasm Advanced Materials, Inc.
- 6.4.8 Evonik Industries AG
- 6.4.9 Jiangsu Cnano Technology Co., Ltd.
- 6.4.10 LG Chem
- 6.4.11 Merck KGaA
- 6.4.12 Nano-C
- 6.4.13 Nanocyl SA
- 6.4.14 NAWAH
- 6.4.15 OCSiAl
- 6.4.16 QuantumSphere, Inc.
- 6.4.17 Raymor Industries Inc.
- 6.4.18 Resonac Holdings Corporation
- 6.4.19 Solesence
- 6.4.20 US Research Nanomaterials, Inc.
- 6.4.21 Zyvex Technologies
7 Market Opportunities and Future Outlook
- 7.1 White-space and Unmet-need Assessment
 先進奈米材料市場預測至2034年-按材料類型、產品、尺寸、製造流程、應用、最終用戶和地區分類的全球分析奈米材料添加劑市場預測至2034年—按奈米材料類型、功能、應用、最終用戶和地區分類的全球分析全球奈米材料塗層市場預測至2034年:按產品類型、基材、應用和地區分類
 奈米材料市場:按類型、合成技術、形狀、應用和最終用途產業分類-全球市場預測(2026-2032 年)奈米多孔材料市場:按材料類型、孔徑、製造方法、形狀、應用和最終用途產業分類-2026-2032年全球市場預測奈米薄膜市場:按類型、材料、厚度、形成技術和應用分類-2026-2032年全球市場預測奈米銀市場:2026-2032年全球市場預測(依產品類型、合成方法、應用及通路分類)
 奈米化學品市場規模、佔有率、趨勢和預測:按類型、應用和地區分類,2026-2034年奈米材料市場規模、佔有率、趨勢和預測:按產品類型、結構類型、最終用途產業和地區分類,2026-2034年
 2026年全球智慧奈米建築材料市場報告