


 |
市場調查報告書
商品編碼
2066430
北美液體肥料市場:市場佔有率分析、產業趨勢與統計及成長預測(2026-2031 年)North America Liquid Fertilizers - Market Share Analysis, Industry Trends & Statistics, Growth Forecasts (2026 - 2031) |
||||||
※ 本網頁內容可能與最新版本有所差異。詳細情況請與我們聯繫。
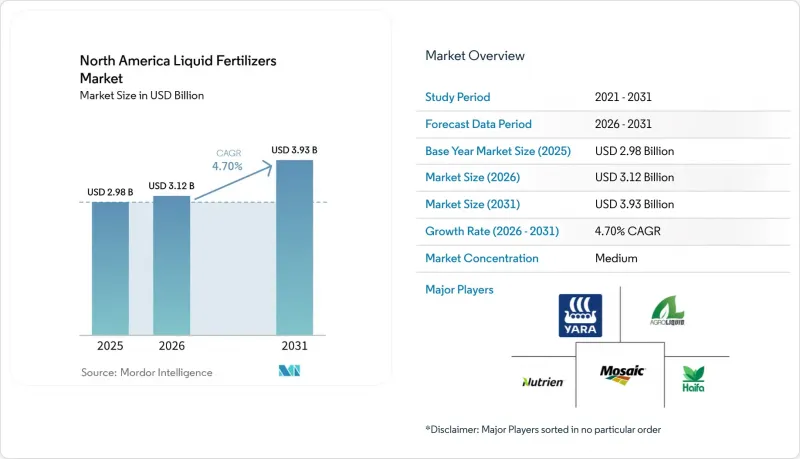
根據 Mordor Intelligence 預測,北美液態肥料市場規模將從 2025 年的 29.8 億美元和 2026 年的 31.2 億美元成長到 2031 年的 39.3 億美元,2026 年至 2031 年的複合年成長率為 4.70%。
本報告按營養素類型(氮、鉀、磷、微量元素)、成分類型(有機和合成)、施用方法(底肥溶液、葉面噴布、施肥和灌溉等)、作物類型(穀物、豆類和油籽等)以及地區(美國、加拿大等)進行分類。市場預測以美元(USD)計價。
北美液體肥料市場趨勢及洞察
精密農業的日益普及正在加速對液態肥料的需求。
美國玉米帶和草原省份約40%的大型農場已採用變數施肥器,這種施肥器比顆粒肥料能更精確地計量液態肥料。在美國和加拿大的水資源管理區,尤其是水果、蔬菜和特殊穀物等高價值作物的種植中,施肥和灌溉的應用日益廣泛。液態肥料可與滴灌和中心支軸式噴灌系統相容,實現灌溉和養分輸送的同步進行。這種方法提高了養分利用效率,同時減少了施肥次數,從而降低了燃料成本。
在緩解水資源短缺的計畫中,向施肥和灌溉過渡
加州的《地下水法案》以及亞利桑那州和德克薩斯州的類似法規,正迫使種植者轉向使用依賴水溶性液態肥料的滴灌和微灌系統。多次少量施肥,並根據作物的吸收曲線進行精準施肥,可以減少養分淋溶和揮發。德克薩斯州高平原地區的轉變使得液態肥料的銷售量在2024年至2025年間實現了兩位數的成長。亞利桑那州的蔬菜農場報告稱,在從顆粒肥料轉向液態肥料後,氮肥用量減少了25%至30%。隨著監管合規期限的臨近,向化肥灌溉的轉型對許多種植者來說變得至關重要。由美國農業部自然資源保護局(USDA NRCS)等機構支持的州和聯邦保護項目,為開發滴灌和微灌基礎設施提供財政援助。這些補貼降低了種植者的初始投資成本,提高了化肥灌溉系統及相關液態肥料的成本效益,同時也有助於提高用水效率並遵守養分管理法規。
腐蝕性物質處理和儲存基礎設施的成本
處理尿素硝酸銨 (UAN) 和聚磷酸銨需要不銹鋼儲存槽和耐腐蝕泵,這使得其資本投資成本比乾式儲存方案高出近一倍。額外的二級防護設備成本也阻礙了小規模經銷商儲備液態肥料,從而限制了農村地區的服務覆蓋範圍。在液態肥料系統中,特別是使用尿素硝酸銨 (UAN) 的系統中,其腐蝕性會加速密封件、閥門、軟管和幫浦零件的磨損。與乾式肥料處理系統相比,這會導致更頻繁的更換、關鍵施肥期更長的運作以及更高的營運成本。
細分市場分析
到2025年,氮肥將成為該細分市場的主要驅動力,佔據北美液體肥料市場54%的佔有率。這主要得益於玉米和小麥的面積種植,而尿素硝酸銨(UAN)非常適合作為追肥施用。美國和加拿大玉米、小麥和大豆的面積持續推動對氮肥,尤其是液體肥料的巨大需求,因為液體肥料能夠迅速被土壤吸收,並且與各種施肥系統和灌溉施肥系統高度相容。
受美國中西部北部鈣質土壤中鐵和鋅缺乏問題的推動,預計到2031年,微量元素市場將以7.1%的複合年成長率成長。種植者對數位化農化工具和土壤檢測平台的採用,推動了對鋅、鐵、錳和硼等微量元素定向施用需求的成長。與通用氮肥不同,微量元素和客製化液體肥料的每加侖價格更高,這提高了供應商的盈利,並鼓勵企業投資研發和定製配方。
到2025年,合成複合肥料將佔北美液體肥料市場72%的佔有率,成為最大的細分市場。然而,由於通用肥料已廣泛應用於種植面積,其成長速度較為溫和。尿素硝酸銨(UAN)、聚磷酸銨和硝酸鉀等合成液體肥料因其能以易溶形式提供高濃度養分而被廣泛應用。其可預測的營養成分使種植者能夠精確調整施肥量以滿足作物需求,因此特別適用於大規模穀物生產。此外,合成液體肥料與變數施肥系統和灌溉施肥系統配合使用效果更佳,進一步鞏固了其在現代北美農業中的地位。
受認證機構和溫室蔬菜種植者(他們必須遵守美國國家有機計劃 (NOP))的需求推動,有機液體肥料預計到 2031 年將以 8.1% 的複合年成長率成長。源自植物、動物或微生物的有機液體肥料正擴大應用於水果、蔬菜和特種作物的種植。這些肥料在改善土壤健康和微生物活性的同時,也符合監管機構和消費者追求的永續性目標。高價值作物的種植者尤其青睞有機液體肥料,因為它們能夠精準地提供必需營養素,且不留任何合成殘留物,從而兼顧產品品質和環境永續性。
其他好處:
- Excel格式的市場預測(ME)表
- 3個月的分析師支持
目錄
第1章:引言
- 研究假設和市場定義
- 調查範圍
第2章:調查方法
第3章執行摘要
第4章 市場狀況
- 市場概覽
- 市場促進因素
- 精密農業的引進正在加速對液態肥料的需求。
- 在緩解水資源短缺的計畫中,向施肥和灌溉過渡
- 一級供應商推出針對特定作物的液體混合物
- 政府獎勵措施促進國內化肥生產能力
- 引入無人機空中噴灑和葉面噴布
- 可控制環境農業中心的發展
- 市場限制因素
- 腐蝕性物質處理和儲存基礎設施的成本
- 天然氣原物料價格波動
- 全氟烷基和多氟烷基物質(PFAS)以及針對新興污染物的監管壓力
- 生物增強液體的低溫運輸限制
- 監理情勢
- 技術展望
- 波特五力分析
第5章 市場規模與成長預測
- 營養類型
- 氮
- 鉀
- 磷酸鹽
- 微量營養素
- 依成分類型
- 有機的
- 合成
- 透過應用方法
- 啟動液
- 葉面噴布
- 施肥和灌溉
- 注入土壤
- 空中噴灑和無人機噴灑
- 按作物類型
- 穀物和穀類
- 豆類和油籽
- 經濟作物
- 水果和蔬菜
- 草坪和觀賞植物
- 按地區
- 美國
- 加拿大
- 墨西哥
- 其他北美國家
第6章 競爭情勢
- 市場集中度
- 策略趨勢
- 市佔率分析
- 公司簡介
- The Mosaic Company
- CF Industries Holdings Inc.
- AgroLiquid
- Haifa Group
- Kugler Company
- Sociedad Quimica y Minera de Chile SA
- EuroChem Group AG
- K+S Aktiengesellschaft
- Triangle CC
- Yara International ASA
- Helena Agri-Enterprises
- Tessenderlo Group
- Brandt Consolidated Inc.
- Grupa Azoty SA
- Nufarm Limited
第7章 市場機會與未來展望
According to Mordor Intelligence, the north america liquid fertilizers market size is projected to expand from USD 2.98 billion in 2025 and USD 3.12 billion in 2026 to USD 3.93 billion by 2031, registering a 4.70% CAGR between 2026 and 2031.
This report is Segmented by Nutrient Type (Nitrogen, Potassium, Phosphate, and Micronutrients), by Ingredient Type (Organic and Synthetic), by Mode of Application (Starter Solution, Foliar Application, Fertigation, and More), by Crop Type (Grains and Cereals, Pulses and Oilseeds, and More), and by Geography (United States, Canada, and More). The Market Forecasts are Provided in Terms of Value (USD).
North America Liquid Fertilizers Market Trends and Insights
Precision-Agriculture Adoption Accelerates Demand for Liquid Nutrients
Variable-rate equipment covers around 40% of large farms across the Corn Belt and Prairie Provinces, allowing liquids to be metered more precisely than granules. The adoption of fertigation in high-value crops, such as fruits, vegetables, and specialty grains, is rising, particularly in water-managed regions of the United States and Canada. Liquid fertilizers are compatible with drip and pivot irrigation systems, allowing for simultaneous irrigation and nutrient delivery. This approach enhances nutrient-use efficiency while reducing the number of application passes and associated fuel costs.
Shift to Fertigation Under Water-Scarcity Programs
California's groundwater law and similar rules in Arizona and Texas push growers toward drip and micro-irrigation that rely on soluble liquids. Multiple small fertigation doses follow crop uptake curves, cutting leaching losses and volatilization. Texas High Plains conversions lifted regional liquid sales by double digits in 2024-2025. Arizona vegetable farms documented nitrogen savings of 25% to 30% after switching from broadcast granules. Compliance deadlines make fertigation a non-negotiable transition for many producers. State and federal conservation programs, supported by agencies such as the United States Department of Agriculture Natural Resources Conservation Service (USDA NRCS), offer financial assistance for drip and micro-irrigation infrastructure. These subsidies help lower initial capital costs for growers, making fertigation systems and their associated liquid fertilizers more cost-effective while supporting objectives for water-use efficiency and nutrient management compliance.
Corrosive Handling and Storage Infrastructure Costs
Urea Ammonium Nitrate (UAN) and ammonium polyphosphate require stainless tanks and corrosion-resistant pumps, which roughly doubles capex compared to dry storage solutions. Secondary containment adds further expense, discouraging small dealers from stocking liquids and limiting rural service density. Liquid fertilizer systems, particularly those using Urea Ammonium Nitrate (UAN), accelerate wear on seals, valves, hoses, and pump components due to their corrosive properties. This results in more frequent replacements, increased downtime during critical application periods, and higher operating costs compared to dry fertilizer handling systems.
Other drivers and restraints analyzed in the detailed report include:
- Crop-Specific Liquid Blends Launched by Tier 1 Suppliers
- Adoption of Aerial and Drone Foliar Spraying
- Cold-Chain Constraints for Biologically Enhanced Liquids
For complete list of drivers and restraints, kindly check the Table Of Contents.
Segment Analysis
Nitrogen led the segment with 54% of the North America liquid fertilizers market share in 2025, supported by large corn and wheat acreages that favor sidedress Urea Ammonium Nitrate (UAN) . Corn, wheat, and soybean acreage in the United States and Canada continues to drive significant demand for nitrogen fertilizers, particularly in liquid form, due to their quick soil absorption and compatibility with variable-rate application and fertigation systems.
Micronutrients are forecast to grow at a 7.1% CAGR through 2031, spurred by iron and zinc deficiencies across calcareous soils in the upper Midwest. The adoption of digital agronomy tools and soil-testing platforms by growers has increased demand for targeted micronutrient applications, such as zinc, iron, manganese, and boron. Unlike commodity nitrogen fertilizers, micronutrients and custom liquid blends are priced higher per gallon, providing suppliers with improved profitability and encouraging investment in research and development as well as customized formulations.
Synthetic formulations held the largest segment, 72% of the North America liquid fertilizers market size in 2025, but expanded modestly as commodity acreage is already well penetrated. Synthetic liquid fertilizers, such as urea-ammonium nitrate (UAN), ammonium polyphosphate, and potassium nitrate, are widely used because they deliver highly concentrated nutrients in readily soluble forms. Their predictable nutrient composition enables growers to precisely match application rates to crop requirements, making them particularly suitable for large-scale grain and cereal production. Additionally, synthetic liquid fertilizers integrate effectively with variable-rate and fertigation systems, further solidifying their role in modern North American agricultural practices.
Organic liquids are advancing at a 8.1% CAGR to 2031, driven by demand from certified facilities and greenhouse vegetables that require National Organic Program compliance. Organic liquid fertilizers, derived from plant, animal, or microbial sources, are increasingly adopted for fruits, vegetables, and specialty crops. These fertilizers enhance soil health and microbial activity while aligning with regulatory and consumer-driven sustainability objectives. High-value crop growers are particularly drawn to organic liquids for their ability to deliver targeted nutrients without synthetic residues, thereby supporting both product quality and environmental sustainability.
List of Companies Covered in this Report:
- The Mosaic Company
- CF Industries Holdings Inc.
- AgroLiquid
- Haifa Group
- Kugler Company
- Sociedad Quimica y Minera de Chile SA
- EuroChem Group AG
- K+S Aktiengesellschaft
- Triangle C. C.
- Yara International ASA
- Helena Agri-Enterprises
- Tessenderlo Group
- Brandt Consolidated Inc.
- Grupa Azoty SA
- Nufarm Limited
Additional Benefits:
- The market estimate (ME) sheet in Excel format
- 3 months of analyst support
TABLE OF CONTENTS
1 Introduction
- 1.1 Study Assumptions and Market Definition
- 1.2 Scope of the Study
2 Research Methodology
3 Executive Summary
4 Market Landscape
- 4.1 Market Overview
- 4.2 Market Drivers
- 4.2.1 Precision-agriculture adoption accelerates demand for liquid nutrients
- 4.2.2 Shift to fertigation under water-scarcity programs
- 4.2.3 Crop-specific liquid blends launched by Tier-1 suppliers
- 4.2.4 Government incentives for domestic fertilizer capacity
- 4.2.5 Adoption of aerial and drone foliar spraying
- 4.2.6 Growth of controlled-environment agriculture hubs
- 4.3 Market Restraints
- 4.3.1 Corrosive handling and storage infrastructure costs
- 4.3.2 Volatility of natural-gas feedstock prices
- 4.3.3 Per- and polyfluoroalkyl substances (PFAS) and emerging contaminant regulation pressure
- 4.3.4 Cold-chain constraints for biologically enhanced liquids
- 4.4 Regulatory Landscape
- 4.5 Technological Outlook
- 4.6 Porter's Five Forces Analysis
- 4.6.1 Bargaining Power of Suppliers
- 4.6.2 Bargaining Power of Buyers
- 4.6.3 Threat of New Entrants
- 4.6.4 Threat of Substitute Products
- 4.6.5 Intensity of Competitive Rivalry
5 Market Size and Growth Forecasts (Value)
- 5.1 By Nutrient Type
- 5.1.1 Nitrogen
- 5.1.2 Potassium
- 5.1.3 Phosphate
- 5.1.4 Micronutrients
- 5.2 By Ingredient Type
- 5.2.1 Organic
- 5.2.2 Synthetic
- 5.3 By Mode of Application
- 5.3.1 Starter Solution
- 5.3.2 Foliar Application
- 5.3.3 Fertigation
- 5.3.4 Injection into Soil
- 5.3.5 Aerial and Drone Application
- 5.4 By Crop Type
- 5.4.1 Grains and Cereals
- 5.4.2 Pulses and Oilseeds
- 5.4.3 Commercial Crops
- 5.4.4 Fruits and Vegetables
- 5.4.5 Turf and Ornamentals
- 5.5 By Geography
- 5.5.1 United States
- 5.5.2 Canada
- 5.5.3 Mexico
- 5.5.4 Rest of North America
6 Competitive Landscape
- 6.1 Market Concentration
- 6.2 Strategic Moves
- 6.3 Market Share Analysis
- 6.4 Company Profiles (Includes Global level Overview, Market-level Overview, Core Segments, Financials as Available, Strategic Information, Market Rank/Share for key Companies, Products and Services, and Recent Developments)
- 6.4.1 The Mosaic Company
- 6.4.2 CF Industries Holdings Inc.
- 6.4.3 AgroLiquid
- 6.4.4 Haifa Group
- 6.4.5 Kugler Company
- 6.4.6 Sociedad Quimica y Minera de Chile SA
- 6.4.7 EuroChem Group AG
- 6.4.8 K+S Aktiengesellschaft
- 6.4.9 Triangle C. C.
- 6.4.10 Yara International ASA
- 6.4.11 Helena Agri-Enterprises
- 6.4.12 Tessenderlo Group
- 6.4.13 Brandt Consolidated Inc.
- 6.4.14 Grupa Azoty SA
- 6.4.15 Nufarm Limited
7 Market Opportunities and Future Outlook
 液體肥料市場報告:按產品類型、生產流程、作物、應用方法和地區分類(2026-2034 年)
 全球液體肥料市場規模、佔有率、趨勢和成長分析報告(2026-2034年)
 液態肥料市場:2026-2032年全球市場預測(依產品類型、作物、生產流程、應用及通路分類)
 液體肥料市場:按作物類型、成分、類型、應用和地區分類液體肥料市場規模、佔有率、成長及全球產業分析:按類型、應用和地區分類的洞察,2026-2034 年預測
 全球液體肥料市場報告(2026 年)按作物類型、包裝規格、應用、最終用途和銷售管道的多元素水溶性液體肥料市場—2026-2032年全球預測
 液態肥料市場規模、佔有率及成長分析(依作物類型、化合物、應用、類型及地區分類)-2026-2033年產業預測液體肥料市場-2025-2030年預測
 液體肥料市場-全球產業規模、佔有率、趨勢、機會和預測,按類型、應用方式、成分類型、作物類型、地區和競爭情況分類,2020-2030 年