


 |
市場調查報告書
商品編碼
2066410
OLED面板:市場佔有率分析、產業趨勢與統計、成長預測(2026-2031年)OLED Panel - Market Share Analysis, Industry Trends & Statistics, Growth Forecasts (2026 - 2031) |
||||||
※ 本網頁內容可能與最新版本有所差異。詳細情況請與我們聯繫。
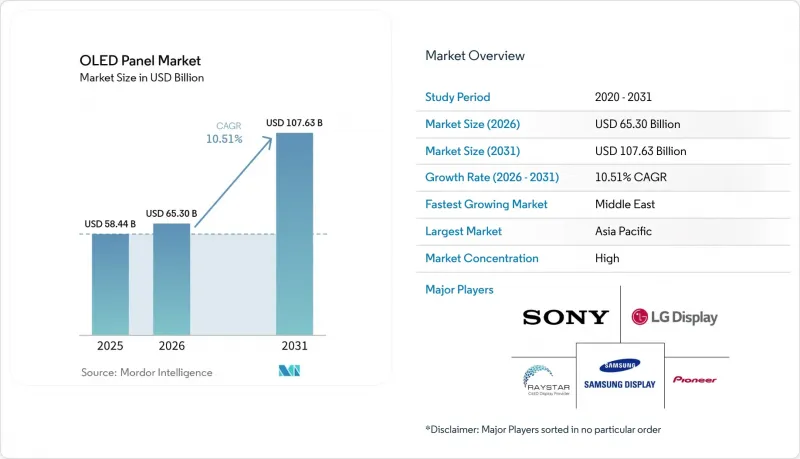
據 Mordor Intelligence 稱,2025 年 OLED 面板市值為 584.4 億美元,預計到 2031 年將達到 1076.3 億美元,而 2026 年為 653 億美元,預測期(2026-2031 年)的複合年成長率為 10.51%。
本報告按類型(軟性、剛性、透明)、顯示尋址方式(PMOLED 顯示器、AMOLED 顯示器)、尺寸(小、中、大)、產品(行動平板電腦、電視、汽車、穿戴式裝置、照明產品、醫療設備等)和地區(北美、歐洲、亞太等)進行細分。市場預測以美元計價。
全球OLED面板市場趨勢與洞察
智慧型手機中軟性OLED的廣泛應用
隨著中國安卓品牌在中階機型中普及軟性面板,以及蘋果將所有iPhone機型逐步過渡到OLED螢幕,預計到2025年第一季,軟性OLED螢幕將佔智慧型手機出貨量的57%。隨著三星顯示器第八代Assan系列產品的不斷擴展,預計到2027年,6吋軟性面板的單價將降至30美元以下。軟性面板與剛性OLED螢幕的價格差距已縮小至15%,使其成為主流選擇,而剛性OLED螢幕目前僅限於功能手機和工業控制設備。 IEC 62715-2:2022認證架構簡化了OEM認證流程,進一步加速了軟性面板的普及。
中國價格主導的供應模式從剛性轉向軟性。
京東方投資89億美元的成都工廠和華星光電投資41億美元的廣州印刷OLED工廠,每月新增54,500基板產能,使剛性面板的運轉率降至50%以下,並將軟性面板和剛性面板之間的價格差距縮小至15%以內。目前,中國品牌已開始在售價低於300美元的智慧型手機中指定使用軟性OLED面板,這給韓國和台灣的老舊剛性面板生產線帶來了壓力,促使一些企業採取轉型或撤出策略。儘管短期內供應過剩的風險依然存在,但預計加速折舊免稅額和政府獎勵將使中國工廠維持運營,直到需求趕上產能。
藍光發光元件壽命方面仍有許多限制
由於螢光藍光發送器在1000尼特亮度下的半衰期不足10000小時,面板製造商不得不提高子像素的驅動能力或採用串聯結構,這使得每個面板的成本增加50至80美元。這種成本負擔阻礙了OLED在75吋以上電視領域的廣泛應用,而相同尺寸的mini-LED液晶顯示器卻能以60%的價格提供相近的HDR性能。儘管Universal Display公司一直在進行研發,但目前尚未出現具有商業可行性的藍光磷光體解決方案,壽命仍然是OLED在超大尺寸、高亮度應用中的致命弱點。
細分市場分析
預計到2025年,軟性OLED面板市場規模將達到299億美元,年複合成長率(CAGR)為10.81%,主要得益於智慧型手機廠商和IT OEM廠商向可彎曲、可捲曲和曲面顯示器的轉型。雖然透明面板在2025年僅佔總銷售額的2%,但預計到2031年,其年複合成長率將達到11.09%,成為成長最快的細分市場,這主要得益於透明面板在汽車A柱和零售標牌領域的應用。剛性面板的需求持續下降,預計2028年將低於該細分市場銷售額的20%。儘管中國補貼減少,但由於無印刷和無掩模製程降低了材料成本,以及第八代晶圓廠基板產能的提升,軟性面板的價格仍將保持與傳統剛性基板的競爭力。
由於其高度的設計靈活性,軟性OLED的應用範圍正從行動電話擴展到筆記型電腦、平板電腦和穿戴式裝置。三星顯示器的17吋捲軸式筆記型電腦顯示器和現代摩比斯的18吋曲面駕駛座模組,都展示了彎曲半徑和超薄設計如何幫助創新工業設計。透明OLED面臨許多挑戰,例如與透明玻璃相比,其透光率低40%,限制了其戶外可視性。但首爾和杜拜的室內交通和智慧城市計畫正逐步展現出其日益成長的商業性可行性。整體而言,軟性結構正逐漸成為家用電子電器的標準配置,而剛性面板則主要應用於小眾工業領域。
到2025年,AMOLED將佔據83.63%的市場佔有率,繼續主導OLED面板市場。 LTPO-AMOLED是成長最快的技術,複合年成長率高達10.95%,它結合了氧化物電晶體和多晶矽電晶體,可實現1至120Hz的刷新率調節,從而將行動電話功耗降低五分之一。預計到2025年,LTPO-AMOLED在OLED面板市場的佔有率將達到18%,到2031年將超過35%,因為蘋果、三星和中國競爭對手將在高階市場將此功能標準化。
儘管PMOLED目前仍應用於穿戴式裝置和2吋以下的工業顯示器,但預計到2029年其市佔率將降至5%以下。日本顯示器JAPAN DISPLAY)的「eLEAP」製程將開口率提升至60%,亮度翻倍,從而延長了筆記型電腦和汽車儀錶板中AMOLED的使用壽命。符合IEC 62341系列標準有助於跨區域認證,進一步鞏固了AMOLED的優勢,因為mini-LED LCD和micro-LED正面臨尺寸縮放方面的挑戰。
區域分析
預計到2025年,亞太地區將佔全球OLED面板銷售額的71.49%,其中中國佔全球面板銷售額的52.1%,京東方和華星光電在第八代/第九代OLED面板領域的累計投資將達到130億美元。韓國保持了其技術優勢,佔了OLED電視產量的82.6%和iPhone 17面板供應量的64.5%。同時,日本則專注於高亮度eLEAP面板。在印度,儘管智慧型手機OLED的滲透率仍低於30%,且市場對價格依然敏感,但隨著本土品牌轉向進口價格適中的軟性AMOLED面板,市場仍有成長空間。因此,亞太地區仍是OLED面板的生產中心,兼具中國的規模優勢和韓國的創新能力。
儘管北美和歐洲缺乏本土製造地,但它們仍然是高階市場需求的主要驅動力。 2025年上半年,這些地區的OLED電視出貨量達到183萬台,較去年同期成長13%。這主要得益於77吋機型的售價低於3000美元。汽車OLED在歐洲市場發展勢頭強勁,梅賽德斯-奔馳、奧迪和寶馬等汽車製造商正利用其成熟的一級供應商供應鏈,將OLED模組應用於汽車內外裝。蘋果全新的2025款iPhone系列也將採用OLED技術,進一步擴大了北美市場對軟性面板的需求。
儘管中東地區的銷售基數較小,但由於沙烏地阿拉伯的NEOM新城和阿拉伯聯合大公國的智慧城市計畫在公共基礎設施中廣泛採用透明OLED和OLED指示牌,預計該地區的年複合成長率將達到11.83%。在南美和非洲,由於外匯波動和進口關稅推高了零售價格,OLED的滲透率仍然低於10%。因此,儘管傳統地區仍佔據主導地位,但海灣國家有針對性的基礎設施部署正在為地理分散的收入來源注入新的活力。
其他好處:
- Excel格式的市場預測(ME)表
- 3個月的分析師支持
目錄
第1章:引言
- 研究假設和市場定義
- 調查範圍
第2章:調查方法
第3章執行摘要
第4章 市場狀況
- 市場概覽
- 市場促進因素
- 智慧型手機中軟性OLED的廣泛應用
- 中國供應鏈正從「僵化」的價格驅動型供應鏈轉向「靈活」的價格主導供應鏈。
- LTPO背板在主流型號中的出現
- OLED在遊戲顯示器和筆記型電腦中的迅速普及
- 曲面和自由曲面汽車駕駛座顯示器的需求
- 品牌對折疊式和可捲曲外形規格的採用率不斷提高
- 市場限制因素
- 高亮度藍光發光元件壽命的限制
- 基於Mini-LED液晶顯示器和Micro-LED發展藍圖的競爭
- 建造資本密集的第八代和第九代OLED製造工廠
- 中國積極擴張產能可能導致供應過剩風險
- 產業價值鏈分析
- 監理情勢
- 技術展望
- 宏觀經濟因素對市場的影響
- 波特五力分析
第5章 市場規模與成長預測
- 按類型
- 靈活的
- 死板的
- 透明的
- 顯示尋址系統
- PMOLED顯示器
- AMOLED顯示器
- 尺寸
- 小型OLED面板
- 中等尺寸OLED面板
- 大型OLED面板
- 依產品
- 手機和平板電腦
- 電視機
- 車
- 穿戴式裝置
- 照明產品
- 醫療設備
- 家用電器
- 按地區
- 北美洲
- 美國
- 加拿大
- 墨西哥
- 歐洲
- 英國
- 德國
- 法國
- 義大利
- 其他歐洲國家
- 亞太地區
- 中國
- 日本
- 印度
- 韓國
- 其他亞洲國家
- 中東
- 以色列
- 沙烏地阿拉伯
- 阿拉伯聯合大公國
- 土耳其
- 其他中東國家
- 非洲
- 南非
- 埃及
- 其他非洲國家
- 南美洲
- 巴西
- 阿根廷
- 其他南美國家
- 北美洲
第6章 競爭情勢
- 市場集中度
- 策略趨勢
- 市佔率分析
- 公司簡介
- LG Display Co., Ltd
- Sony Corporation
- Pioneer Corporation
- Raystar Optronics Inc.
- Ritek Corporation
- OSRAM OLED GmbH
- WiseChip Semiconductor Inc.
- Winstar Display Co. Ltd
- Visionox Co. Ltd
- BOE Technology Group Co., Ltd
- Tianma Microelectronics Co., Ltd
- AU Optronics Corp.
- Japan Display Inc.
- Universal Display Corporation
- CSOT(China Star)
- JOLED Inc.
- Everdisplay Optronics(EDO)
- Sharp Corporation
- Royole Corporation
第7章 市場機會與未來展望
According to Mordor Intelligence, the oLED panel market size was valued at USD 58.44 billion in 2025 and is estimated to grow from USD 65.30 billion in 2026 to reach USD 107.63 billion by 2031, at a CAGR of 10.51% during the forecast period (2026-2031).
This report is Segmented by Type (Flexible, Rigid, and Transparent), Display Address Scheme (PMOLED Display, and AMOLED Display), Size (Small-Sized, Medium-Sized, and Large-Sized), Product (Mobile and Tablet, Television, Automotive, Wearable, Lighting Products, Healthcare Devices, and More), and Geography (North America, Europe, Asia-Pacific, and More). The Market Forecasts are Provided in Terms of Value (USD).
Global OLED Panel Market Trends and Insights
Rising Adoption of Flexible OLEDs In Smartphones
Flexible OLED penetration reached 57% of smartphone shipments in Q1 2025 as Chinese Android brands standardized flex panels in mid-tier models and Apple migrated every iPhone SKU to OLED. Unit prices for 6-inch flexible panels are trending below USD 30 by 2027 as Samsung Display's Asan Gen-8-line scales output. The narrowing 15% price gap versus rigid OLEDs positions flex architectures as the default choice, relegating rigid units to feature phones and industrial controls. IEC 62715-2:2022 certification frameworks simplify OEM qualification, further accelerating adoption.
Price-Driven Shift from Rigid to Flexible Supply in China
BOE's USD 8.9 billion Chengdu fab and CSOT's USD 4.1 billion Guangzhou printed-OLED facility add a combined 54,500 substrates per month, compressing rigid utilization below 50% and cutting the flex-rigid price spread to under 15%. Chinese brands now specify flexible OLEDs for smartphones priced under USD 300, squeezing older rigid lines in Korea and Taiwan and prompting conversion or exit strategies. Short-run oversupply risk persists, but accelerated depreciation and government incentives sustain Chinese fabs until demand matches capacity.
Persistent Blue-Emitter Lifetime Limitations
Fluorescent blue emitters exhibit half-lives below 10,000 hours at 1,000 nits, forcing panel makers to overdrive subpixels and adopt tandem stacks, which add USD 50-80 per panel. The cost penalty constrains OLED uptake in 75-inch-plus televisions, where mini-LED LCD delivers comparable HDR at 60% of the price. Commercial blue phosphorescent solutions remain elusive despite ongoing Universal Display R&D, leaving lifetime as OLED's Achilles' heel in ultra-large and high-luminance applications.
Other drivers and restraints analyzed in the detailed report include:
- Emergence Of LTPO Backplanes in Mainstream Models
- Rapid OLED Penetration in Gaming Monitors and Laptops
- Competition From Mini-LED LCD And Micro-LED Roadmaps
For complete list of drivers and restraints, kindly check the Table Of Contents.
Segment Analysis
The OLED panel market size for flexible formats captured USD 29.9 billion in 2025 and is forecast to expand at a 10.81% CAGR as smartphone vendors and IT OEMs pivot to bendable, rollable, and curved displays. Transparent variants, although only 2% of 2025 revenue, will rise fastest at 11.09% CAGR through 2031 thanks to automotive A-pillar integration and retail signage. Rigid panel demand continues to shrink, falling below 20% of segment revenue by 2028. Material savings from printed, maskless processes and higher substrate throughput at Gen-8 fabs will keep flexible pricing competitive against legacy rigid units even as Chinese subsidies taper.
Design latitude drives flexible OLED beyond handsets into laptops, tablets, and wearables. Samsung Display's 17-inch rollable laptop screen and Hyundai Mobis's 18-inch curved cockpit module illustrate how bend radius and thinness unlock novel industrial designs. Transparent OLEDs still struggle with 40% lower transmittance than clear glass, limiting outdoor readability, but indoor transportation and smart-city projects in Seoul and Dubai demonstrate emerging commercial viability. Overall, flexible architecture secures its position as the default across consumer electronics while rigid panels retreat to niche industrial utilities.
AMOLED commanded 83.63% revenue in 2025 and remains the workhorse engine of the OLED panel market. LTPO-AMOLED, the fastest-growing subset at 10.95% CAGR, marries oxide and poly-silicon transistors to enable 1-120 Hz refresh modulation, reducing handset power budgets by up to one-fifth. The OLED panel market share for LTPO reached 18% in 2025 and is projected to surpass 35% by 2031 as Apple, Samsung, and Chinese rivals standardize the feature in premium tiers.
PMOLED lingers in sub-2-inch wearables and industrial displays but will slip below 5% revenue contribution by 2029. Japan Display's eLEAP process, boosting aperture ratios to 60% and doubling luminance, advances AMOLED longevity in notebooks and automotive dashboards. Compliance with the IEC 62341 series eases homologation across regions, reinforcing AMOLED's lead as mini-LED LCD and micro-LED face scaling hurdles.
Geography Analysis
Asia Pacific controlled 71.49% of 2025 revenue, propelled by China's 52.1% share of global panel turnover and USD 13 billion in cumulative Gen-8/9 capex by BOE and CSOT. South Korea retained technological primacy, owning 82.6% of OLED TV output and 64.5% of iPhone 17 panel supply, while Japan focused on high brightness eLEAP devices. India, with sub-30% smartphone OLED penetration, remains price sensitive but shows upside as domestic brands pivot to affordable flexible AMOLED imports. Asia Pacific thus remains the production heartland, balancing Chinese scale and Korean innovation.
North America and Europe contributed premium demand without domestic fabrication. The regions shipped 1.83 million OLED TVs in H1 2025, a 13% annual uptick, buoyed by 77-inch units falling below USD 3,000. Automotive OLED momentum is notable in Europe, where Mercedes-Benz, Audi, and BMW deploy both interior and exterior OLED modules, leveraging established tier-one supply chains. Apple's all-OLED 2025 iPhone lineup further enlarges North American flexible panel pull-through.
The Middle East, though accounting for a small revenue base, is forecast to grow at 11.83% CAGR as Saudi Arabia's NEOM and the UAE's smart-city programs specify transparent and signage OLEDs for public infrastructure. South America and Africa trail with sub-10% penetration due to currency volatility and import tariffs that inflate retail prices. Hence, while traditional regions continue to dominate, targeted infrastructure deployments in the Gulf states provide a fresh spur to diversified geographic revenue.
- LG Display Co., Ltd
- Sony Corporation
- Pioneer Corporation
- Raystar Optronics Inc.
- Ritek Corporation
- OSRAM OLED GmbH
- WiseChip Semiconductor Inc.
- Winstar Display Co. Ltd
- Visionox Co. Ltd
- BOE Technology Group Co., Ltd
- Tianma Microelectronics Co., Ltd
- AU Optronics Corp.
- Japan Display Inc.
- Universal Display Corporation
- CSOT (China Star)
- JOLED Inc.
- Everdisplay Optronics (EDO)
- Sharp Corporation
- Royole Corporation
Additional Benefits:
- The market estimate (ME) sheet in Excel format
- 3 months of analyst support
TABLE OF CONTENTS
1 INTRODUCTION
- 1.1 Study Assumptions and Market Definition
- 1.2 Scope of the Study
2 RESEARCH METHODOLOGY
3 EXECUTIVE SUMMARY
4 MARKET LANDSCAPE
- 4.1 Market Overview
- 4.2 Market Drivers
- 4.2.1 Rising Adoption of Flexible OLEDs in Smartphones
- 4.2.2 Price-Driven Shift From Rigid to Flexible Supply in China
- 4.2.3 Emergence of LTPO Backplanes in Mainstream Models
- 4.2.4 Rapid OLED Penetration in Gaming Monitors and Laptops
- 4.2.5 Demand for Curved and Free-Form Automotive Cockpit Displays
- 4.2.6 Increasing Brand Adoption of Foldable and Rollable Form Factors
- 4.3 Market Restraints
- 4.3.1 Persistent Blue-Emitter Lifetime Limitations
- 4.3.2 Competition From Mini-LED LCD and Micro-LED Roadmaps
- 4.3.3 Capital-Intensive Gen-8/9 OLED Fab Build-outs
- 4.3.4 Oversupply Risk From Aggressive Chinese Capacity Expansion
- 4.4 Industry Value-Chain Analysis
- 4.5 Regulatory Landscape
- 4.6 Technological Outlook
- 4.7 Impact of Macroeconomic Factors on the Market
- 4.8 Porter's Five Forces Analysis
- 4.8.1 Bargaining Power of Suppliers
- 4.8.2 Bargaining Power of Buyers
- 4.8.3 Threat of New Entrants
- 4.8.4 Threat of Substitutes
- 4.8.5 Intensity of Competitive Rivalry
5 MARKET SIZE AND GROWTH FORECASTS (VALUE)
- 5.1 By Type
- 5.1.1 Flexible
- 5.1.2 Rigid
- 5.1.3 Transparent
- 5.2 By Display Address Scheme
- 5.2.1 PMOLED Display
- 5.2.2 AMOLED Display
- 5.3 By Size
- 5.3.1 Small-Sized OLED Panel
- 5.3.2 Medium-Sized OLED Panel
- 5.3.3 Large-Sized OLED Panel
- 5.4 By Product
- 5.4.1 Mobile and Tablet
- 5.4.2 Television
- 5.4.3 Automotive
- 5.4.4 Wearable
- 5.4.5 Lighting Products
- 5.4.6 Healthcare Devices
- 5.4.7 Home Appliances
- 5.5 By Geography
- 5.5.1 North America
- 5.5.1.1 United States
- 5.5.1.2 Canada
- 5.5.1.3 Mexico
- 5.5.2 Europe
- 5.5.2.1 United Kingdom
- 5.5.2.2 Germany
- 5.5.2.3 France
- 5.5.2.4 Italy
- 5.5.2.5 Rest of Europe
- 5.5.3 Asia-Pacific
- 5.5.3.1 China
- 5.5.3.2 Japan
- 5.5.3.3 India
- 5.5.3.4 South Korea
- 5.5.3.5 Rest of Asia
- 5.5.4 Middle East
- 5.5.4.1 Israel
- 5.5.4.2 Saudi Arabia
- 5.5.4.3 United Arab Emirates
- 5.5.4.4 Turkey
- 5.5.4.5 Rest of Middle East
- 5.5.5 Africa
- 5.5.5.1 South Africa
- 5.5.5.2 Egypt
- 5.5.5.3 Rest of Africa
- 5.5.6 South America
- 5.5.6.1 Brazil
- 5.5.6.2 Argentina
- 5.5.6.3 Rest of South America
- 5.5.1 North America
6 COMPETITIVE LANDSCAPE
- 6.1 Market Concentration
- 6.2 Strategic Moves
- 6.3 Market Share Analysis
- 6.4 Company Profiles (includes Global Level Overview, Market Level Overview, Core Segments, Financials as Available, Strategic Information, Market Rank/Share for Key Companies, Products and Services, and Recent Developments)
- 6.4.1 LG Display Co., Ltd
- 6.4.2 Sony Corporation
- 6.4.3 Pioneer Corporation
- 6.4.4 Raystar Optronics Inc.
- 6.4.5 Ritek Corporation
- 6.4.6 OSRAM OLED GmbH
- 6.4.7 WiseChip Semiconductor Inc.
- 6.4.8 Winstar Display Co. Ltd
- 6.4.9 Visionox Co. Ltd
- 6.4.10 BOE Technology Group Co., Ltd
- 6.4.11 Tianma Microelectronics Co., Ltd
- 6.4.12 AU Optronics Corp.
- 6.4.13 Japan Display Inc.
- 6.4.14 Universal Display Corporation
- 6.4.15 CSOT (China Star)
- 6.4.16 JOLED Inc.
- 6.4.17 Everdisplay Optronics (EDO)
- 6.4.18 Sharp Corporation
- 6.4.19 Royole Corporation
7 MARKET OPPORTUNITIES AND FUTURE OUTLOOK
- 7.1 White-Space and Unmet-Need Assessment
 有機發光二極體(OLED)市場規模、佔有率和成長分析:按產品類型、技術、應用和地區分類-2026-2033年產業預測
 軟性OLED全球市場規模、佔有率、趨勢和成長分析報告(2026-2034年)
 有機發光二極體市場:按產品類型、技術和最終用戶分類-2026-2032年全球市場預測
 OLED面板市場規模、佔有率、趨勢和預測:按類型、技術、尺寸、最終用戶和地區分類,2026-2034年有機發光二極體(OLED)市場規模:按產品類型、技術、應用、最終用途領域和地區分類(2026-2034 年)
 折疊式OLED顯示器市場報告:趨勢、預測與競爭分析(至2035年)OLED照明市場:按類型、技術、色溫、應用和最終用戶分類-2026-2032年全球市場預測OLED市場:2026-2032年全球市場預測(按技術、應用案例、面板類型、面板尺寸、發光裝置類型、最終用途和銷售管道)汽車OLED市場:2026年至2032年全球市場預測,依應用、車輛類型、顯示技術及顯示尺寸分類軟性OLED市場:2026-2032年全球市場預測(依顯示類型、基板材料、面板尺寸、製造技術、應用和終端用戶產業分類)