

 |
市場調查報告書
商品編碼
2066401
高壓電纜:市場佔有率分析、行業趨勢和統計數據、成長預測(2026-2031 年)High Voltage Cables - Market Share Analysis, Industry Trends & Statistics, Growth Forecasts (2026 - 2031) |
||||||
※ 本網頁內容可能與最新版本有所差異。詳細情況請與我們聯繫。
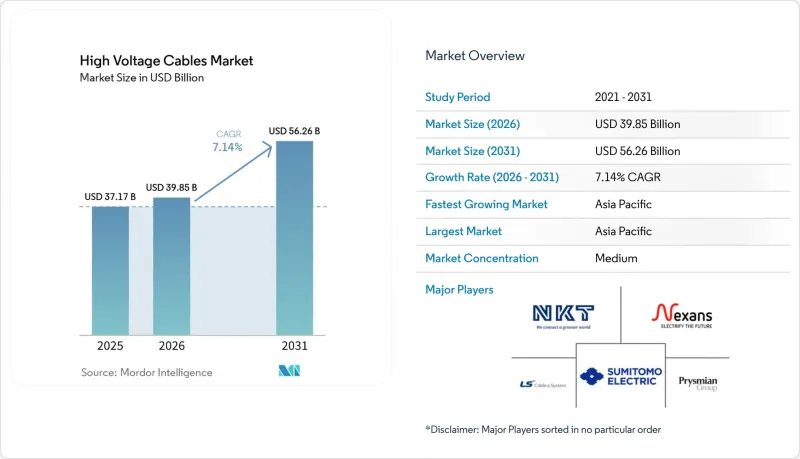
根據 Mordor Intelligence 預測,高壓電纜市場規模預計在 2026 年達到 398.5 億美元,到 2031 年將達到 562.6 億美元。
這表明在預測期內複合年成長率將達到 7.14%,證實了電網投資正朝著脫碳和提高韌性的方向發生決定性轉變。
本報告按安裝位置(架空電纜、地下電纜、海底電纜)、輸電方式(高壓直流輸電和交流輸電)、電壓等級(66 kV–110 kV、115 kV–330 kV 和 330 kV 及以上)以及地區(北美、歐洲、亞太、南美、中東和非洲)進行細分。市場規模和預測以美元計價。
全球高壓電纜市場趨勢及洞察
伴隨可再生能源擴張而來的融合
隨著太陽能和風能發電規模的成長超過了電網升級的速度,限電風險日益增加,迫使各國政府強制建造新的高容量輸電線路。例如,歐盟的目標是到2030年實現每公里4萬條線路的輸電能力。在印度,已批准在2025年之前建造8000公里400千伏和765千伏的輸電線路,用於連接拉賈斯坦邦和古吉拉突邦的再生能源來源。同時,在中國,已運作3,200公里±800千伏高壓直流輸電線路,用於將電力從西向東輸送。由於配套的儲能設施僅能提供足夠四小時的電力,高壓電纜市場在季節性電力供需調節策略中仍扮演核心角色。
電網快速現代化和互聯項目
1960年代鋪設的老舊輸電線路如今故障率不斷上升,美國能源局在2025年撥款25億美元,用於推動大規模區域間互聯。東協耗資8,000億美元的電網工程計畫興建一個橫跨泰國、馬來西亞、新加坡和印尼的同步輸電網路,而2吉瓦的「歐亞聯網電纜」計畫則計畫鋪設一條525千伏特的海底電纜,連接地中海和歐洲的電力需求中心。這些建設項目預計將推動高壓電纜市場的長期成長。
高壓電纜專案需要較高的初始資本支出(CAPEX)。
水下和地下線路的每公里成本是架空線路的五倍之多,凱爾特聯網電纜的建設成本預計為每公里160萬歐元,這將對開發中國家的債務償還基準帶來壓力。 2024年至2025年間利率的上升令金融機構擔憂未對沖的成本風險,導致普睿司曼公司將估算轉化為訂單的轉換率下降了30%。
細分市場分析
受北海、台灣海峽和美國大西洋沿岸離岸風力發電電場建設的推動,海底輸電線路預計在2026年至2031年間成長10.3%,成為所有輸電方式中成長最快的。到2025年,地下線路仍佔高壓電纜市場規模的48.1%,這主要得益於人口稠密的城市地區對地下線路的需求,因為這些地區架空輸電線路的建設受到限制。在北美和非洲人口密度較低的地區,由於土地徵用容易且資本支出(CAPEX)較低,架空線路仍佔主導地位。船舶短缺迫使開發商提前數年預訂安裝船舶,這項營運挑戰影響了競標策略。
東京、首爾和新加坡的城市負責人傾向於採用地下饋線環路,以解決對景觀影響的擔憂。同時,凱爾特島和博恩霍爾姆島的計畫展示了海底電纜結構如何整合多吉瓦級風力發電樞紐。 IEC 62067擠壓絕緣子標準有助於採購的統一性,但由於與漁具碰撞的風險,保險成本正在飆升。這些趨勢持續推動高壓電纜市場將資金從架空電纜轉向海底電纜。
區域分析
預計亞太地區將在高壓電纜市場佔據主導地位,到2025年市場佔有率將達到40.0%,並在2031年之前以9.6%的複合年成長率持續成長。 2025年,中國將運作3,200公里±800千伏高壓直流輸電線路,用於將西部地區產生的可再生能源輸送至東部地區。同時,印度已批准興建8000公里400千伏及765千伏輸電線路,用於連接太陽能發電區域。東協8,000億美元的電網計畫和日本2吉瓦的秋田能離岸風力發電計畫將進一步推動該地區的市場成長。
歐洲則位居第二,這主要得益於離岸風力發電和泛歐能源網路(TEN-E)框架下的跨境高壓直流輸電(HVDC)專案。 70吉瓦的「北海風電樞紐」計畫需要525千伏電纜網,而僅德國的「南海連接」(SuedLink)計畫就包含2000公里長的±525千伏地下線路。公眾對架空輸電線路的反對迫使電力公司選擇成本更高的地下輸電方案,這使得高壓電纜市場在供應成長停滯的情況下仍然保持價值。
在北美,重點在於整合可再生能源和增強電網韌性。 TransWest Express ±600千伏計畫將於2025年動工建設,該計畫將懷俄明州的風力發電與內華達州和加州連接起來,全長730英里;魁北克的水力發電出口需要升級至320千伏高壓直流輸電。在中東,沙烏地阿拉伯和希臘計畫利用剩餘的太陽能電力建造一條3吉瓦的聯網線路;在南非,400千伏電網的建設正在加速推進,以穩定Eskom的輸電網路。在南美洲,一條橫跨巴西和阿根廷的500千伏高壓交流輸電走廊正在建設中,這將使區域供應商受益。這些發展共同推動了全球對高壓電纜市場解決方案的需求。
其他好處:
- Excel格式的市場預測(ME)表
- 3個月的分析師支持
目錄
第1章:引言
- 研究假設和市場定義
- 調查範圍
第2章:調查方法
第3章執行摘要
第4章 市場狀況
- 市場概覽
- 市場促進因素
- 可再生能源的擴展和整合
- 電網快速現代化和互聯項目
- 離岸風力發電擴建工程
- 新興國家的都市化和工業用電需求成長
- 資料中心園區功率密度激增
- 氫能輸電走廊
- 市場限制因素
- 高壓電纜專案需要較高的初始資本支出(CAPEX)。
- 許可證取得和環境審查過程耗時過長
- 大宗商品(銅、鋁、聚合物)價格波動
- 持證高壓連接技術人員短缺
- 供應鏈分析
- 監理情勢
- 技術展望
- 波特五力模型
第5章 市場規模與成長預測
- 按部署位置
- 架空電纜
- 地下電纜
- 海底電纜
- 透過傳輸方法
- HVDC
- HVAC
- 按電壓等級
- 66 kV~110 kV
- 115 kV~330 kV
- 330千伏或以上
- 按地區
- 北美洲
- 美國
- 加拿大
- 墨西哥
- 歐洲
- 德國
- 英國
- 法國
- 義大利
- 俄羅斯
- 其他歐洲國家
- 亞太地區
- 中國
- 印度
- 日本
- 韓國
- 東南亞國協
- 其他亞太國家
- 南美洲
- 巴西
- 阿根廷
- 其他南美國家
- 中東和非洲
- 沙烏地阿拉伯
- 阿拉伯聯合大公國
- 南非
- 埃及
- 其他中東和非洲國家
- 北美洲
第6章 競爭情勢
- 市場集中度
- 策略趨勢(併購、聯盟、購電協議)
- 市場佔有率分析(主要公司的市場排名和佔有率)
- 公司簡介
- Prysmian Group
- Nexans SA
- NKT A/S
- ABB Ltd
- Siemens Energy AG
- Southwire Company LLC
- LS Cable & System Ltd
- Sumitomo Electric Industries Ltd
- General Cable Corp(Prysmian)
- KEI Industries Ltd
- Furukawa Electric Co Ltd
- Taihan Cable & Solution
- Tratos Ltd
- Finolex Cables Ltd
- Cable Corporation of India Ltd
- Jiangsu Zhongtian Technology Co
- Dubai Cable Co(DUCAB)
- Gupta Power Infrastructure Ltd
- Elsewedy Electric
- Riyadh Cables Group
第7章 市場機會與未來展望
According to Mordor Intelligence, the high voltage cables market reached USD 39.85 billion in 2026 and is projected to achieve USD 56.26 billion by 2031, reflecting a 7.14% CAGR during the forecast period, underscoring a decisive reorientation of power-grid spending toward decarbonization and resilience.
This report is Segmented by Location of Deployment (Overhead Cables, Underground Cables, and Submarine Cables), Type of Transmission (HVDC and HVAC), Voltage Level (66 KV To 110KV, 115 KV To 330 KV, and Above 330 KV), and Geography (North America, Europe, Asia-Pacific, South America, and Middle East and Africa). The Market Size and Forecast are Provided in Value (USD).
Global High Voltage Cables Market Trends and Insights
Integration of renewable energy build-out
Curtailment risk is escalating as solar and wind additions outpace grid reinforcements, compelling governments to mandate new high-capacity corridors, such as the EU goal of 40,000 circuit-km by 2030. India cleared 8,000 km of 400 kV and 765 kV lines in 2025 to connect Rajasthan and Gujarat renewables, while China commissioned 3,200 km of +- 800 kV HVDC to move western power eastward. Storage co-location offers only four-hour coverage, leaving the high voltage cables market central to seasonal balancing strategies.
Rapid Grid Modernization & Interconnection Projects
Legacy circuits installed in the 1960s now show rising failure rates, and the U.S. Department of Energy committed USD 2.5 billion in 2025 to stimulate large interregional links. ASEAN's USD 800 billion Power Grid blueprint envisions synchronous exchanges across Thailand, Malaysia, Singapore, and Indonesia, while the 2 GW EuroAsia Interconnector will deploy 525 kV subsea cables to marry Mediterranean and European demand centers. These builds reinforce the long-run growth of the high-voltage cables market.
High Upfront CAPEX of HV Cable Projects
Submarine and underground routes cost up to five times more per km than overhead lines, with the Celtic Interconnector priced at EUR 1.6 million per km, straining debt-service metrics in developing countries. Rising interest rates in 2024-2025 pushed Prysmian's inquiry-to-order conversion down 30% as financiers balked at unhedged cost exposure.
Other drivers and restraints analyzed in the detailed report include:
- Expanding Offshore Wind Farm Installations
- Data-Center Campus Power-Density Surge
- Lengthy Permitting & Environmental Clearances
For complete list of drivers and restraints, kindly check the Table Of Contents.
Segment Analysis
Submarine lines are projected to grow 10.3% between 2026 and 2031, the fastest among deployment modes, catalyzed by offshore arrays in the North Sea, Taiwan Strait, and the U.S. Atlantic. Underground routes retained 48.1% of the high voltage cables market size in 2025, driven by dense urban centers that restrict overhead construction. Overhead circuits still dominate sparsely populated corridors in North America and Africa, leveraging easier rights-of-way and lower CAPEX. Vessel shortages mean developers must pre-book installation ships years ahead, an operational hurdle that shapes bid strategies.
Urban planners in Tokyo, Seoul, and Singapore favor underground feeder loops to address visual impact concerns. Conversely, the Celtic and Bornholm projects show how submarine architecture can aggregate multi-gigawatt wind hubs. The IEC 62067 standard for extruded insulation underpins procurement uniformity, while insurance costs escalate due to fishing-gear strike risks. These dynamics ensure the high voltage cables market continues reallocating capital from overhead to submarine corridors.
Geography Analysis
Asia-Pacific dominated the high voltage cables market with 40.0% share in 2025 and is rising at a 9.6% CAGR through 2031. China energized 3,200 km of +- 800 kV HVDC in 2025 to funnel western renewables eastward, while India approved 8,000 km of 400 kV and 765 kV corridors to connect solar zones. ASEAN's USD 800 billion grid program and Japan's 2 GW Akita-Noshiro offshore complex anchor further regional growth.
Europe ranks second, buoyed by offshore wind and cross-border HVDC pledges under the TEN-E framework. The North Sea Wind Power Hub's 70 GW plan requires 525 kV cables in meshed configurations; Germany's SuedLink alone spans 2,000 km of +- 525 kV underground route. Public resistance to overhead lines pushes utilities to pricier underground options, sustaining high voltage cables market value despite flat volume growth.
North America focuses on renewables integration and resilience. The TransWest Express +- 600 kV project broke ground in 2025, connecting Wyoming wind to Nevada and California over 730 miles, while Quebec's hydro exports demand 320 kV HVDC upgrades. The Middle East leverages surplus solar to plan the 3 GW Saudi-Greece interconnector, and South Africa accelerates 400 kV builds to stabilize Eskom's grid. South America advances 500 kV HVAC corridors across Brazil and Argentina, benefitting regional suppliers. These developments collectively amplify global appetite for high-voltage cables market solutions.
- Prysmian Group
- Nexans SA
- NKT A/S
- ABB Ltd
- Siemens Energy AG
- Southwire Company LLC
- LS Cable & System Ltd
- Sumitomo Electric Industries Ltd
- General Cable Corp (Prysmian)
- KEI Industries Ltd
- Furukawa Electric Co Ltd
- Taihan Cable & Solution
- Tratos Ltd
- Finolex Cables Ltd
- Cable Corporation of India Ltd
- Jiangsu Zhongtian Technology Co
- Dubai Cable Co (DUCAB)
- Gupta Power Infrastructure Ltd
- Elsewedy Electric
- Riyadh Cables Group
Additional Benefits:
- The market estimate (ME) sheet in Excel format
- 3 months of analyst support
TABLE OF CONTENTS
1 Introduction
- 1.1 Study Assumptions & Market Definition
- 1.2 Scope of the Study
2 Research Methodology
3 Executive Summary
4 Market Landscape
- 4.1 Market Overview
- 4.2 Market Drivers
- 4.2.1 Integration of renewable energy build-out
- 4.2.2 Rapid grid-modernisation & inter-connection projects
- 4.2.3 Expanding offshore-wind farm installations
- 4.2.4 Urbanisation & industrial load growth in emerging economies
- 4.2.5 Data-centre campus power-density surge
- 4.2.6 Hydrogen economy-ready transmission corridors
- 4.3 Market Restraints
- 4.3.1 High upfront CAPEX of HV cable projects
- 4.3.2 Lengthy permitting & environmental clearances
- 4.3.3 Commodity-price volatility (Cu, Al, polymers)
- 4.3.4 Shortage of certified HV jointing technicians
- 4.4 Supply-Chain Analysis
- 4.5 Regulatory Landscape
- 4.6 Technological Outlook
- 4.7 Porter's Five Forces
- 4.7.1 Bargaining Power of Suppliers
- 4.7.2 Bargaining Power of Buyers
- 4.7.3 Threat of New Entrants
- 4.7.4 Threat of Substitutes
- 4.7.5 Competitive Rivalry
5 Market Size & Growth Forecasts
- 5.1 By Location of Deployment
- 5.1.1 Overhead Cables
- 5.1.2 Underground Cables
- 5.1.3 Submarine Cables
- 5.2 By Type of Transmission
- 5.2.1 HVDC
- 5.2.2 HVAC
- 5.3 By Voltage Level
- 5.3.1 66 kV to 110 kV
- 5.3.2 115 kV to 330 kV
- 5.3.3 Above 330 kV
- 5.4 By Geography
- 5.4.1 North America
- 5.4.1.1 United States
- 5.4.1.2 Canada
- 5.4.1.3 Mexico
- 5.4.2 Europe
- 5.4.2.1 Germany
- 5.4.2.2 United Kingdom
- 5.4.2.3 France
- 5.4.2.4 Italy
- 5.4.2.5 Russia
- 5.4.2.6 Rest of Europe
- 5.4.3 Asia Pacific
- 5.4.3.1 China
- 5.4.3.2 India
- 5.4.3.3 Japan
- 5.4.3.4 South Korea
- 5.4.3.5 ASEAN Countries
- 5.4.3.6 Rest of Asia Pacific
- 5.4.4 South America
- 5.4.4.1 Brazil
- 5.4.4.2 Argentina
- 5.4.4.3 Rest of South America
- 5.4.5 Middle East and Africa
- 5.4.5.1 Saudi Arabia
- 5.4.5.2 United Arab Emirates
- 5.4.5.3 South Africa
- 5.4.5.4 Egypt
- 5.4.5.5 Rest of Middle East and Africa
- 5.4.1 North America
6 Competitive Landscape
- 6.1 Market Concentration
- 6.2 Strategic Moves (M&A, Partnerships, PPAs)
- 6.3 Market Share Analysis (Market Rank/Share for key companies)
- 6.4 Company Profiles (includes Global level Overview, Market level overview, Core Segments, Financials as available, Strategic Information, Products & Services, and Recent Developments)
- 6.4.1 Prysmian Group
- 6.4.2 Nexans SA
- 6.4.3 NKT A/S
- 6.4.4 ABB Ltd
- 6.4.5 Siemens Energy AG
- 6.4.6 Southwire Company LLC
- 6.4.7 LS Cable & System Ltd
- 6.4.8 Sumitomo Electric Industries Ltd
- 6.4.9 General Cable Corp (Prysmian)
- 6.4.10 KEI Industries Ltd
- 6.4.11 Furukawa Electric Co Ltd
- 6.4.12 Taihan Cable & Solution
- 6.4.13 Tratos Ltd
- 6.4.14 Finolex Cables Ltd
- 6.4.15 Cable Corporation of India Ltd
- 6.4.16 Jiangsu Zhongtian Technology Co
- 6.4.17 Dubai Cable Co (DUCAB)
- 6.4.18 Gupta Power Infrastructure Ltd
- 6.4.19 Elsewedy Electric
- 6.4.20 Riyadh Cables Group
7 Market Opportunities & Future Outlook
- 7.1 White-space & unmet-need assessment


