


 |
市場調查報告書
商品編碼
2066396
半導體矽智慧財產權:市場佔有率分析、產業趨勢與統計、成長預測(2026-2031)Semiconductor Silicon Intellectual Property - Market Share Analysis, Industry Trends & Statistics, Growth Forecasts (2026 - 2031) |
||||||

※ 本網頁內容可能與最新版本有所差異。詳細情況請與我們聯繫。
根據 Mordor Intelligence 預測,半導體矽 IP 的市場規模預計將從 2025 年的 79 億美元成長到 2026 年的 83.9 億美元,然後從 2026 年到 2031 年以 6.2% 的複合年成長率成長,到 2031 年達到 113.3 億美元。
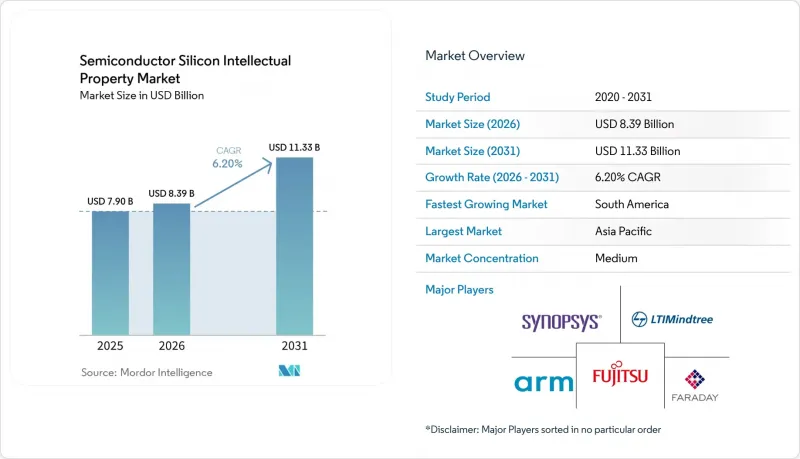
本報告依收入類型(授權和服務)、IP類型(處理器IP、有線介面IP和其他IP類型)、終端用戶產業(家用電子電器、電腦及周邊設備、汽車、工業和其他產業)、製程節點(28nm及以上、16/14nm、10/7nm和5nm及以下)以及地區進行細分。市場預測以美元計價。
全球半導體矽知識產權(IP)市場的趨勢與洞察。
物聯網連接設備的普及
隨著智慧電錶、穿戴式裝置和資產追蹤標籤的出貨量屢創新高,對低功耗處理器、無線收發器和感測器中心IP的需求也隨之激增。邊緣架構現在傾向於使用特定領域的模組,這些模組能夠在更靠近資料來源的位置執行即時推理,從而降低延遲和回程傳輸頻寬。提供包含微處理器(MPU)、射頻(RF)和安全元件IP的承包子系統的供應商正獲得設計上的廣泛認可,因為原始設備製造商(OEM)無需擴充內部團隊即可整合連接功能。對基於硬體的安全日益重視,推動了加密加速器和實體不可複製函數(PUF)種子的普及,尤其是在關鍵基礎設施面臨網路風險的領域。 2024年在智慧工廠和公共產業試點的概念驗證(PoC)計畫正在進入量產階段,預計這將使專用IP組合在未來幾年保持成長動能。
SoC 設計的複雜性日益增加,產品上市時間不斷縮短。
目前,頂級智慧型手機和汽車晶片整合了超過 50 個 IP 模組,這些模組跨越多個電壓島和非同步時脈域。在這種環境下協調檢驗會帶來進度風險,但大多數 OEM 廠商透過購買預先檢驗且具有公開安全測試的 IP 來降低這種風險。代工廠認證的變體旨在降低漏電流、變異性和電遷移,進一步縮短流片週期。供應商正在擴展其諮詢服務,涵蓋 RTL、實體實作和協同封裝設計。晶片組架構需要異質晶片才能在不同供應商之間互通,這進一步提升了符合 UCIe 2.0 規範的介面 IP 的價值。在這些模組化平台上加速晶片開發,使得 IP 重用不僅具有成本優勢,而且成為一種業務必然選擇。
高昂的初始授權成本和規模劣勢
部署高階處理器和SerDes IP所需的數百萬美元成本令新創公司和利基企業望而卻步,迫使它們依賴能較差的開放原始碼模組和老一代製程工藝。儘管收益分成和訂閱式授權模式正在興起,但它們仍然只佔少數,因為成熟的供應商憑藉其成熟的驗證檢驗維持著高價。將流行的IP核心從28nm移植到5nm通常會使工程成本翻倍,進一步拉大了頂級晶片製造商和小規模設計公司之間的差距。因此,市場進入障礙減緩了整體創新步伐,並可能抑制中型OEM廠商的潛在需求,直到替代授權框架得到廣泛應用。
細分市場分析
服務相關支付是半導體矽IP市場中成長最快的部分,預計到2031年將以8.12%的複合年成長率成長。這主要得益於晶片製造商將超出其內部處理能力的客製化、強化和調試工作外包出去。然而,到2025年,許可收入將佔銷售額的58.22%,而採用5nm以下工藝的客戶報告稱,許可後的工程工時激增,這使得服務捆綁合約更具吸引力。 IP供應商目前正在推廣包含持續性能調優、空中下載(OTA)安全補丁支援和晶片生命週期分析的平台訂閱服務。這些計劃有助於提高客戶留存率,並緩解與流片量相關的周期性波動。
這種轉變也緩解了通用核心面臨的價格壓力,尤其是在中階處理器和乙太網路IP領域。擁有大規模現場應用團隊的供應商正在利用整合諮詢作為提高利潤率的策略,以抵消因物聯網設備成本敏感型市場轉向而導致的單件專利使用費下降。混合收入模式正在產生穩定的現金流,並將供應商的獎勵與客戶的生產里程碑相協調,從而增強了服務在本世紀末佔據半導體矽IP市場更大佔有率的前景。
隨著 5G 基礎設施的擴展、Wi-Fi 7 的普及以及藍牙低功耗音訊技術的升級,無線介面 IP 的複合年成長率 (CAGR) 為 7.05%。整合多標準無線電功能的晶片製造商正在尋求符合全球認證要求的現成射頻、基頻和共存邏輯,以確保消費性設備的快速上市。儘管如此,到 2025 年,處理器 IP 仍將是最大的收入來源,佔比高達 45.88%,這主要得益於 CPU 核心在所有 SoC 中的廣泛應用。
RISC-V 的出現加劇了處理器 IP 領域的競爭,迫使現有企業透過整合 AI 加速和增強電源管理功能來擴大自身差異化優勢。同時,有線介面 IP 持續滿足資料中心和汽車產業的連接需求,並保持穩定的中個位數成長。安全性、記憶體控制器和類比 IP 構成了整體情況市場機遇,所有這些領域都受益於 SoC 晶片面積的不斷擴大以及需要專用子系統的專用應用設計的興起。
區域分析
預計到2025年,亞太地區將佔全球銷售額的52.14%,成為領先地區。這主要得益於中國、韓國、台灣和日本強大的製造業生態系統,以及支持半導體產業的經濟政策。與代工廠的聯合開發項目促進了設計規則和智慧財產權強化的密切合作,從而提高了該地區國內外產品組合的採用率。中國的自主研發政策推動了對RISC-V和安全智慧財產權的投資,而韓國的「K-半導體帶」則增強了對以記憶體為中心的介面模組的需求。日本則專注於汽車半導體和先進封裝,從而推動了對功能安全智慧財產權和晶片互連的需求成長。
北美作為主要智慧財產權授權者、超大規模資料中心晶片設計商和國防相關企業的樞紐,仍然至關重要。 《晶片專利法案》(CHIPS Act)為促進國內製造提供的獎勵,正在推動智慧財產權、電子設計自動化(EDA)和代工廠之間的合作,優先保障供應鏈的韌性。人工智慧新創企業的大量創業融資正在推動客製化加速器的快速原型製作,從而支持國內所有智慧財產權類別的需求。此外,加拿大不斷發展的量子運算生態系統正在成為低溫介面智慧財產權的一個細分客戶群。
儘管歐洲市場總銷售額小規模,但其在汽車電子、工業自動化和功率半導體領域的領先地位使其影響力倍增。歐盟《晶片法案》(CHIPS Act)提供的補貼正被用於尖端試驗生產線,從而刺激了對包含故障運行安全邏輯的7奈米以下IP的需求。同時,南美洲半導體矽IP市場預計將以8.24%的最高複合年成長率成長,這主要得益於巴西的本地化獎勵以及阿根廷的人才儲備吸引了眾多設計中心,並擴大了該地區對檢驗IP內核的需求。中東和非洲市場仍處於發展中階段,但政府主導的資料中心投資以及波灣合作理事會(GCC)邊緣人工智慧監控系統的部署,正展現出巨大的潛力,為未來的IP支出奠定了基礎。
其他好處:
- Excel格式的市場預測(ME)表
- 3個月的分析師支持
目錄
第1章:引言
- 研究假設和市場定義
- 調查範圍
第2章:調查方法
第3章執行摘要
第4章 市場狀況
- 市場概覽
- 市場促進因素
- 物聯網連接設備的普及
- SoC 設計的複雜性日益增加,產品上市時間不斷縮短。
- 嵌入邊緣設備的AI/ML加速器
- 商業上對檢驗的RISC-V CPU IP有需求
- 基於 Chiplet 和 UCIe 的異質整合
- 符合汽車功能安全標準(ISO 26262)
- 市場限制因素
- 高昂的初始許可成本和規模不經濟
- 專利使用費糾紛及專利訴訟風險
- 政府半導體主權計劃,有利於企業自主研發的智慧財產權。
- 安全漏洞正在削弱人們對第三方智慧財產權的信任。
- 價值鏈分析
- 監理情勢
- 技術展望
- 波特五力分析
第5章 市場規模與成長預測
- 按收入類型
- 執照
- 皇室
- 服務
- IP類型
- 處理器IP
- 有線介面 IP
- 無線介面 IP
- 其他 IP 類型
- 按最終用戶行業分類
- 家用電子產品
- 電腦及周邊設備
- 車
- 產業
- 其他行業
- 按行程節點
- 28奈米或更大
- 16/14 nm
- 10/7 nm
- 5奈米或更小
- 按地區
- 北美洲
- 美國
- 加拿大
- 墨西哥
- 歐洲
- 英國
- 德國
- 法國
- 義大利
- 其他歐洲國家
- 亞太地區
- 中國
- 日本
- 印度
- 韓國
- 其他亞洲國家
- 中東
- 以色列
- 沙烏地阿拉伯
- 阿拉伯聯合大公國
- 土耳其
- 其他中東國家
- 非洲
- 南非
- 埃及
- 其他非洲國家
- 南美洲
- 巴西
- 阿根廷
- 其他南美國家
- 北美洲
第6章 競爭情勢
- 市場集中度
- 策略趨勢
- 市佔率分析
- 公司簡介
- Arm Ltd.
- Synopsys Inc.
- Cadence Design Systems Inc.
- Faraday Technology Corp.
- Fujitsu Ltd.
- CEVA Inc.
- Andes Technology Corp.
- LTIMindtree Ltd.
- MediaTek Inc.
- Digital Media Professionals Inc.
- Imagination Technologies Ltd.
- VeriSilicon Holdings Co. Ltd.
- Achronix Semiconductor Corp.
- Rambus Inc.
- eMemory Technology Inc.
- MIPS Tech LLC
- SiFive Inc.
- Alphawave IP Group plc
- Arteris Inc.
- Flex Logix Technologies Inc.
第7章 市場機會與未來展望
According to Mordor Intelligence, the semiconductor silicon IP market size is expected to grow from USD 7.9 billion in 2025 to USD 8.39 billion in 2026 and is forecast to reach USD 11.33 billion by 2031 at 6.2% CAGR over 2026-2031.
This report is Segmented by Revenue Type (License, and Services), IP Type (Processor IP, Wired Interface IP, and Other IP Types), End-User Vertical (Consumer Electronics, Computers and Peripherals, Automotive, Industrial, and Other Verticals), Process Node (28 Nm and Above, 16/14 Nm, 10/7 Nm, 5 Nm and Below), and Geography. The Market Forecasts are Provided in Terms of Value (USD).
Global Semiconductor Silicon Intellectual Property Market Trends and Insights
Proliferation of IoT-Enabled Connected Devices
Record shipments of smart meters, wearables, and asset-tracking tags are driving a surge in low-power processor, wireless transceiver, and sensor-hub IP demand. Edge architectures now favor domain-specific blocks that execute real-time inference close to the data source, reducing latency and backhaul bandwidth. Vendors offering turnkey subsystems that bundle MPU, RF, and secure-element IP are capturing design wins because they enable OEMs to integrate connectivity without expanding their internal teams. Heightened emphasis on hardware-rooted security is driving up attachment rates for cryptographic accelerators and physically unclonable function seeds, particularly where critical infrastructure is exposed to cyber risk. Proof-of-concepts piloted in smart factories and utilities during 2024 are moving to volume production, sustaining a multiyear growth runway for specialized IP portfolios.
Complexity of SoC Designs and Shrinking Time-to-Market
Top-tier smartphone and automotive chips now integrate upward of 50 IP blocks, spanning multiple voltage islands and asynchronous clock domains. Coordinating verification across this landscape adds schedule risk that most OEMs mitigate by sourcing pre-verified IP with published safety artifacts. Foundry-qualified variants trimmed for leakage, variation, and electromigration further shorten tape-out cycles, prompting suppliers to expand consultancy services that cover RTL, physical implementation, and package co-design. Chiplet architectures amplify the value of interface IP, adhering to the UCIe 2.0 spec because heterogeneous dies must interoperate across vendor boundaries. Fast-tracking silicon on these modular platforms has turned IP reuse into an operational necessity rather than a cost preference.
High Upfront Licensing Costs and Scale Disadvantages
Multi-million-dollar entry fees for high-end processors or SerDes IP deter startups and niche players, forcing them toward less capable open-source blocks or older nodes. Revenue-sharing and subscription licensing models are emerging but remain a minority, as entrenched suppliers protect premium pricing tied to proven validation collateral. Porting a popular IP core from 28 nm to 5 nm frequently doubles engineering cost, further widening the gap between tier-one chipmakers and smaller design houses. Consequently, market entry barriers slow overall innovation velocity and may cap addressable demand among mid-volume OEMs until alternative licensing frameworks scale.
Other drivers and restraints analyzed in the detailed report include:
- AI and ML Accelerators Integrated into Edge Devices
- Commercial Demand for Verified RISC-V CPU IP
- Royalty Disputes and Patent-Litigation Exposure
For complete list of drivers and restraints, kindly check the Table Of Contents.
Segment Analysis
Service-related payments represent the fastest-growing portion of the Semiconductor silicon IP market, climbing at an 8.12% CAGR through 2031 as chipmakers outsource customization, hardening, and bring-up tasks that exceed their internal bandwidth. However, licenses controlled 58.22% of revenue in 2025, and customers deploying 5 nm and below reported a steep rise in post-license engineering hours, making bundled service contracts attractive. IP vendors now position platform subscriptions that include continuous performance tuning, over-the-air security patch support, and silicon lifecycle analytics. These programs enhance account stickiness and mitigate cyclical swings associated with tape-out volume.
The shift also cushions price pressure facing commodity cores, particularly in mid-range processor and Ethernet IP categories. Vendors with large field-application teams leverage integration consulting as a margin-enhancing strategy, offsetting declining per-unit royalties as volumes shift to cost-sensitive IoT devices. Hybrid revenue models spur recurring cash flows and align supplier incentives with customer production milestones, reinforcing the prospect that services could capture a larger slice of the Semiconductor silicon IP market size by the end of the decade.
Expanding 5G infrastructure, WiFi 7 adoption, and Bluetooth LE Audio upgrades are propelling wireless interface IP toward a 7.05% CAGR. Chipmakers integrating multi-standard radios seek ready-made RF, baseband, and coexistence logic that meets global certification requirements, allowing for consumer device launches on aggressive timelines. Processor IP nevertheless remained the single biggest revenue contributor at 45.88% in 2025, anchored by the ubiquity of CPU cores in every SoC.
Competitive intensity within processor IP has increased due to the entry of RISC-V entrants, prompting incumbents to widen their differentiators through integrated AI acceleration and power management enhancements. In parallel, wired interface IP continues to serve data center and automotive connectivity demands at stable mid-single-digit growth. Security, memory-controller, and analog IP round out the opportunity landscape, collectively benefiting from SoC silicon area inflation and the rise of application-specific designs that require specialized subsystems.
Geography Analysis
The Asia-Pacific region led global revenue with a 52.14% stake in 2025, driven by its deep manufacturing ecosystems in China, South Korea, Taiwan, and Japan, as well as supportive semiconductor stimulus packages. Foundry co-development programs foster close collaboration on design rules and IP hardening, thereby enhancing regional adoption rates for both domestic and international portfolios. China's self-reliance mandate propels investment into RISC-V and security IP, while South Korea's K-Semiconductor Belt strengthens demand for memory-centric interface blocks. Japan concentrates on automotive semiconductors and advanced packaging, adding traction for functional-safety IP and chiplet interconnects.
North America remains pivotal as home to major IP licensors, hyperscale data center chip designers, and defense contractors. The CHIPS Act's incentives for onshore fabrication encourage coordinated IP, EDA, and foundry engagements that prioritize supply chain resiliency. Strong venture funding for AI startups translates into rapid prototyping of custom accelerators, sustaining domestic demand across all IP categories. Canada's growing quantum-computing ecosystem also emerges as a niche customer segment for cryogenic interface IP.
Europe, though smaller in aggregate revenue, exerts outsized influence through leadership in automotive electronics, industrial automation, and power semiconductors. EU Chips Act subsidies are earmarked for state-of-the-art pilot lines, spurring requests for 7 nm and below IP with built-in fail-operational safety logic. Meanwhile, South America's Semiconductor silicon IP market is projected to post the highest 8.24% CAGR as Brazil's localization incentives and Argentina's talent base attract design centers, expanding regional consumption of verified IP cores. Middle East and Africa remain a nascent market but shows potential through sovereign datacenter investments and edge-AI surveillance rollouts in the Gulf Cooperation Council, laying groundwork for future IP spending.
- Arm Ltd.
- Synopsys Inc.
- Cadence Design Systems Inc.
- Faraday Technology Corp.
- Fujitsu Ltd.
- CEVA Inc.
- Andes Technology Corp.
- LTIMindtree Ltd.
- MediaTek Inc.
- Digital Media Professionals Inc.
- Imagination Technologies Ltd.
- VeriSilicon Holdings Co. Ltd.
- Achronix Semiconductor Corp.
- Rambus Inc.
- eMemory Technology Inc.
- MIPS Tech LLC
- SiFive Inc.
- Alphawave IP Group plc
- Arteris Inc.
- Flex Logix Technologies Inc.
Additional Benefits:
- The market estimate (ME) sheet in Excel format
- 3 months of analyst support
TABLE OF CONTENTS
1 INTRODUCTION
- 1.1 Study Assumptions and Market Definition
- 1.2 Scope of the Study
2 RESEARCH METHODOLOGY
3 EXECUTIVE SUMMARY
4 MARKET LANDSCAPE
- 4.1 Market Overview
- 4.2 Market Drivers
- 4.2.1 Proliferation of IoT-enabled connected devices
- 4.2.2 Complexity of SoC designs and shrinking time-to-market
- 4.2.3 AI/ML accelerators integrated into edge devices
- 4.2.4 Commercial demand for verified RISC-V CPU IP
- 4.2.5 Chiplet and UCIe-based heterogeneous integration
- 4.2.6 Automotive functional-safety (ISO 26262) compliance
- 4.3 Market Restraints
- 4.3.1 High upfront licensing costs and scale disadvantages
- 4.3.2 Royalty disputes and patent-litigation exposure
- 4.3.3 Government chip-sovereignty programs favouring in-house IP
- 4.3.4 Security vulnerabilities eroding third-party IP trust
- 4.4 Value-Chain Analysis
- 4.5 Regulatory Landscape
- 4.6 Technological Outlook
- 4.7 Porter's Five Forces Analysis
- 4.7.1 Bargaining Power of Suppliers
- 4.7.2 Bargaining Power of Buyers
- 4.7.3 Threat of New Entrants
- 4.7.4 Threat of Substitute Products
- 4.7.5 Intensity of Competitive Rivalry
5 MARKET SIZE AND GROWTH FORECASTS (VALUE)
- 5.1 By Revenue Type
- 5.1.1 License
- 5.1.2 Royalty
- 5.1.3 Services
- 5.2 By IP Type
- 5.2.1 Processor IP
- 5.2.2 Wired Interface IP
- 5.2.3 Wireless Interface IP
- 5.2.4 Other IP Types
- 5.3 By End-User Vertical
- 5.3.1 Consumer Electronics
- 5.3.2 Computers and Peripherals
- 5.3.3 Automotive
- 5.3.4 Industrial
- 5.3.5 Other Verticals
- 5.4 By Process Node
- 5.4.1 28 nm and Above
- 5.4.2 16/14 nm
- 5.4.3 10/7 nm
- 5.4.4 5 nm and Below
- 5.5 By Geography
- 5.5.1 North America
- 5.5.1.1 United States
- 5.5.1.2 Canada
- 5.5.1.3 Mexico
- 5.5.2 Europe
- 5.5.2.1 United Kingdom
- 5.5.2.2 Germany
- 5.5.2.3 France
- 5.5.2.4 Italy
- 5.5.2.5 Rest of Europe
- 5.5.3 Asia-Pacific
- 5.5.3.1 China
- 5.5.3.2 Japan
- 5.5.3.3 India
- 5.5.3.4 South Korea
- 5.5.3.5 Rest of Asia
- 5.5.4 Middle East
- 5.5.4.1 Israel
- 5.5.4.2 Saudi Arabia
- 5.5.4.3 United Arab Emirates
- 5.5.4.4 Turkey
- 5.5.4.5 Rest of Middle East
- 5.5.5 Africa
- 5.5.5.1 South Africa
- 5.5.5.2 Egypt
- 5.5.5.3 Rest of Africa
- 5.5.6 South America
- 5.5.6.1 Brazil
- 5.5.6.2 Argentina
- 5.5.6.3 Rest of South America
- 5.5.1 North America
6 COMPETITIVE LANDSCAPE
- 6.1 Market Concentration
- 6.2 Strategic Moves
- 6.3 Market Share Analysis
- 6.4 Company Profiles (includes Global level Overview, Market level overview, Core Segments, Financials as available, Strategic Information, Market Rank/Share for key companies, Products and Services, and Recent Developments)
- 6.4.1 Arm Ltd.
- 6.4.2 Synopsys Inc.
- 6.4.3 Cadence Design Systems Inc.
- 6.4.4 Faraday Technology Corp.
- 6.4.5 Fujitsu Ltd.
- 6.4.6 CEVA Inc.
- 6.4.7 Andes Technology Corp.
- 6.4.8 LTIMindtree Ltd.
- 6.4.9 MediaTek Inc.
- 6.4.10 Digital Media Professionals Inc.
- 6.4.11 Imagination Technologies Ltd.
- 6.4.12 VeriSilicon Holdings Co. Ltd.
- 6.4.13 Achronix Semiconductor Corp.
- 6.4.14 Rambus Inc.
- 6.4.15 eMemory Technology Inc.
- 6.4.16 MIPS Tech LLC
- 6.4.17 SiFive Inc.
- 6.4.18 Alphawave IP Group plc
- 6.4.19 Arteris Inc.
- 6.4.20 Flex Logix Technologies Inc.
7 MARKET OPPORTUNITIES AND FUTURE OUTLOOK
- 7.1 White-space and Unmet-Need Assessment

 半導體智慧財產權市場-2026-2032年全球市場預測
 半導體IP市場預測至2034年-按IP類型、設計IP類別、授權模式、應用、最終使用者和地區分類的全球分析
 半導體智慧財產權(IP)市場:依設計IP類型、IP核心類型、收入模式、應用、國家及地區分類-產業分析、市場規模、市場佔有率及2026年至2033年預測
 全球半導體IP市場(至2032年):依設計IP(運算IP、介面IP、記憶體IP、安全IP)、IP核(軟IP、硬IP)、IP來源(授權、版稅)、IP用戶、架構(ARM、x86、RISC-V)、產業及地區分類半導體智慧財產權市場預測至2034年-按智慧財產權類型、核心類型、授權模式、應用、最終用戶和地區分類的全球分析
 半導體智慧財產權市場報告:按智慧財產權類型、收入來源、智慧財產權核心、應用、最終用戶產業和地區分類(2026-2034 年)
 半導體 IP 市場機會、成長要素、產業趨勢分析及 2026-2035 年預測。
 半導體IP市場規模、佔有率、成長及全球產業分析:按類型、應用和地區的洞察,2026-2034年的預測
 2026年全球半導體智慧財產權市場報告
 半導體智慧財產權市場:依設計智慧財產權、收入來源、IP核心、最終用戶、產業和地區分類