


 |
市場調查報告書
商品編碼
2066388
機器狀態監測:市場佔有率分析、產業趨勢與統計、成長預測(2026-2031)Machine Condition Monitoring - Market Share Analysis, Industry Trends & Statistics, Growth Forecasts (2026 - 2031) |
||||||
※ 本網頁內容可能與最新版本有所差異。詳細情況請與我們聯繫。
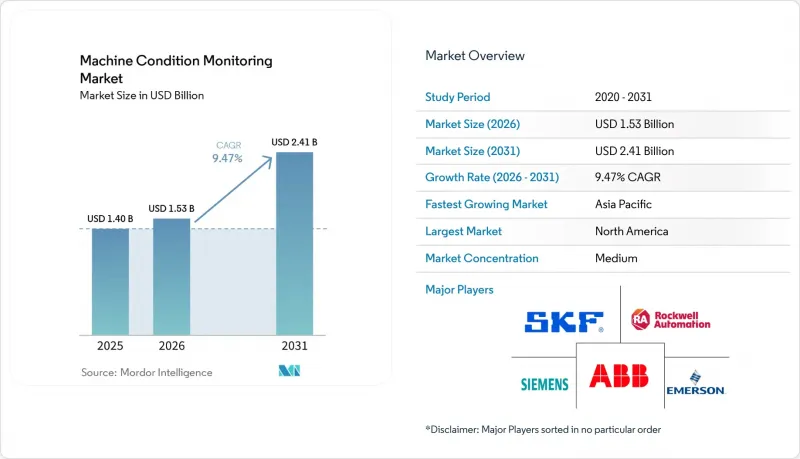
據 Mordor Intelligence 稱,2025 年機器狀態監測市場價值為 14 億美元,預計到 2031 年將達到 24.1 億美元,而 2026 年為 15.3 億美元,預測期(2026-2031 年)的複合年成長率為 9.47%。
本報告以「類型」(硬體[振動監測設備、熱成像設備等]、軟體、服務)、「最終用戶產業」(石油和天然氣、發電等)和「地區」(北美[美國、加拿大]、歐洲[英國、德國、法國]、亞洲[中國、日本、印度]等)對產業進行分類。
全球機器狀態監測市場趨勢與洞察
專注於預測性維護以減少意外停機時間
在製造業,意外停機每年造成高達500億美元的損失,促使企業從基於定期檢查的維護方式轉向預測性維護,後者可將停機時間減少20%至50%,並將維護成本降低5%至10%。機器學習演算法利用來自多個感測器的資料流,提前數週識別故障,使團隊能夠在計劃停機期間進行干預。汽車工廠已取得一些成功案例,例如寶馬和特斯拉利用即時分析延長了設備的使用壽命。數位雙胞胎模型透過模擬磨損場景和最佳化零件採購來改善維護計劃。
實施工業4.0邊緣分析平台
邊緣處理技術允許在感測器節點進行分析,從而消除延遲,即使在網路故障期間也能保持資訊暢通。意法半導體 (STMicroelectronics) 的微控制器專為需要亞秒檢測的狀態監控應用而設計。西門子的 SIMOCODE M-CP 透過單對乙太網路將監控功能整合到馬達控制中心,減少了佈線,並將診斷功能擴展到更小的馬達。早期用戶報告稱,該技術實現了毫秒級異常檢測,頻寬最多可降低 50%。
舊棕地資產的維修成本
老舊設施往往缺乏足夠的感測器安裝點和網路骨幹網,這需要進行設計變更、安全批准以及分階段停機,停機時間可能長達18個月或更久。美國海軍陸戰隊指出,相互衝突的傳統政策是實施「基於狀態的維修升級版」(Condition Based Maintenance Plus)的一大障礙,民用加工廠也面臨著同樣的挑戰。雖然無線設備減輕了佈線負擔,但危險區域的電源供應和認證仍然需要大量預算,因此企業會根據專案的重要性分階段推進。
細分市場分析
到2025年,硬體銷售額將佔總銷售額的44.40%,凸顯了感測器、閘道器和資料擷取單元在所有安裝環境中發揮的關鍵作用。微電子機械系統 (MEMS) 的穩定發展正推動這項業務板塊的成長,MEMS 技術在提高靈敏度的同時降低了功耗。西門子透過在 SIMOCODE M-CP 中整合硬體和授權分析模組,簡化了配電盤使用者的部署流程。隨著製造商將全天候監控業務外包,業務收益也不斷成長。與 SKF 和 LKAB 簽訂的價值 6000 萬美元的合約將振動測量和遠距離診斷納入了多年期協議。
無線工業物聯網感測器網路預計將以每年 12.22% 的速度成長,這反映了客戶對便利維修的偏好。隨著部署規模的擴大,整合平台正在將原始資料流轉化為維護請求,從而產生持續的 SaaS 收入。這些因素共同為現有企業創造了新的收入來源:分析服務訂閱,同時維持規模經濟效益。
即使到了2025年,振動分析仍維持著33.75%的市佔率。從業人員依賴龐大的旋轉機械故障特徵庫,而設備製造商則透過將加速計與產品捆綁銷售來增強網路效應。隨著工廠優先考慮軸承故障的早期檢測和壓縮空氣洩漏的識別,即使在高噪音環境下,超音波發射市場預計將以每年11.62%的速度成長。
在穿戴式裝置(例如Teledyne-FLIR與RealWear的合作)的整合以及人工智慧在雲端儀錶板上檢測熱異常的日益普及的支援下,熱成像技術的應用日益廣泛。馬達電流特徵和油液分析完善了多模態檢測方案,提高了診斷可靠性,並擴展了其在電氣和潤滑系統中的應用範圍。
區域分析
到2025年,北美將佔全球銷售額的32.10%,這得益於嚴格的安全標準和工業4.0的早期應用。美國證券交易委員會(SEC)的排放報告和加州的SB 253法案正推動企業進行持續的效率評估。成熟的部署基礎進一步加速了邊緣感測器的升級週期。
亞太地區預計將以每年9.78%的速度成長。中國和印度對智慧製造的補貼正在降低初始成本,而日本感測器創新中心則在2024年IEEE感測器大會上展示了其專業技術。隨著電池、半導體和可再生能源設備工廠的快速擴張,預測性維護正從規劃階段就被納入考量。
在歐洲,ESG框架正被用於論證投資的合理性;在中東,大型企劃正在建立相應的監測系統;在拉丁美洲,新的成長點正在湧現,例如礦業公司正在推進輸送機系統的數位化,水力發電廠也在提高可靠性。
其他好處:
- Excel格式的市場預測(ME)表
- 3個月的分析師支持
目錄
第1章:引言
- 研究假設和市場定義
- 調查範圍
第2章:調查方法
第3章執行摘要
第4章 市場狀況
- 市場概覽
- 市場促進因素
- 專注於預測性維護,以減少意外停機時間。
- 工業4.0邊緣分析平台的實施
- 新興亞洲資產密集產業的快速成長
- 無線工業物聯網感測器可顯著降低整體擁有成本
- 為實現節能型工廠運營,ESG(環境、社會和治理)原則發揮了重要作用。
- 軍事和航太計畫需要零容錯能力。
- 市場限制因素
- 現有棕地資產的維修成本
- 振動分析專家短缺
- 始終在線系統中的網路安全問題
- 貿易壁壘上升限制硬體供應鏈
- 價值供應鏈分析
- 監理情勢
- 技術展望
- 波特五力模型
第5章 市場規模與成長預測
- 報價
- 硬體
- 軟體
- 服務
- 透過監測方法
- 振動分析
- 熱成像
- 超音波輻射
- 潤滑油分析
- 馬達電流特徵
- 腐蝕和磨損碎屑
- 其他方法
- 不同的發展
- 線上/連續系統
- 可攜式/週期性測量設備
- 無線工業物聯網感測器網路
- 按最終用戶行業分類
- 石油和天然氣
- 發電
- 金屬和採礦
- 化工/石油化工
- 汽車和運輸業
- 航太/國防
- 食品/飲料
- 海上
- 其他行業
- 按地區
- 北美洲
- 美國
- 加拿大
- 南美洲
- 巴西
- 阿根廷
- 歐洲
- 德國
- 英國
- 法國
- 俄羅斯
- 亞洲
- 中國
- 日本
- 印度
- 韓國
- 中東和非洲
- 中東
- 沙烏地阿拉伯
- UAE
- 非洲
- 南非
- 中東
- 北美洲
第6章 競爭情勢
- 市場集中度
- 策略趨勢
- 市佔率分析
- 公司簡介
- SKF AB
- Emerson Electric Co.(Bently Nevada)
- Rockwell Automation Inc.
- ABB Ltd.
- Siemens AG
- Meggitt PLC
- Bruel and Kjaer Vibro
- Fluke Corporation
- FLIR Systems Inc.
- Parker Hannifin Corp.(Kittiwake)
- AMETEK Inc.(Spectro Scientific)
- Thermo Fisher Scientific Inc.
- Bentley Nevada(Baker Hughes)
- Schaeffler Group
- Azima DLI
- Honeywell International Inc.
- National Instruments Corp.
- Schneider Electric SE
- Gastops Ltd.
- Wilcoxon Sensing Technologies
第7章 市場機會與未來展望
According to Mordor Intelligence, the machine condition monitoring market size was valued at USD 1.4 billion in 2025 and estimated to grow from USD 1.53 billion in 2026 to reach USD 2.41 billion by 2031, at a CAGR of 9.47% during the forecast period (2026-2031).
This report Segments the Industry Into Type (Hardware [Vibration Condition Monitoring Equipment, Thermography Equipment, and More], Software, Services), End User Industry (Oil and Gas, Power Generation, and More), and Geography (North America [United States, Canada], Europe [United Kingdom, Germany, France], Asia [China, Japan, India], and More).
Global Machine Condition Monitoring Market Trends and Insights
Predictive-maintenance focus to cut unplanned downtime
Manufacturing operations lose USD 50 billion each year to surprise stoppages, so firms are replacing calendar-based servicing with predictive approaches that trim downtime by 20-50% and maintenance spend by 5-10% . Machine-learning algorithms draw on multi-sensor data streams to pinpoint failures weeks ahead, letting teams intervene during scheduled pauses. Automotive plants show success as BMW and Tesla extend equipment life cycles using real-time analytics . Digital twin models refine schedules by simulating wear scenarios and optimizing parts procurement.
Adoption of industry 4.0 edge-analytics platforms
Edge processing moves analytics to the sensor node, eliminating latency while maintaining insight during network outages. STMicroelectronics positions its microcontrollers for condition monitoring use cases that require sub-second detection . Siemens' SIMOCODE M-CP embeds monitoring within motor control centers via Single Pair Ethernet, trimming wiring effort and extending diagnostics to smaller motors . Early adopters report millisecond-level anomaly detection and bandwidth cuts of up to 50%.
Retrofit cost for legacy brown-field assets
Older facilities rarely feature sensor mounts or network backbones, so rollout involves engineering changes, safety approvals, and staged shutdowns that can stretch over 18 months. The US Marine Corps flagged conflicting legacy policies as barriers during Condition Based Maintenance Plus adoption, echoing similar struggles in civilian process plants. Wireless devices ease wiring pain yet power delivery and hazardous-area certification still raise budgets, prompting firms to phase projects by criticality.
Other drivers and restraints analyzed in the detailed report include:
- Surging Asset-intensive sectors in emerging Asia
- Wireless IIoT sensors slashing total cost of ownership
- ESG-driven push for energy-efficient plant operations
- Shortage of vibration-analysis specialists
For complete list of drivers and restraints, kindly check the Table Of Contents.
Segment Analysis
Hardware claimed 44.40% of 2025 revenue, underscoring the indispensable role of sensors, gateways, and acquisition units in every installation. This segment benefits from steady advances in micro-electromechanical systems that boost sensitivity while lowering power draw. Siemens blended hardware with licensable analytics modules in its SIMOCODE M-CP to simplify adoption for switchboard users . Services revenue expands as manufacturers outsource round-the-clock surveillance; SKF's USD 60 million agreement with LKAB packages vibration measurements and remote diagnostics into a multi-year contract.
Wireless IIoT sensor networks are forecast to grow at 12.22% annually, underlining customer preference for low-touch retrofits. As adoption broadens, integrated platforms convert raw streams into maintenance tickets, creating recurring SaaS income. These factors collectively preserve scale benefits for incumbents while introducing fresh margin pools in analytics subscriptions.
Vibration analysis retained 33.75% share in 2025. Practitioners trust its rich fault signature library for rotating assets, and equipment makers bundle accelerometers at purchase, reinforcing network effects. Ultrasound emission is projected to expand 11.62% per year as plants value early bearing fault detection and compressed-air leak identification even in high-noise areas.
Thermography adoption rises with AI that flags thermal anomalies in cloud dashboards, aided by wearable integrations like the Teledyne FLIR and RealWear partnership. Motor current signature and oil analysis round out multi-modal suites that boost diagnostic confidence and extend reach into electrical and lubrication systems.
Geography Analysis
North America held 32.10% of 2025 revenue, sustained by stringent safety codes and early Industry 4.0 rollouts. SEC emissions reporting and California SB 253 guide firms toward continuous efficiency measurement . Mature installed bases further encourage upgrade cycles to edge-capable sensors.
Asia-Pacific is poised for 9.78% annual growth. Smart-manufacturing subsidies in China and India defray upfront costs, while Japan's sensor innovation hub showcases domain expertise at IEEE SENSORS 2024 . Rapid expansion of battery, semiconductor, and renewable-equipment factories embeds predictive maintenance from conception.
Europe leverages ESG frameworks to justify investment, and the Middle East aligns monitoring with oil and gas mega-projects. Latin America records emerging growth as miners digitalize conveyor fleets and hydro plants seek reliability uplift.
- SKF AB
- Emerson Electric Co. (Bently Nevada)
- Rockwell Automation Inc.
- ABB Ltd.
- Siemens AG
- Meggitt PLC
- Bruel and Kjaer Vibro
- Fluke Corporation
- FLIR Systems Inc.
- Parker Hannifin Corp. (Kittiwake)
- AMETEK Inc. (Spectro Scientific)
- Thermo Fisher Scientific Inc.
- Bentley Nevada (Baker Hughes)
- Schaeffler Group
- Azima DLI
- Honeywell International Inc.
- National Instruments Corp.
- Schneider Electric SE
- Gastops Ltd.
- Wilcoxon Sensing Technologies
Additional Benefits:
- The market estimate (ME) sheet in Excel format
- 3 months of analyst support
TABLE OF CONTENTS
1 INTRODUCTION
- 1.1 Study Assumptions & Market Definition
- 1.2 Scope of the Study
2 RESEARCH METHODOLOGY
3 EXECUTIVE SUMMARY
4 MARKET LANDSCAPE
- 4.1 Market Overview
- 4.2 Market Drivers
- 4.2.1 Predictive-maintenance focus to cut unplanned downtime
- 4.2.2 Adoption of Industry 4.0 edge-analytics platforms
- 4.2.3 Surging asset-intensive sectors in emerging Asia
- 4.2.4 Wireless IIoT sensors slashing total cost of ownership
- 4.2.5 ESG-driven push for energy-efficient plant operations
- 4.2.6 Military & space programs requiring zero-fault tolerance (under-the-radar)
- 4.3 Market Restraints
- 4.3.1 Retrofit cost for legacy brown-field assets
- 4.3.2 Shortage of vibration-analysis specialists
- 4.3.3 Cyber-security concerns in always-connected systems
- 4.3.4 Rising trade barriers limiting hardware supply chains (under-the-radar)
- 4.4 Value / Supply-Chain Analysis
- 4.5 Regulatory Landscape
- 4.6 Technological Outlook
- 4.7 Porter's Five Forces
- 4.7.1 Threat of New Entrants
- 4.7.2 Bargaining Power of Buyers
- 4.7.3 Bargaining Power of Suppliers
- 4.7.4 Threat of Substitutes
- 4.7.5 Intensity of Competitive Rivalry
5 MARKET SIZE & GROWTH FORECASTS
- 5.1 By Offering
- 5.1.1 Hardware
- 5.1.2 Software
- 5.1.3 Services
- 5.2 By Monitoring Technique
- 5.2.1 Vibration Analysis
- 5.2.2 Thermography
- 5.2.3 Ultrasound Emission
- 5.2.4 Lubricating-Oil Analysis
- 5.2.5 Motor-Current Signature
- 5.2.6 Corrosion & Wear Debris
- 5.2.7 Other Techniques
- 5.3 By Deployment
- 5.3.1 Online/Continuous Systems
- 5.3.2 Portable/Periodic Instruments
- 5.3.3 Wireless IIoT Sensor Networks
- 5.4 By End-user Industry
- 5.4.1 Oil & Gas
- 5.4.2 Power Generation
- 5.4.3 Metals & Mining
- 5.4.4 Chemicals & Petrochemicals
- 5.4.5 Automotive & Transportation
- 5.4.6 Aerospace & Defense
- 5.4.7 Food & Beverage
- 5.4.8 Marine
- 5.4.9 Other Industries
- 5.5 By Geography
- 5.5.1 North America
- 5.5.1.1 United States
- 5.5.1.2 Canada
- 5.5.2 South America
- 5.5.2.1 Brazil
- 5.5.2.2 Argentina
- 5.5.3 Europe
- 5.5.3.1 Germany
- 5.5.3.2 United Kingdom
- 5.5.3.3 France
- 5.5.3.4 Russia
- 5.5.4 Asia
- 5.5.4.1 China
- 5.5.4.2 Japan
- 5.5.4.3 India
- 5.5.4.4 South Korea
- 5.5.5 Middle East & Africa
- 5.5.5.1 Middle East
- 5.5.5.1.1 Saudi Arabia
- 5.5.5.1.2 UAE
- 5.5.5.2 Africa
- 5.5.5.2.1 South Africa
- 5.5.5.1 Middle East
- 5.5.1 North America
6 COMPETITIVE LANDSCAPE
- 6.1 Market Concentration
- 6.2 Strategic Moves
- 6.3 Market Share Analysis
- 6.4 Company Profiles (includes Global level Overview, Market level overview, Core Segments, Financials as available, Strategic Information, Market Rank/Share for key companies, Products & Services, and Recent Developments)
- 6.4.1 SKF AB
- 6.4.2 Emerson Electric Co. (Bently Nevada)
- 6.4.3 Rockwell Automation Inc.
- 6.4.4 ABB Ltd.
- 6.4.5 Siemens AG
- 6.4.6 Meggitt PLC
- 6.4.7 Bruel and Kjaer Vibro
- 6.4.8 Fluke Corporation
- 6.4.9 FLIR Systems Inc.
- 6.4.10 Parker Hannifin Corp. (Kittiwake)
- 6.4.11 AMETEK Inc. (Spectro Scientific)
- 6.4.12 Thermo Fisher Scientific Inc.
- 6.4.13 Bentley Nevada (Baker Hughes)
- 6.4.14 Schaeffler Group
- 6.4.15 Azima DLI
- 6.4.16 Honeywell International Inc.
- 6.4.17 National Instruments Corp.
- 6.4.18 Schneider Electric SE
- 6.4.19 Gastops Ltd.
- 6.4.20 Wilcoxon Sensing Technologies
7 MARKET OPPORTUNITIES & FUTURE OUTLOOK
- 7.1 White-space & Unmet-need Assessment
 機器狀態監測市場:2026-2032年全球市場預測(依服務類型、監控技術、機器類型、最終用戶和部署模式分類)
 機械狀態監測市場報告:按監測技術、交付方式、部署方式、最終用戶產業和地區分類(2026-2034 年)
 機器狀態監控市場分析及預測(至2035年):依類型、產品類型、服務、技術、組件、應用、部署模式、最終用戶、設備及解決方案分類
 機器狀態監控市場:按產品、部署方式、最終用戶產業和地區分類
 設施監控市場規模、佔有率和成長分析(按監控類型、部署類型、垂直產業和地區分類)-2026-2033年產業預測
 全球機器狀態監測市場規模、佔有率、趨勢和成長分析報告(2026-2034年)
 2026年全球機器狀態監測市場報告
 設施監控市場 - 全球產業規模、佔有率、趨勢、機會及預測(按監控類型、監控流程、最終用戶、地區和競爭格局分類,2021-2031年)
 機器狀態監測市場規模、佔有率和趨勢分析報告:按監測技術、組件、產品、應用、架構、工廠、監控過程、最終用途、地區和細分市場預測(2026-2033 年)機器狀態監測市場規模、佔有率、成長及全球產業分析:依類型、應用和地區劃分的洞察與預測(2026-2034)