


 |
市場調查報告書
商品編碼
2065768
創新管理:市場佔有率分析、產業趨勢與統計、成長預測(2026-2031)Innovation Management - Market Share Analysis, Industry Trends & Statistics, Growth Forecasts (2026 - 2031) |
||||||

※ 本網頁內容可能與最新版本有所差異。詳細情況請與我們聯繫。
根據 Mordor Intelligence 估計,到 2026 年,創新管理市場價值將達到 35.7 億美元,高於 2025 年的 30.6 億美元,預計到 2031 年將達到 77 億美元。
預計 2026 年至 2031 年的複合年成長率為 16.62%。
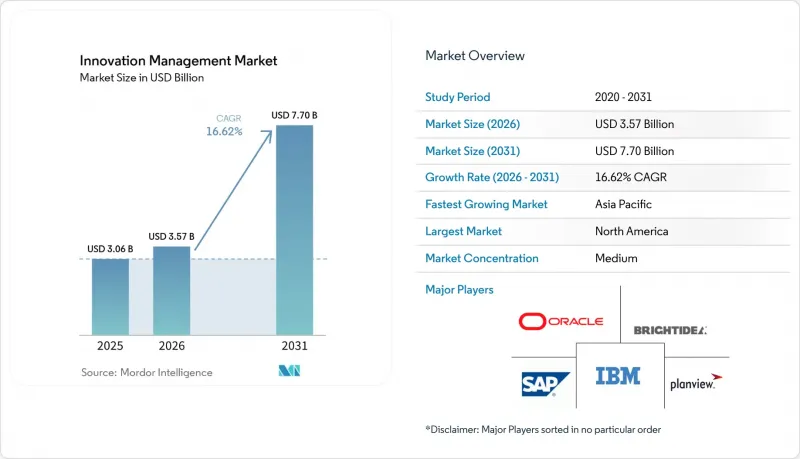
本報告按產品/服務(解決方案和服務)、最終用戶公司規模(大型企業和中小企業)、部署類型(雲端和本地部署)、應用領域(專案管理平台、行銷平台等)、最終用戶行業(銀行、金融服務和保險、醫療保健等)以及地區進行細分。市場預測以美元計價。
全球創新管理市場趨勢與洞察
跨產業數位轉型進展
創新管理市場的數位轉型措施正迫使企業用整合的編配取代孤立的提案,這些框架融合了分析和工作流程編排功能。主管們越來越重視可靠的人工智慧,將其視為可擴展轉型的先決條件,77%的領導者強調需要高度透明的系統。製造企業正在將工業4.0感測器和分析技術整合到其創新套件中,在降低安全事故高達50%的同時,也提高了員工的參與度。以員工為中心的設計方法正在為那些能夠消除根深蒂固的文化障礙、並在各個層級普及創意生成的平台創造空間。
增加企業研發預算
隨著創新管理市場研發投入的不斷成長,對能夠追蹤從投資到商業化成果全過程的管治工具的需求也日益迫切。Oracle在2023會計年度投資86億美元,專注於改善現有產品和探索新技術,凸顯了大規模研發和結構化創新流程的重要性。顧問巨頭Accenture每年投入12億美元探索實驗室,11億美元用於員工技能發展,使其人力資本計畫與平台主導的創新追蹤機制相契合。金融服務公司也紛紛效仿,增加人工智慧和雲端運算預算,在競爭日益激烈的環境中保障收入來源。
多租戶整合的複雜性
企業在尋求成本效益和客製化解決方案之間取得平衡時,常常發現將雲端創新套件連接到數十個舊舊有系統會對內部 IT 資源造成巨大壓力。 ServiceNow 的多實例架構清楚地展現了這種權衡:雖然隔離性增強,但協調升級的負擔也隨之加重。保險公司和製造商正努力應對跨租戶的身分管理、資料映射和合規性測試,這導致對專業整合合作夥伴的需求日益成長。
細分市場分析
到2025年,解決方案將佔據創新管理市場佔有率的67.92%,顯示買家更傾向於整合平台,這類平台能夠在單一使用者體驗中整合創意產生、階段性管治和投資組合分析等功能。捆綁式人工智慧模型、低程式碼工作流程建構器和預先建置的API連接器不斷提升一體化套件的標準。專業服務雖然規模較小,但正以19.12%的複合年成長率保持強勁成長,因為企業正在尋求變革管理、演算法調優和整合工作流程的諮詢支援。Accenture諮詢部門公佈的季度營收為50.68億美元,顯示市場對專家實施服務的需求強勁,以確保轉型項目按計畫進行。
對實施後最佳化的需求也在推動服務業的發展。持續改進的維護協議涵蓋新功能部署、員工培訓更新和績效基準測試。隨著多租戶功能的加速發布,企業正與平台合作夥伴簽訂契約,以調整創新KPI,並確保最新的分析模型與不斷變化的戰略目標保持一致。這一趨勢正在使託管服務供應商成為在平台生命週期內保持創新步伐的關鍵合作夥伴。
到2025年,大型企業將佔據創新管理市場58.05%的佔有率,它們將利用專案研發預算和內部架構團隊,整合產品生命週期、人力資源和客戶體驗系統等各環節的套件。然而,中小企業仍是最具活力的細分市場,由於訂閱定價、承包雲部署和引導式入職培訓等方式降低了傳統准入門檻,其複合年成長率高達21.05%。創新管理市場正透過模板庫、無程式碼整合和人工智慧驅動的藍圖創建工具,幫助中小企業應對預算上限和人才短缺等挑戰。
區域政策獎勵進一步促進了中小企業採用新技術。歐盟為數位化計畫提供津貼,北美開發銀行則為雲端遷移提供資金擔保。為了彌合能力差距,供應商正在整合虛擬輔導和社群論壇,讓跨職能團隊參與其中,共用最佳實踐,以培養分散式創意生成文化。這種全面的支援正在縮短採用時間,並提高資源受限企業的平台採用率。
區域分析
預計到2025年,北美將佔據創新管理市場38.22%的佔有率,這得益於其成熟的企業軟體生態系統、充裕的創業投資資金以及高管們對結構化創意生成流程的廣泛認可。微軟宣布2024年營收將達到2,450億美元(年成長16%),證實了其持續投資週期——優先發展創新套件以最佳化產品和服務線——已初見成效。美國聯邦政府的雲端支出在八年內成長了五倍,進一步鞏固了政府機構和受監管產業對雲端託管創新平台的採用。加拿大和墨西哥雖然絕對支出較低,但在製造業、自然資源和金融科技領域的應用正在推動區域發展勢頭。
亞太地區是成長最快的地區,預計到2031年將以22.1%的複合年成長率成長。中國、澳洲和東南亞的企業正在跨越傳統IT基礎設施,採用「行動優先」和「雲端原生」的創新架構,以適應超級應用文化和無現金經濟的發展。國內人工智慧模型部署工作和資料在地化法規正在刺激對區域最佳化創新套件的需求。日本和韓國正在協調先進的數位基礎設施與嚴格的合規要求,並專注於主權雲端和智慧財產權保護控制。本地系統整合商和超大規模資料中心業者供應商正與平台供應商合作,提供針對製造業、電子業和公共部門等應用場景量身定做的垂直整合解決方案。
在歐洲,受更嚴格的環境資訊揭露法規和隱私相關法規(例如GDPR)的推動,SaaS平台正穩步擴張。歐盟的《企業永續性報告指令》鼓勵企業將ESG(環境、社會和治理)查核點納入其創新工作流程,從而增強了可審計平台的商業價值。各國雲端主權政策傾向本地資料中心和加密程序。英國、德國和法國主導SaaS平台的普及,而南歐和東歐國家則隨著更廣泛的數位經濟升級而穩步推進。南美、中東和非洲仍處於發展中地區,基礎設施差異和投資重點可能會減緩平台普及速度,但在地化的SaaS定價和政府主導的數位化措施正在逐步改善這些地區的市場准入。
其他好處:
- Excel格式的市場預測(ME)表
- 3個月的分析師支持
目錄
第1章:引言
- 研究假設和市場定義
- 調查範圍
第2章:調查方法
第3章執行摘要
第4章 市場狀況
- 市場概覽
- 市場促進因素
- 各行各業都在進行數位轉型。
- 企業研發預算增加
- 雲端優先採購政策
- 擴展開放式創新生態系統
- 人工智慧驅動的創意品質評估
- 強制性永續發展相關創新目標
- 市場限制因素
- 多租戶整合的複雜性
- 對資料主權和智慧財產權外洩的擔憂。
- 組織文化的慣性
- 創意排名引擎中的演算法偏見
- 價值鏈分析
- 監理情勢
- 技術展望
- 波特五力分析
第5章 市場規模與成長預測
- 依產品
- 解決方案
- 服務
- 按最終用戶公司規模分類
- 大公司
- 中小企業
- 不同的發展
- 雲
- 現場
- 透過使用
- 專案管理平台
- 行銷平台
- 設計平台
- 人力資源平台
- 其他平台
- 最終用戶
- BFSI
- 衛生保健
- 資訊科技/通訊
- 媒體與娛樂
- 政府
- 其他最終用戶
- 按地區
- 北美洲
- 美國
- 加拿大
- 墨西哥
- 南美洲
- 巴西
- 阿根廷
- 其他南美國家
- 歐洲
- 英國
- 德國
- 法國
- 義大利
- 西班牙
- 俄羅斯
- 其他歐洲國家
- 亞太地區
- 中國
- 印度
- 日本
- 韓國
- 澳洲和紐西蘭
- 東南亞
- 其他亞太國家
- 中東和非洲
- 中東
- 沙烏地阿拉伯
- 阿拉伯聯合大公國
- 土耳其
- 其他中東國家
- 非洲
- 南非
- 奈及利亞
- 肯亞
- 其他非洲國家
- 中東
- 北美洲
第6章 競爭情勢
- 市場集中度
- Strategic Initiatives and Partnerships
- 市佔率分析
- 公司簡介
- Accenture plc
- Aha!Labs Inc.
- Brightidea Inc.
- Crowdicity Ltd.(Wazoku)
- HYPE Innovation GmbH
- IBM Corporation
- IdeaScale Inc.
- Inno360 Inc.
- Medallia Inc.
- Nosco A/S
- Oracle Corporation
- Planbox Inc.
- Planview Inc.
- Qmarkets Ltd.
- Salesforce Inc.(IdeaExchange)
- SAP SE
- Sopheon plc
- Spigit Inc.(Planview)
- Wipro Ltd.(Innovation Services)
- Wazoku Ltd.
第7章 市場機會與未來展望
According to Mordor Intelligence, innovation management market size in 2026 is estimated at USD 3.57 billion, growing from 2025 value of USD 3.06 billion with 2031 projections showing USD 7.7 billion, growing at 16.62% CAGR over 2026-2031.
This report is Segmented by Offerings (Solutions and Services), End-User Enterprise Size (Large Enterprises and Small and Medium-Sized Enterprises (SMEs)), Deployment (Cloud and On-Premise), Application (Project Management Platforms, Marketing Platforms, and More), End-User (BFSI, Healthcare, and More) and by Geography. The Market Forecasts are Provided in Terms of Value (USD).
Global Innovation Management Market Trends and Insights
Ongoing Digital Transformation Across Industries
Digital transformation initiatives in the innovation management market compel organizations to replace isolated suggestion boxes with integrated ideation, evaluation, and commercialization frameworks that embed analytics and workflow orchestration. Executives increasingly regard trustworthy AI as a prerequisite for scalable transformation, with 77% of leaders emphasizing the need for transparent systems. Manufacturing firms integrate Industry 4.0 sensors and analytics into innovation suites, cutting safety incidents by up to 50% while elevating employee participation. Employee-centric design approaches address persistent cultural barriers, opening room for platforms that democratize ideation across hierarchies.
Rising Enterprise RandD Budgets
Escalating RandD outlays in the innovation management market intensify demand for governance tools that trace investment to commercial output. Oracle invested USD 8.6 billion in fiscal 2023 to refine existing products and pioneer new technologies, underscoring the link between large-scale RandD and the need for structured innovation pipelines.Consulting leader Accenture allocates USD 1.2 billion each year to exploration labs and USD 1.1 billion to workforce upskilling, aligning human-capital programs with platform-driven innovation tracking. Financial-services players follow suit, expanding AI and cloud budgets to protect revenue streams in a tightening margin environment.
Complexity of Multi-Tenant Integrations
Enterprises balancing cost efficiency with customization often discover that connecting cloud innovation suites to dozens of legacy systems strains internal IT bandwidth. ServiceNow's multi-instance architecture demonstrates the trade-off: higher isolation but heavier upgrade coordination. Insurance carriers and manufacturers grapple with identity-management, data-mapping, and compliance testing across each tenant, amplifying demand for specialized integration partners.
Other drivers and restraints analyzed in the detailed report include:
- Cloud-First Procurement Policies
- AI-Enabled Ideation Quality Scoring
- Data-Sovereignty and IP Leakage Concerns
For complete list of drivers and restraints, kindly check the Table Of Contents.
Segment Analysis
Solutions accounted for 67.92% of innovation management market share in 2025, demonstrating that buyers favor unified platforms spanning ideation capture, stage-gate governance, and portfolio analytics within a single user experience. Bundled AI models, low-code workflow builders, and pre-built API connectors continue to raise the bar for all-in-one suites. Professional services, although smaller, grow briskly at 19.12% CAGR as enterprises seek advisory support for change management, algorithm calibration, and integration workstreams. Accenture's consulting arm reported USD 5.068 billion in quarterly revenue, signaling healthy demand for specialized deployment services that keep transformation programs on schedule.
Demand for post-implementation optimization also propels the services category. Continuous-improvement retainers address new feature rollouts, employee-training refreshers, and performance benchmarking. As multi-tenant feature releases accelerate, organizations contract platform partners to recalibrate innovation KPIs, ensuring that fresh analytics models align with shifting strategic objectives. This dynamic positions managed-service providers as pivotal allies for sustaining innovation velocity over the platform life cycle.
Large enterprises commanded 58.05% of innovation management market size in 2025, leveraging dedicated RandD budgets and in-house architecture teams to integrate suites across product-lifecycle, HR, and customer-experience systems. Nonetheless, SMEs represent the most dynamic cohort, expanding at a 21.05% CAGR as subscription pricing, turnkey cloud deployments, and guided-onboarding programs shrink historic entry barriers. The innovation management market caters to SME pain points-budget ceilings and talent shortages-via template libraries, no-code integrations, and AI-assisted road-mapping tools.
Regional policy incentives further buoy SME adoption. European Union funds channel grants toward digitalization projects, while North American development banks underwrite cloud migrations. To counter capability gaps, vendors bundle virtual coaching and community forums that share best practices for engaging cross-functional teams, nurturing a culture of distributed ideation. Such wraparound support compresses ramp-up timelines and heightens platform stickiness among resource-constrained businesses.
Geography Analysis
North America captured 38.22% of innovation management market share in 2025, supported by mature enterprise software ecosystems, abundant venture funding, and broad C-suite acceptance of structured ideation protocols. Microsoft disclosed USD 245 billion in 2024 revenue-a 16% uplift-validating sustained investment cycles that favor innovation suites for orchestrating product and service pipelines. U.S. federal cloud outlays quintupled over eight years, further normalizing cloud-hosted innovation platforms within government and regulated industries. Canada and Mexico augment regional momentum with manufacturing, natural-resources, and fintech deployments, albeit at lower absolute spend.
Asia-Pacific stands as the fastest-growing region, expanding at a 22.1% CAGR through 2031. Enterprises in China, Australia, and Southeast Asia leapfrog legacy IT layers, adopting mobile-first, cloud-native innovation stacks that align with super-app cultures and cashless economies. Domestic AI-model initiatives and data-localization rules stimulate demand for region-tuned innovation suites. Japan and South Korea emphasize sovereign-cloud and IP-protection controls, harmonizing advanced digital infrastructure with rigorous compliance expectations. Local integrators and hyperscalers partner with platform vendors to deliver vertical solution bundles that suit manufacturing, electronics, and public-sector use cases.
Europe records measured yet resilient expansion, propelled by stricter environmental-disclosure regulations and privacy mandates such as GDPR. The EU Corporate Sustainability Reporting Directive motivates firms to embed ESG checkpoints inside innovation workflows, strengthening the business case for auditable platforms. National cloud-sovereignty policies foster a preference for regional data centers and encryption procedures. United Kingdom, Germany, and France spearhead adoption, while southern and eastern nations progress in line with broader digital-economy upgrades. South America, Middle East, and Africa remain nascent frontiers where infrastructure gaps and investment priorities can slow platform uptake, but localized SaaS pricing and government digitalization drives are gradually improving market accessibility.
- Accenture plc
- Aha! Labs Inc.
- Brightidea Inc.
- Crowdicity Ltd. (Wazoku)
- HYPE Innovation GmbH
- IBM Corporation
- IdeaScale Inc.
- Inno360 Inc.
- Medallia Inc.
- Nosco A/S
- Oracle Corporation
- Planbox Inc.
- Planview Inc.
- Qmarkets Ltd.
- Salesforce Inc. (IdeaExchange)
- SAP SE
- Sopheon plc
- Spigit Inc. (Planview)
- Wipro Ltd. (Innovation Services)
- Wazoku Ltd.
Additional Benefits:
- The market estimate (ME) sheet in Excel format
- 3 months of analyst support
TABLE OF CONTENTS
1 INTRODUCTION
- 1.1 Study Assumptions and Market Definition
- 1.2 Scope of the Study
2 RESEARCH METHODOLOGY
3 EXECUTIVE SUMMARY
4 MARKET LANDSCAPE
- 4.1 Market Overview
- 4.2 Market Drivers
- 4.2.1 Ongoing digital transformation across industries
- 4.2.2 Rising enterprise RandD budgets
- 4.2.3 Cloud-first procurement policies
- 4.2.4 Expanding open-innovation ecosystems
- 4.2.5 AI-enabled ideation quality scoring
- 4.2.6 Mandatory sustainability-linked innovation targets
- 4.3 Market Restraints
- 4.3.1 Complexity of multi-tenant integrations
- 4.3.2 Data-sovereignty and IP leakage concerns
- 4.3.3 Organizational culture inertia
- 4.3.4 Algorithmic bias in idea-ranking engines
- 4.4 Value Chain Analysis
- 4.5 Regulatory Landscape
- 4.6 Technological Outlook
- 4.7 Porter's Five Forces Analysis
- 4.7.1 Bargaining Power of Suppliers
- 4.7.2 Bargaining Power of Buyers
- 4.7.3 Threat of New Entrants
- 4.7.4 Threat of Substitutes
- 4.7.5 Competitive Rivalry
5 MARKET SIZE AND GROWTH FORECASTS (VALUE)
- 5.1 By Offerings
- 5.1.1 Solutions
- 5.1.2 Services
- 5.2 By End-user Enterprise Size
- 5.2.1 Large Enterprises
- 5.2.2 Small and Medium-sized Enterprises (SMEs)
- 5.3 By Deployment
- 5.3.1 Cloud
- 5.3.2 On-premises
- 5.4 By Application
- 5.4.1 Project Management Platforms
- 5.4.2 Marketing Platforms
- 5.4.3 Design Platforms
- 5.4.4 HR Platforms
- 5.4.5 Other Platforms
- 5.5 By End-user
- 5.5.1 BFSI
- 5.5.2 Healthcare
- 5.5.3 IT and Telecom
- 5.5.4 Media and Entertainment
- 5.5.5 Government
- 5.5.6 Other End-users
- 5.6 By Region
- 5.6.1 North America
- 5.6.1.1 United States
- 5.6.1.2 Canada
- 5.6.1.3 Mexico
- 5.6.2 South America
- 5.6.2.1 Brazil
- 5.6.2.2 Argentina
- 5.6.2.3 Rest of South America
- 5.6.3 Europe
- 5.6.3.1 United Kingdom
- 5.6.3.2 Germany
- 5.6.3.3 France
- 5.6.3.4 Italy
- 5.6.3.5 Spain
- 5.6.3.6 Russia
- 5.6.3.7 Rest of Europe
- 5.6.4 Asia-Pacific
- 5.6.4.1 China
- 5.6.4.2 India
- 5.6.4.3 Japan
- 5.6.4.4 South Korea
- 5.6.4.5 Australia and New Zealand
- 5.6.4.6 Southeast Asia
- 5.6.4.7 Rest of Asia-Pacific
- 5.6.5 Middle East and Africa
- 5.6.5.1 Middle East
- 5.6.5.1.1 Saudi Arabia
- 5.6.5.1.2 United Arab Emirates
- 5.6.5.1.3 Turkey
- 5.6.5.1.4 Rest of Middle East
- 5.6.5.2 Africa
- 5.6.5.2.1 South Africa
- 5.6.5.2.2 Nigeria
- 5.6.5.2.3 Kenya
- 5.6.5.2.4 Rest of Africa
- 5.6.5.1 Middle East
- 5.6.1 North America
6 COMPETITIVE LANDSCAPE
- 6.1 Market Concentration
- 6.2 Strategic Initiatives and Partnerships
- 6.3 Market Share Analysis
- 6.4 Company Profiles (includes Global level Overview, Market level overview, Core Segments, Financials as available, Strategic Information, Market Rank/Share, Products and Services, Recent Developments)
- 6.4.1 Accenture plc
- 6.4.2 Aha! Labs Inc.
- 6.4.3 Brightidea Inc.
- 6.4.4 Crowdicity Ltd. (Wazoku)
- 6.4.5 HYPE Innovation GmbH
- 6.4.6 IBM Corporation
- 6.4.7 IdeaScale Inc.
- 6.4.8 Inno360 Inc.
- 6.4.9 Medallia Inc.
- 6.4.10 Nosco A/S
- 6.4.11 Oracle Corporation
- 6.4.12 Planbox Inc.
- 6.4.13 Planview Inc.
- 6.4.14 Qmarkets Ltd.
- 6.4.15 Salesforce Inc. (IdeaExchange)
- 6.4.16 SAP SE
- 6.4.17 Sopheon plc
- 6.4.18 Spigit Inc. (Planview)
- 6.4.19 Wipro Ltd. (Innovation Services)
- 6.4.20 Wazoku Ltd.
7 MARKET OPPORTUNITIES AND FUTURE OUTLOOK
- 7.1 White-space and Unmet-Need Assessment

 創新管理市場:按元件、組織規模、部署模式、應用程式和最終用戶產業分類-全球預測,2026-2032年
 2026年全球創新管理軟體市場報告
 創新即服務市場:按組件、應用、組織規模、產業、部署模式和地區分類創新管理市場:依解決方案類型、部署模式、企業規模和地區分類
 全球創新管理市場規模、佔有率、趨勢和成長分析報告(2026-2034年)2026年全球即時回饋軟體市場報告2026年全球企業回饋管理市場報告晶圓廠管理軟體市場:按部署類型、產業、組件和最終用戶分類 - 2026-2032 年全球預測2026年全球IaaS(創新即服務)市場報告2026年全球創新管理市場報告