

 |
市場調查報告書
商品編碼
2065761
B2B支付:市場佔有率分析、產業趨勢與統計、成長預測(2026-2031年)B2B Payments - Market Share Analysis, Industry Trends & Statistics, Growth Forecasts (2026 - 2031) |
||||||
※ 本網頁內容可能與最新版本有所差異。詳細情況請與我們聯繫。
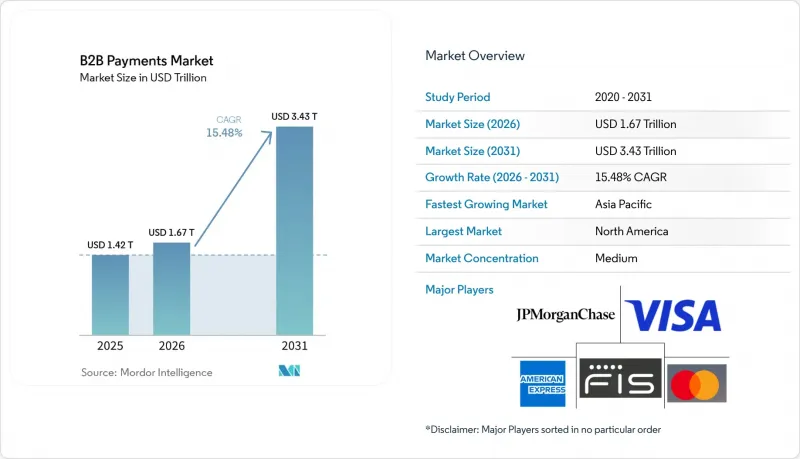
根據 Mordor Intelligence 預測,B2B 支付市場規模將從 2025 年的 1.42 兆美元成長到 2026 年的 1.67 兆美元,然後在 2031 年達到 3.43 兆美元,2026 年至 2031 年的複合年成長率為 15.48%。
本報告按支付類型(境內支付和跨境支付)、支付方式(傳統支付和數位支付)、公司規模(中小企業和大型企業)、終端用戶行業(銀行、金融服務和保險 (BFSI)、資訊科技和電信、製造業、能源和公共產業、政府和公共部門等)以及地區進行細分。市場預測以美元 (USD) 計價。
全球B2B支付市場趨勢與洞察
加速即時支付基礎設施的普及
2023年至2025年間,全球各中央銀行以前所未有的速度部署即時結算系統,重新定義了人們對結算確定性的預期。至2025年底,聯準會的FedNow服務參與機構已超過900家。歐洲的SEPA即時結算系統在2024年處理了145億筆交易,年增54%。印度的統一支付介面(UPI)到2025年12月每月處理134億筆交易。這些結算網路縮短了營運資金周轉週期,使供應商能夠在幾秒鐘內收到款項,買家能夠享受提前付款折扣。將即時結算網路整合到應付帳款管理軟體中的結算服務供應商,正在將自身定位為策略性金融合作夥伴,而不僅僅是商品化的支付處理商。
B2B市場平台對嵌入式支付功能的需求激增
如今,產業專用的軟體平台正將支付服務定位為核心收入來源。 Stripe 預測,到 2025 年,使用其嵌入式金融解決方案的商家處理的交易總額將達到 1 兆美元,其中 B2B 市場是成長最快的領域。貨運交易平台、建築入口網站和批發分銷網路在其工作流程中提供直接託管、分期付款和動態折扣等服務,從而縮短賣家的應收帳款週轉天數 (DSO),並減少買家的人工對帳工作。嵌入式金融降低了支付服務提供者的客戶獲取成本,因為商家可以透過與平台建立合作關係來訂閱服務。這一趨勢與「可組合商務」理念相契合,該理念鼓勵企業透過 API 將不同行業的優質服務整合在一起,而不是部署單一的 ERP 系統。
全球合規體系分散化會減緩跨國資金流動。
由於缺乏統一的洗錢防制(AML) 和了解你的客戶 (KYC) 規則,支付服務提供者不得不維持並行的客戶註冊流程,導致處理時間長達 24 至 72 小時,並推高了成本。世界銀行估計,到 2024 年,200 美元國際轉帳的平均手續費將達到 6.35%,這主要是由合規相關費用所驅動的。缺乏全球數位身分框架迫使企業在進入新市場時重新提交文件。代理銀行體系的複雜性進一步加劇了這個問題,促使金融科技新興企業建構繞過仲介業者的本地支付系統網路。
細分市場分析
預計到2025年,B2B支付市場中,國內交易將佔據主導地位,市佔率高達82.89%。這反映了國內支付基礎設施的成熟和監管障礙的降低。跨國資本流動雖然規模較小,但由於跨國供應鏈和B2B市場的成長,其複合年成長率(CAGR)也達到了16.52%。連接印度和阿拉伯聯合大公國、新加坡和泰國等新興支付走廊正在試行使用央行數位貨幣(CBDC)原型進行即時結算,將結算時間從數天縮短至數天。能夠提供多幣種帳戶、對沖工具以及本地支付網路連接等服務的供應商將能夠抓住不斷成長的跨境支付需求。
未來,國內外即時支付網路的整合可能會縮小價格差異,進而對傳統的代理銀行模式構成壓力。隨著跨境支付基礎設施的日趨成熟,財務部門將期望獲得與國內相同的豐富資料和直通式對帳(STP)功能。提供可實現全球覆蓋的整合API的金融科技公司正成為平台型商務領域的首選合作夥伴,推動B2B支付市場這一細分領域的結構性高速成長。
傳統的支付方式,例如電匯和支票,在銀行級安全保障和成熟的企業工作流程的支持下,到2025年仍將佔據B2B支付市場64.78%的佔有率。涵蓋即時API、卡片組織網路和區塊鏈等選項的數位支付管道,正以17.31%的複合年成長率成長。預計Bill.com等雲端平台在2025會計年度的交易金額將達到2,800億美元,其中數位支付將佔客戶支付總額的70%以上。
ISO 20022通訊標準支援更豐富的資料字段,並可自動匹配舊有系統和新一代系統之間的資料。隨著軟體供應商整合支付編配功能,企業能夠獲得即時可見性,並實現核准流程自動化,從而減少人工處理和詐欺風險。擴展後的功能集正在加速從批次文件向數位轉型,並為 B2B 支付市場中日益成長的數位通路佔有率提供永續的支援。
區域分析
北美地區擁有成熟的卡片組織FedNow和深厚的企業融資專業知識,預計到2025年,其交易量將佔全球總交易量的34.27%。加拿大的Real-Time Rail和墨西哥的CoDi等平台正在北美大陸擴展即時支付功能。金融科技新興企業則將目光投向美國和拉丁美洲之間的跨境支付管道,因為這些管道的合規成本導致手續費超過6%。
亞太地區預計將成為成長最快的地區,複合年成長率將達到17.42%,這主要得益於印度的統一支付介面(UPI)、中國的數位人民幣試點計畫以及東南亞以行動優先為核心的生態系統。各國政府強制部署可互通的即時網路的相關法規,正在為本地金融科技公司和全球平台創造公平的競爭環境。
在歐洲,SEPA即時支付的覆蓋範圍不斷擴大,以及即將強制實施的電子增值稅(增值稅),正在推動德國、法國和荷蘭等國的即時支付普及。英國的快速支付系統(Faster Payments)仍是行業標桿,使Revolut等金融科技公司能夠整合其財務管理工具。中東和南美洲的央行數位貨幣(CBDC)試點計畫正在穩步推進,而非洲的進展則喜憂參半:南非正在推動數位轉型,而行動支付在其他地區則佔據主導地位。整體而言,各地區的政策措施正朝著即時支付的方向發展,這將支持B2B支付市場的長期擴張。
其他好處:
- Excel格式的市場預測(ME)表
- 3個月的分析師支持
目錄
第1章:引言
- 研究假設和市場定義
- 調查範圍
第2章:調查方法
第3章執行摘要
第4章 市場狀況
- 市場概覽
- 市場促進因素
- 加速即時支付基礎設施的普及
- B2B市場平台對嵌入式支付功能的需求激增
- 歐洲推廣數位發票和電子增值稅(e-VAT)法規
- 最佳化營運資金使用方案,以促進企業卡和虛擬卡的普及。
- 代幣化存款和受監管的穩定幣,可實現全天候金融結算。
- 利用 GenAI 實現自主支付和收款代理,從而降低後勤部門成本。
- 市場限制因素
- 全球合規(外匯、反洗錢、了解你的客戶)的分散正在減緩跨國資本流動。
- 層出不窮的支付詐騙和商業電子郵件詐騙正在削弱人們對數位服務的信任。
- 中型企業ERP整合的複雜性
- 新興代幣化貨幣體系與舊有系統之間的互通性差距。
- 產業價值鏈分析
- 監理情勢
- 技術展望
- 波特五力分析
- 投資與資金籌措分析
- 對影響市場的宏觀經濟因素進行評估
第5章 市場規模與成長預測
- 按付款方式
- 國內支付
- 跨境支付
- 透過付款方式
- 傳統的
- 數位的
- 按公司規模
- 中小企業
- 大公司
- 按最終用戶行業分類
- 銀行、金融服務和保險(BFSI)
- 資訊科技/通訊
- 製造業
- 能源公用事業
- 政府/公共部門
- 其他終端用戶產業
- 按地區
- 北美洲
- 美國
- 加拿大
- 墨西哥
- 歐洲
- 英國
- 德國
- 法國
- 義大利
- 其他歐洲國家
- 亞太地區
- 中國
- 日本
- 印度
- 韓國
- 其他亞太國家
- 南美洲
- 巴西
- 阿根廷
- 其他南美國家
- 中東
- 阿拉伯聯合大公國
- 沙烏地阿拉伯
- 其他中東國家
- 非洲
- 南非
- 其他非洲國家
- 北美洲
第6章 競爭情勢
- 市場集中度
- 策略趨勢
- 市佔率分析
- 公司簡介
- Visa Inc.
- Mastercard Incorporated
- American Express Company
- JPMorgan Chase and Co.
- Fidelity National Information Services, Inc.(FIS Global)
- Fiserv, Inc.
- Global Payments Inc.
- Stripe, Inc.
- Adyen NV
- Block, Inc.(Square)
- PayPal Holdings, Inc.
- Payoneer Global Inc.
- Flywire Corporation
- Coupa Software Incorporated
- Bill.com Holdings Inc.
- SAP SE
- Bottomline Technologies, Inc.
- Airwallex(Hong Kong)Limited
- Currencycloud Group Limited
- Wise Plc
- Rapyd Financial Networks Ltd.
- Paystand, Inc.
- Capital One Financial Corporation
- Bank of America Corporation
- Traxpay GmbH
第7章 市場機會與未來展望
According to Mordor Intelligence, the b2B payments market size is expected to grow from USD 1.42 trillion in 2025 to USD 1.67 trillion in 2026 and is forecast to reach USD 3.43 trillion by 2031 at a 15.48% CAGR over 2026-2031.
This report is Segmented by Payment Type (Domestic Payments, and Cross-Border Payments), Payment Mode (Traditional Mode, and Digital Mode), Enterprise Size (Small and Medium Enterprises (SMEs), and Large Enterprises), End-User Vertical (BFSI, IT and Telecom, Manufacturing, Energy and Utilities, Government and Public Sector, and More), and Geography. The Market Forecasts are Provided in Terms of Value (USD).
Global B2B Payments Market Trends and Insights
Acceleration Of Real-Time Payment Infrastructure Adoption
Central banks deployed instant-settlement rails at record speed between 2023 and 2025, resetting expectations around payment finality. The United States Federal Reserve's FedNow Service exceeded 900 participating institutions by late 2025. Europe's SEPA Instant scheme handled 14.5 billion transactions in 2024, up 54% year on year. India's Unified Payments Interface processed 13.4 billion monthly transactions by December 2025. These rails compress working-capital cycles, enabling suppliers to receive funds within seconds and buyers to capture early-payment discounts. Payment providers embedding real-time rails into accounts-payable software are positioning as strategic treasury partners rather than commoditized processors.
Surge In B2B Marketplace Platforms Demanding Embedded Payment Capabilities
Vertical software platforms now treat payment facilitation as a core revenue stream. Stripe disclosed that software vendors using its embedded-finance stack processed USD 1 trillion in volume during 2025, with B2B marketplaces the fastest-growing cohort. Freight exchanges, construction portals, and wholesale distribution networks offer escrow, split disbursements, and dynamic discounting directly in workflow, shrinking Days Sales Outstanding for sellers and reducing manual reconciliation for buyers. Embedded finance lowers customer-acquisition costs for payment providers since merchants onboard through the platform relationship. The trend dovetails with composable commerce, where enterprises assemble best-of-breed services via APIs rather than deploying monolithic ERP suites.
Fragmented Global Compliance Slows Cross-Border Flows
Inconsistent anti-money-laundering and know-your-customer rules oblige payment providers to maintain parallel onboarding flows, adding 24-72 hours to processing times and inflating costs. The World Bank calculated average cross-border transfer fees at 6.35% for a USD 200 remittance in 2024, with compliance overhead a major driver. Lack of a global digital-identity framework forces enterprises to resubmit documents when entering new markets. Correspondent-banking chains add further opacity, encouraging fintech challengers to build local clearing-system networks that bypass intermediaries.
Other drivers and restraints analyzed in the detailed report include:
- Regulatory Push Toward Digital Invoicing And E-VAT In Europe
- Working-Capital Optimization Initiatives Driving Corporate And Virtual Card Uptake
- Persistent Payment Fraud And Business Email Compromise Undermines Digital Trust
For complete list of drivers and restraints, kindly check the Table Of Contents.
Segment Analysis
Domestic transactions dominated the B2B payments market in 2025 with an 82.89% share, reflecting mature local rails and lower regulatory friction. Cross-border flows, though smaller, are expanding at a 16.52% CAGR as multinational supply chains and B2B marketplaces proliferate. Emerging payment corridors linking India and the United Arab Emirates or Singapore and Thailand have piloted instant settlement using central-bank digital-currency prototypes, cutting settlement from days to seconds. Providers that bundle multi-currency accounts, hedging tools, and local-clearing connectivity stand to capture rising cross-border demand.
Linkages between domestic and international instant networks may narrow pricing differentials over time, pressuring legacy correspondent-banking models. As cross-border rails mature, treasury teams will expect the same data richness and straight-through reconciliation they enjoy domestically. Fintechs offering unified application-programming-interfaces for global coverage are positioning as preferred partners for platform-based commerce, reinforcing structurally higher growth for this segment of the B2B payments market.
Traditional modes such as wires and checks still accounted for 64.78% of the B2B payments market size in 2025, underpinned by perceived bank-level security and entrenched enterprise workflows. Digital rails, encompassing real-time APIs, card networks, and blockchain-based options, are growing at a 17.31% CAGR. Cloud platforms like Bill.com processed USD 280 billion in fiscal-2025 volume, with digital penetration above 70% of client payments.
ISO 20022 messaging standards are enabling richer data fields that automate reconciliation across both legacy and next-generation systems. As software vendors embed payment orchestration, enterprises gain real-time visibility and can automate approval flows, reducing manual touchpoints and fraud exposure. The expanding feature set encourages migration away from batch files, supporting sustained share gains for digital channels within the B2B payments market.
Geography Analysis
North America held 34.27% of 2025 transaction value, supported by FedNow, mature card networks, and deep corporate-treasury expertise. Canada's Real-Time Rail and Mexico's CoDi platform extend instant-payment capability across the continent. Fintech challengers target cross-border United States-Latin America corridors, where compliance costs lift fees above 6%.
Asia-Pacific is projected to be the fastest-growing region at 17.42% CAGR, fueled by India's UPI, China's digital-yuan pilots, and Southeast Asia's mobile-first ecosystems. Government mandates for interoperable real-time networks create a level playing field for local fintechs and global platforms alike.
Europe benefits from SEPA Instant reachability and impending e-VAT mandates, stimulating adoption across Germany, France, and the Netherlands. The United Kingdom's Faster Payments remains a benchmark, enabling fintechs such as Revolut to embed treasury tools. The Middle East and South America invest in central-bank digital-currency pilots, while Africa shows mixed progress, with South Africa's modernization contrasting with mobile-money dominance elsewhere. Collectively, regional policy actions are converging toward instant settlement, reinforcing the long-run expansion of the B2B payments market.
- Visa Inc.
- Mastercard Incorporated
- American Express Company
- JPMorgan Chase and Co.
- Fidelity National Information Services, Inc. (FIS Global)
- Fiserv, Inc.
- Global Payments Inc.
- Stripe, Inc.
- Adyen N.V.
- Block, Inc. (Square)
- PayPal Holdings, Inc.
- Payoneer Global Inc.
- Flywire Corporation
- Coupa Software Incorporated
- Bill.com Holdings Inc.
- SAP SE
- Bottomline Technologies, Inc.
- Airwallex (Hong Kong) Limited
- Currencycloud Group Limited
- Wise Plc
- Rapyd Financial Networks Ltd.
- Paystand, Inc.
- Capital One Financial Corporation
- Bank of America Corporation
- Traxpay GmbH
Additional Benefits:
- The market estimate (ME) sheet in Excel format
- 3 months of analyst support
TABLE OF CONTENTS
1 INTRODUCTION
- 1.1 Study Assumptions and Market Definition
- 1.2 Scope of the Study
2 RESEARCH METHODOLOGY
3 EXECUTIVE SUMMARY
4 MARKET LANDSCAPE
- 4.1 Market Overview
- 4.2 Market Drivers
- 4.2.1 Acceleration of Real-Time Payment Infrastructure Adoption
- 4.2.2 Surge in B2B Marketplace Platforms Demanding Embedded Payment Capabilities
- 4.2.3 Regulatory Push Toward Digital Invoicing and e-VAT in Europe
- 4.2.4 Working-Capital Optimization Initiatives Driving Corporate and Virtual Card Uptake
- 4.2.5 Tokenized Deposits and Regulated Stablecoins Enabling 24/7 Treasury Settlement
- 4.2.6 GenAI-Powered Autonomous Payables and Receivables Agents Lowering Back-Office Costs
- 4.3 Market Restraints
- 4.3.1 Fragmented Global Compliance (FX, AML, KYC) Slows Cross-Border Flows
- 4.3.2 Persistent Payment Fraud and Business Email Compromise Undermines Digital Trust
- 4.3.3 ERP Integration Complexity for Mid-Market Enterprises
- 4.3.4 Interoperability Gaps Between Emerging Tokenized Money Rails and Legacy Systems
- 4.4 Industry Value Chain Analysis
- 4.5 Regulatory Landscape
- 4.6 Technological Outlook
- 4.7 Porter's Five Forces Analysis
- 4.7.1 Bargaining Power of Suppliers
- 4.7.2 Bargaining Power of Buyers
- 4.7.3 Threat of New Entrants
- 4.7.4 Threat of Substitutes
- 4.7.5 Intensity of Competitive Rivalry
- 4.8 Investment and Funding Analysis
- 4.9 Assessment of Macroeconomic Factors on the Market
5 MARKET SIZE AND GROWTH FORECASTS (VALUE)
- 5.1 By Payment Type
- 5.1.1 Domestic Payments
- 5.1.2 Cross-Border Payments
- 5.2 By Payment Mode
- 5.2.1 Traditional
- 5.2.2 Digital
- 5.3 By Enterprise Size
- 5.3.1 Small and Medium Enterprises (SMEs)
- 5.3.2 Large Enterprises
- 5.4 By End-User Vertical
- 5.4.1 Banking, Financial Services and Insurance (BFSI)
- 5.4.2 Information Technology and Telecom
- 5.4.3 Manufacturing
- 5.4.4 Energy and Utilities
- 5.4.5 Government and Public Sector
- 5.4.6 Other End-User Verticals
- 5.5 By Geography
- 5.5.1 North America
- 5.5.1.1 United States
- 5.5.1.2 Canada
- 5.5.1.3 Mexico
- 5.5.2 Europe
- 5.5.2.1 United Kingdom
- 5.5.2.2 Germany
- 5.5.2.3 France
- 5.5.2.4 Italy
- 5.5.2.5 Rest of Europe
- 5.5.3 Asia-Pacific
- 5.5.3.1 China
- 5.5.3.2 Japan
- 5.5.3.3 India
- 5.5.3.4 South Korea
- 5.5.3.5 Rest of Asia-Pacific
- 5.5.4 South America
- 5.5.4.1 Brazil
- 5.5.4.2 Argentina
- 5.5.4.3 Rest of South America
- 5.5.5 Middle East
- 5.5.5.1 United Arab Emirates
- 5.5.5.2 Saudi Arabia
- 5.5.5.3 Rest of Middle East
- 5.5.6 Africa
- 5.5.6.1 South Africa
- 5.5.6.2 Rest of Africa
- 5.5.1 North America
6 COMPETITIVE LANDSCAPE
- 6.1 Market Concentration
- 6.2 Strategic Moves
- 6.3 Market Share Analysis
- 6.4 Company Profiles (includes Global Level Overview, Market Level Overview, Core Segments, Financials as available, Strategic Information, Market Rank/Share, Products and Services, Recent Developments)
- 6.4.1 Visa Inc.
- 6.4.2 Mastercard Incorporated
- 6.4.3 American Express Company
- 6.4.4 JPMorgan Chase and Co.
- 6.4.5 Fidelity National Information Services, Inc. (FIS Global)
- 6.4.6 Fiserv, Inc.
- 6.4.7 Global Payments Inc.
- 6.4.8 Stripe, Inc.
- 6.4.9 Adyen N.V.
- 6.4.10 Block, Inc. (Square)
- 6.4.11 PayPal Holdings, Inc.
- 6.4.12 Payoneer Global Inc.
- 6.4.13 Flywire Corporation
- 6.4.14 Coupa Software Incorporated
- 6.4.15 Bill.com Holdings Inc.
- 6.4.16 SAP SE
- 6.4.17 Bottomline Technologies, Inc.
- 6.4.18 Airwallex (Hong Kong) Limited
- 6.4.19 Currencycloud Group Limited
- 6.4.20 Wise Plc
- 6.4.21 Rapyd Financial Networks Ltd.
- 6.4.22 Paystand, Inc.
- 6.4.23 Capital One Financial Corporation
- 6.4.24 Bank of America Corporation
- 6.4.25 Traxpay GmbH
7 MARKET OPPORTUNITIES AND FUTURE OUTLOOK
- 7.1 White-Space and Unmet-Need Assessment
 B2B支付市場-全球產業規模、佔有率、趨勢、機會與預測:按支付類型、公司規模、支付方式、產業橫斷面、區域和競爭格局分類,2021-2031年
 2026年全球全平台遊戲手把市場報告
 B2B支付交易市場:按支付類型、支付方式、公司類型、行業和地區分類
 B2B支付市場:按類型、支付方式、公司規模及最終用戶產業分類-2026-2032年全球市場預測
 B2B支付市場規模、佔有率、成長及全球產業分析:按類型、應用和地區分類的洞察,以及2026-2034年的預測
 B2B支付市場規模、佔有率、趨勢和預測(按支付類型、支付方式、公司規模、行業和地區分類,2026-2034年)全方位金融服務平台市場(按服務類型、客戶類型、組織規模、部署類型和分銷管道分類)-2026-2032年全球預測出口保證平台市場按產品類型、保固期、風險類別、最終用戶產業和通路分類,全球預測(2026-2032年)全球B2B支付市場(2024-2030年)
 B2B支付市場規模、佔有率和成長分析(按支付類型、支付方式、支付方法、行業垂直領域、公司規模和地區分類)-2026-2033年行業預測