

 |
市場調查報告書
商品編碼
2065756
SaaS(軟體即服務):市佔率分析、產業趨勢與統計、成長預測(2026-2031 年)Software As A Service - Market Share Analysis, Industry Trends & Statistics, Growth Forecasts (2026 - 2031) |
||||||
※ 本網頁內容可能與最新版本有所差異。詳細情況請與我們聯繫。
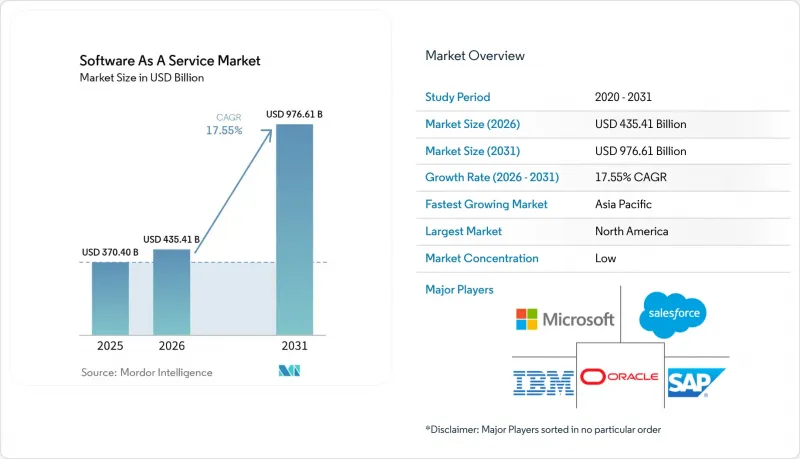
根據 Mordor Intelligence 預測,軟體即服務(SaaS) 市場規模預計將從 2025 年的 3,704 億美元成長到 2026 年的 4,354.1 億美元。
此外,預計到 2031 年,該產業的價值將達到 9,766.1 億美元,並且預計從 2026 年到 2031 年的複合年成長率將達到 17.55%。
本報告按部署方式(公共雲端、私有雲端、混合雲端)、企業規模(中小企業、大型企業)、最終用戶行業(IT與電信、金融、保險與證券、零售、醫療保健、製造業及其他最終用戶行業)和地區(北美、歐洲、亞太、拉丁美洲、中東和非洲)進行細分。以上所有細分市場的規模和預測均以美元(USD)計價。
全球SaaS市場趨勢與洞察
雲端原生架構的普及
在雲端原生架構中,單體軟體被 Kubernetes編配的容器化微服務所取代,從而實現持續交付和彈性擴展。微軟 2025 會計年度第三季的雲端營收達到 424 億美元(年增 20%),凸顯了企業採用「雲端優先」架構進行重建的強勁需求。擺脫了硬體限制,企業能夠快速部署新環境,從而顯著提升開發人員的生產力和服務彈性。這種架構轉變也導致 SaaS 市場碎片化,降低了能夠無縫整合到超大規模資料中心業者生態系統中的利基供應商的進入門檻。隨著多重雲端工具的日趨成熟,企業正在尋求多元化的供應商,以在各個領域保持最佳創新,同時避免過度集中帶來的風險。
中小企業的快速數字化
疫情過後,中小企業正迅速推動後勤部門營運的數位轉型,以維持競爭優勢。經合組織的一項調查顯示,數位轉型的應用範圍正從企業規模擴展到各個行業,其中知識密集型中小企業走在前列。在中國,儘管宏觀經濟低迷,但2023年SaaS支出仍達581億元人民幣,較去年同期成長23.1%。價格合理的SaaS訂閱服務幫助中小企業規避了資金壓力,而人工智慧驅動的自配置功能則降低了實施難度。隨著資源有限的管理者更加重視便利性和投資報酬率,提供整合會計、電商和行銷儀錶板的供應商正日益受到青睞。
數據主權和合規性的障礙
GDPR以及省、區域和市級層級相繼訂定的隱私法迫使服務提供者將資料在地化、任命資料保護官並接受嚴格的審計。合規性推高了成本,並縮小了超大規模資料中心業者中心部署的選擇範圍。企業透過將敏感工作負載保留在本地或私有雲端中,並選擇具備區域託管能力的供應商來規避風險。
細分市場分析
公共雲端將繼續主導SaaS市場,預計2025年將佔據89.42%的市場。然而,隨著企業追求合規性和對延遲敏感的應用場景,混合雲配置預計將以21.8%的複合年成長率成長。 Discover Financial Services正在利用AWS上的Red Hat OpenShift來應對季節性需求高峰,並透過自由遷移工作負載來降低供應商鎖定風險。隨著邊緣節點在製造業和金融業實現即時分析,混合解決方案的SaaS市場規模預計將會擴大。
企業正在整合公有雲、私有雲和邊緣雲端資源,以平衡成本和管理。印度靛藍航空在18個月內將80%的業務遷移到涵蓋微軟Azure和谷歌雲端的多重雲端環境中。 SaaS市場正受益於這種多樣性,供應商正在加速交付可在所有環境中一致運作的容器化版本。
2025年,大型企業將因整合套件能夠簡化全球流程而佔據SaaS市場58.05%的佔有率。然而,預計年複合成長率將達到19.2%的中小企業(SME)正在推動下一波成長。在這一細分市場,隨著訂閱收費、引導式註冊和人工智慧驅動的配置功能等技術壁壘的消除,SaaS市場規模正逐年擴大。
中小企業更傾向於選擇能夠透過單一介面提供會計、銷售和人力資源功能的平台。經合組織指出,數位化技術的普及程度仍然不均衡,因此需要加強對小規模企業的政策支持。供應商若投資於模板、合作夥伴生態系統和社區學習,將有助於降低整體擁有成本,並確保客戶的長期忠誠度。
區域分析
預計到2025年,北美將佔據SaaS市場42.60%的佔有率,這得益於其高密度雲端基礎設施、強大的網路安全標準以及充足的資金。可口可樂斥資11億美元擴大與微軟的合作,顯示企業級多重雲端SaaS策略正在被廣泛採用。儘管美國各州監管標準的差異增加了合規負擔,但供應商正透過提供可配置的隱私模組和地理位置複製的資料儲存來應對這一挑戰。
預計到2031年,亞太地區將以18.7%的年均成長率成長,成為SaaS市場擴張的中心。網路普及率的提高、行動優先的消費趨勢以及政府數位化計畫正在推動SaaS的普及。在中國,2023年SaaS銷售額達到581億元,年增23.1%,凸顯了製造業和消費服務業的巨大潛在需求。本土超大規模資料中心業者正透過提供特定語言的使用者介面和區域合規功能,與成熟的全球企業競爭。
在歐洲,我們看到合規驅動的穩定成長。 GDPR 和各國資料保護法要求供應商維護區域資料中心,並投資加密技術的創新。永續發展目標也影響採購,企業會評估供應商的碳足跡,並要求其揭露綠色雲端實踐。獲得可再生能源設施認證並提供透明報告的供應商可以獲得競爭優勢。
其他好處:
- Excel格式的市場預測(ME)表
- 3個月的分析師支持
目錄
第1章:引言
- 研究假設和市場定義
- 調查範圍
第2章:調查方法
第3章執行摘要
第4章 市場狀況
- 市場概覽
- 市場促進因素
- 雲端原生架構的普及
- 新冠疫情後中小企業快速數位轉型
- 降低初始成本和本地感測技術的比較
- 利用世代人工智慧實現營收成長
- Edge發送類型的超低延遲 SaaS
- 碳核算合規要求
- 市場限制因素
- 數據主權和合規障礙
- 供應商鎖定和轉換成本
- FinOps 監控有助於遏制 SaaS 的無序擴張。
- 強制性綠色雲端實施導致成本增加
- 監理情勢
- 技術展望
- 波特五力分析
- 投資分析
- 對宏觀經濟影響的評估
第5章 市場規模與成長預測
- 不同的發展
- 公共雲端
- 私有雲端
- 混合雲端
- 按公司規模
- 中小企業
- 大公司
- 按應用程式類型
- 客戶關係管理(CRM)
- 企業資源規劃(ERP)
- 人力資本管理(HCM/HRM)
- 協作與生產力
- 商業情報與分析
- 安全與合規
- 其他用途
- 定價模式
- 基於訂閱
- 按使用量付費使用制
- 免費增值和分級收費系統
- 按最終用戶行業分類
- IT/通訊
- 銀行、金融服務和保險(BFSI)
- 零售與電子商務
- 醫療保健和生命科學
- 製造業
- 其他行業
- 按地區
- 北美洲
- 美國
- 加拿大
- 墨西哥
- 南美洲
- 巴西
- 阿根廷
- 哥倫比亞
- 其他南美國家
- 歐洲
- 英國
- 德國
- 法國
- 義大利
- 西班牙
- 其他歐洲國家
- 亞太地區
- 中國
- 日本
- 印度
- 韓國
- 澳洲和紐西蘭
- 其他亞太國家
- 中東
- 以色列
- 沙烏地阿拉伯
- 阿拉伯聯合大公國
- 土耳其
- 其他中東國家
- 非洲
- 南非
- 埃及
- 奈及利亞
- 其他非洲國家
- 北美洲
第6章 競爭情勢
- 市場集中度
- 策略性舉措(併購、資金籌措、合作)
- 市佔率分析
- 公司簡介
- Microsoft
- Salesforce
- Oracle
- SAP
- IBM
- ServiceNow
- Atlassian
- Intuit
- Adobe
- Google(Alphabet)
- Workday
- Zoom Video Communications
- Dropbox
- HubSpot
- Shopify
- Zendesk
- Snowflake
- Alteryx
- ServiceTitan
- BambooHR
第7章 市場機會與未來展望
According to Mordor Intelligence, the software as a service (SaaS) market size in 2026 is estimated at USD 435.41 billion, growing from the 2025 value of USD 370.4 billion, with 2031 projections showing USD 976.61 billion, growing at 17.55% CAGR over 2026-2031.
This report is Segmented by Deployment (Public Cloud, Private Cloud, Hybrid Cloud), Enterprises (SMEs, Large Enterprises), End-User Verticals (IT and Telecom, BFSI, Retail, Healthcare, Manufacturing, Other End-User Verticals), Geography (North America, Europe, Asia-Pacific, Latin America, Middle East and Africa). The Market Sizes and Forecasts are Provided in Terms of Value (USD) for all the Above Segments.
Global Software As A Service Market Trends and Insights
Proliferation of Cloud-Native Architectures
Cloud-native approaches replace monolithic software with containerized microservices orchestrated by Kubernetes, enabling continuous delivery and elastic scaling. Microsoft's USD 42.4 billion Q3 FY2025 cloud revenue, up 20% year over year, underlines enterprise appetite for cloud-first rebuilding. Freed from hardware constraints, companies spin up new environments in minutes, boosting developer velocity and service resilience. This architectural shift also fragments the SaaS market by lowering entry barriers for niche vendors that plug seamlessly into hyperscaler ecosystems. As multi-cloud tools mature, organizations diversify providers to avoid concentration risk while preserving best-of-breed innovation.
Rapid SME Digitalization
Post-pandemic, SMEs race to digitize front- and back-office functions to remain competitive. OECD research points to widening adoption gaps by size and sector, yet knowledge-intensive SMEs lead uptake. In China, SaaS spending hit CNY 58.1 billion in 2023, rising 23.1% despite macro softness. Budget-friendly SaaS subscriptions help SMEs bypass capital constraints, while AI-infused self-configuration trims onboarding effort. Vendors that bundle accounting, e-commerce, and marketing into unified dashboards gain traction as resource-strapped owners prioritize simplicity and ROI.
Data-Sovereignty and Compliance Barriers
GDPR and a wave of state-level privacy laws compel providers to localize data, appoint Data Protection Officers, and pass rigorous audits. Compliance lifts costs and narrows hyperscaler location choices. Enterprises hedge by retaining sensitive workloads on-prem or in private clouds and selecting vendors with regional hosting frameworks.
Other drivers and restraints analyzed in the detailed report include:
- Lower Upfront Costs vs. On-Premises Licensing
- Vendor Lock-in and Switching Costs
For complete list of drivers and restraints, kindly check the Table Of Contents.
Segment Analysis
Public cloud continues to dominate the SaaS market with 89.42% share in 2025. Hybrid configurations, though, are projected to grow at 21.8% CAGR as firms pursue regulatory compliance and latency-sensitive use cases. Discover Financial Services uses Red Hat OpenShift on AWS to manage seasonal demand spikes and move workloads freely, mitigating vendor lock-in risk. The SaaS market size for hybrid solutions is set to widen as edge nodes enable real-time analytics in manufacturing and finance.
Enterprises blend public, private, and edge resources to balance cost against control. IndiGo Airline migrated 80% of operations to a multicloud estate spanning Microsoft Azure and Google Cloud within 18 months. The SaaS market benefits from this diversity, encouraging vendors to ship container-ready versions that run consistently across environments.
Large companies accounted for 58.05% of the SaaS market in 2025, attracted by unified suites that simplify global processes. Yet SMEs, forecast to expand at 19.2% CAGR, power the next growth wave. For this cohort the SaaS market size expands each year as subscription billing, guided onboarding, and AI-driven configuration remove technical barriers.
SMEs gravitate toward platforms offering accounting, sales, and HR in a single interface. OECD notes digital uptake remains uneven, prompting policy support for smaller firms. Vendors that invest in templates, partner ecosystems, and community learning lower the total cost of ownership and secure long-term loyalty.
Geography Analysis
North America held 42.60% of the SaaS market in 2025, benefitting from dense cloud infrastructure, robust cybersecurity standards, and capital access. Coca-Cola's USD 1.1 billion expansion of its Microsoft partnership illustrates enterprise-scale adoption of multi-cloud SaaS strategies. Regulatory fragmentation among US states does raise compliance overhead, but vendors respond with configurable privacy modules and regionally replicated data stores.
Asia-Pacific is projected to grow 18.7% annually to 2031, becoming the epicenter of SaaS market expansion. Rising internet penetration, mobile-first consumption, and government digitization programs drive adoption. China recorded CNY 58.1 billion SaaS sales in 2023 with 23.1% growth, underscoring untapped demand across manufacturing and consumer services. Local hyperscalers battle global incumbents by offering language-localized UI and region-specific compliance features.
Europe posts steady yet compliance-centric growth. GDPR and country-level data-protection acts compel vendors to maintain regional datacenters and invest in encryption innovations. Sustainability goals also influence procurement, with enterprises evaluating provider carbon footprints and requiring green-cloud disclosures. Vendors that certify renewable-powered facilities and transparent reporting gain competitive advantage.
- Microsoft
- Salesforce
- Oracle
- SAP
- IBM
- ServiceNow
- Atlassian
- Intuit
- Adobe
- Google (Alphabet)
- Workday
- Zoom Video Communications
- Dropbox
- HubSpot
- Shopify
- Zendesk
- Snowflake
- Alteryx
- ServiceTitan
- BambooHR
Additional Benefits:
- The market estimate (ME) sheet in Excel format
- 3 months of analyst support
TABLE OF CONTENTS
1 INTRODUCTION
- 1.1 Study Assumptions and Market Definition
- 1.2 Scope of the Study
2 RESEARCH METHODOLOGY
3 EXECUTIVE SUMMARY
4 MARKET LANDSCAPE
- 4.1 Market Overview
- 4.2 Market Drivers
- 4.2.1 Proliferation of cloud-native architectures
- 4.2.2 Rapid SME digitalization post-COVID
- 4.2.3 Lower upfront costs vs. on-prem licensing
- 4.2.4 Generative-AI-enabled revenue extensions
- 4.2.5 Edge-delivered ultra-low-latency SaaS
- 4.2.6 Carbon-accounting compliance demand
- 4.3 Market Restraints
- 4.3.1 Data-sovereignty and compliance barriers
- 4.3.2 Vendor lock-in and switching costs
- 4.3.3 FinOps scrutiny curbing SaaS sprawl
- 4.3.4 Green-cloud mandates raising costs
- 4.4 Regulatory Landscape
- 4.5 Technological Outlook
- 4.6 Porter's Five Forces Analysis
- 4.6.1 Bargaining Power of Suppliers
- 4.6.2 Bargaining Power of Buyers
- 4.6.3 Threat of New Entrants
- 4.6.4 Threat of Substitutes
- 4.6.5 Competitive Rivalry
- 4.7 Investment Analysis
- 4.8 Assessment of Macroeconomic Impact
5 MARKET SIZE AND GROWTH FORECASTS (VALUE)
- 5.1 By Deployment
- 5.1.1 Public Cloud
- 5.1.2 Private Cloud
- 5.1.3 Hybrid Cloud
- 5.2 By Enterprise Size
- 5.2.1 Small and Medium-sized Enterprises (SMEs)
- 5.2.2 Large Enterprises
- 5.3 By Application Type
- 5.3.1 Customer Relationship Management (CRM)
- 5.3.2 Enterprise Resource Planning (ERP)
- 5.3.3 Human Capital Management (HCM/HRM)
- 5.3.4 Collaboration and Productivity
- 5.3.5 Business Intelligence and Analytics
- 5.3.6 Security and Compliance
- 5.3.7 Other Applications
- 5.4 By Pricing Model
- 5.4.1 Subscription-Based
- 5.4.2 Usage-Based / Pay-As-You-Go
- 5.4.3 Freemium and Tiered
- 5.5 By End-User Vertical
- 5.5.1 IT and Telecom
- 5.5.2 Banking, Financial Services and Insurance (BFSI)
- 5.5.3 Retail and E-Commerce
- 5.5.4 Healthcare and Life Sciences
- 5.5.5 Manufacturing
- 5.5.6 Other Verticals
- 5.6 By Geography
- 5.6.1 North America
- 5.6.1.1 United States
- 5.6.1.2 Canada
- 5.6.1.3 Mexico
- 5.6.2 South America
- 5.6.2.1 Brazil
- 5.6.2.2 Argentina
- 5.6.2.3 Colombia
- 5.6.2.4 Rest of South America
- 5.6.3 Europe
- 5.6.3.1 United Kingdom
- 5.6.3.2 Germany
- 5.6.3.3 France
- 5.6.3.4 Italy
- 5.6.3.5 Spain
- 5.6.3.6 Rest of Europe
- 5.6.4 Asia-Pacific
- 5.6.4.1 China
- 5.6.4.2 Japan
- 5.6.4.3 India
- 5.6.4.4 South Korea
- 5.6.4.5 Australia and New Zealand
- 5.6.4.6 Rest of Asia-Pacific
- 5.6.5 Middle East
- 5.6.5.1 Israel
- 5.6.5.2 Saudi Arabia
- 5.6.5.3 United Arab Emirates
- 5.6.5.4 Turkey
- 5.6.5.5 Rest of Middle East
- 5.6.6 Africa
- 5.6.6.1 South Africa
- 5.6.6.2 Egypt
- 5.6.6.3 Nigeria
- 5.6.6.4 Rest of Africa
- 5.6.1 North America
6 COMPETITIVE LANDSCAPE
- 6.1 Market Concentration
- 6.2 Strategic Moves (MandA, Funding, Partnerships)
- 6.3 Market Share Analysis
- 6.4 Company Profiles (includes Global level Overview, Market level overview, Core Segments, Financials as available, Strategic Information, Market Rank/Share for key companies, Products and Services, and Recent Developments)
- 6.4.1 Microsoft
- 6.4.2 Salesforce
- 6.4.3 Oracle
- 6.4.4 SAP
- 6.4.5 IBM
- 6.4.6 ServiceNow
- 6.4.7 Atlassian
- 6.4.8 Intuit
- 6.4.9 Adobe
- 6.4.10 Google (Alphabet)
- 6.4.11 Workday
- 6.4.12 Zoom Video Communications
- 6.4.13 Dropbox
- 6.4.14 HubSpot
- 6.4.15 Shopify
- 6.4.16 Zendesk
- 6.4.17 Snowflake
- 6.4.18 Alteryx
- 6.4.19 ServiceTitan
- 6.4.20 BambooHR
7 MARKET OPPORTUNITIES AND FUTURE OUTLOOK
- 7.1 White-Space and Unmet-Need Assessment
 醫療保健 SaaS 市場預測至 2034 年—按部署模式、訂閱模式、組織規模、應用程式、最終用戶和地區分類的全球分析
 人工智慧(AI)軟體即服務(SaaS)市場:按技術、雲端類型、企業類型、產業、國家和地區分類-全球產業分析、市場規模、市場佔有率及2026年至2033年預測
 軟體即服務 (SaaS) 市場:2026 年至 2032 年全球市場預測(按部署模式、組織規模、產業、應用程式類型和定價模式)內容與應用服務市場:2026-2032年全球市場預測(按組件、部署類型、組織規模、應用和產業分類)
 2026年全球SaaS人力資源解決方案市場報告2026年全球抗量子安全程式碼庫市場報告2026年全球軟體即服務(SaaS) 託管服務市場報告
 SaaS資金籌措市場規模、佔有率和趨勢分析報告:按資金籌措類型、公司規模、最終用戶行業、地區和細分市場預測(2026-2033年)2026年全球軟體即服務(SaaS)市場報告
 2026-2030年全球軟體即服務(SaaS)市場