

 |
市場調查報告書
商品編碼
2065520
邊緣AI GPU:市佔率分析、產業趨勢與統計及成長預測(2026-2031年)Edge AI GPU - Market Share Analysis, Industry Trends & Statistics, Growth Forecasts (2026 - 2031) |
||||||
※ 本網頁內容可能與最新版本有所差異。詳細情況請與我們聯繫。
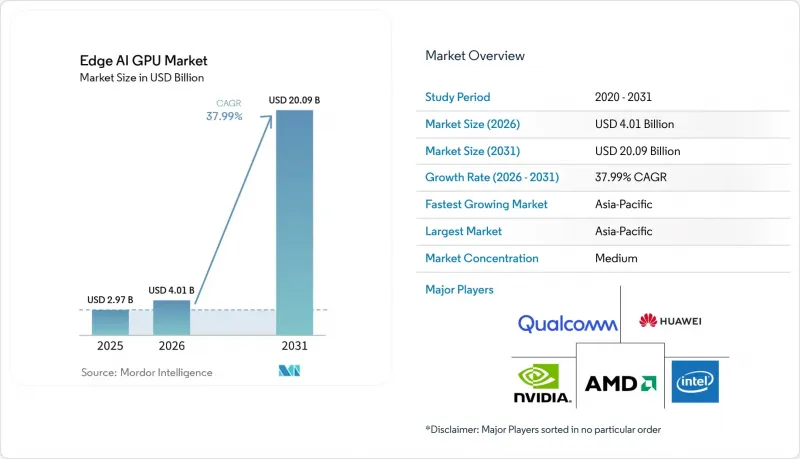
根據 Mordor Intelligence 預測,邊緣 AI GPU 的市場規模預計將從 2025 年的 29.7 億美元成長到 2031 年的 40.1 億美元,2026 年至 2031 年的複合年成長率將達到 37.99%。
本報告按GPU類型(整合GPU和獨立GPU)、部署模式(邊緣伺服器/閘道器和嵌入式邊緣設備)、應用領域(影像分析和監控、工業人工智慧、機器人和自動化等)以及地區(北美、歐洲、亞太、南美等)進行細分。市場預測以美元(USD)計價。
全球邊緣AI GPU市場趨勢與洞察
物聯網設備的激增需要低延遲人工智慧處理
預計到2025年,全球需要設備端推理的物聯網終端部署數量將超過150億,這將迫使企業擺脫以雲端為中心的工作流程。 80-120毫秒的往返延遲對於封閉回路型機器人、手術器械和工業製程控制而言並不適用。 ABB的現場測試表明,將GPU推理引入感測器可以將延遲降低到5毫秒以下,將協作機器人的循環時間縮短40%。目前,供應商正在開發具有動態電壓調節功能的5奈米SoC,以將功耗控制在15瓦以下,從而支援無風扇工業設計。這一趨勢正在顯著擴大汽車、醫療設備和智慧公用事業領域對邊緣AI GPU的潛在需求。
5G的快速部署將提升邊緣頻寬。
預計到2025年中期,獨立組網(SA)5G部署將顯著擴展,實現網路切片,從而為邊緣推理提供低於10毫秒的路徑。韓國通訊業者已於2024年完成全國範圍的部署,位於首爾的九老數位綜合體(GQD)支援超過2000個GPU節點,用於即時品質檢測。歐盟累計9億歐元(約10.1億美元)用於推動類似部署,並強制要求通訊業者在基地台機房旁安裝GPU伺服器。在新興市場,每個獨立組網小區的資本支出(CAPEX)仍高達15萬美元,但在延遲敏感型分析方面的提案已得到證實,這促使電信生態系統中邊緣人工智慧對GPU的採用率不斷提高。
GPU的高功耗和散熱限制
一塊功耗為 75 瓦的獨立 GPU 每小時會產生 256 BTU 的熱量,這對 IP65 防護等級的密封外殼來說負擔過重。廠商正在降低晶片時脈頻率,導致實際吞吐量比實驗室額定值降低高達 20%,從而縮小了相對於 5 瓦以下神經網路處理器的優勢。英特爾計劃在 2025 年推出一款 50 瓦的「Arc A380E」顯示卡,但在對成本要求較高的市場,它將面臨英偉達 30 瓦「Orin NX」顯示卡的競爭。歐洲的工業設施每年為每個 75 瓦節點支付 95 歐元(約 107 美元)的電費,如果安裝數量超過 500 個,成本將大幅增加。因此,電池供電的現場感測器將繞過混合架構中的 GPU,這將限制邊緣 AI GPU 在超低功耗邊緣運算領域的短期市場滲透率。
細分市場分析
到2025年,整合GPU將佔據邊緣AI GPU市場61.59%的佔有率。這反映了其在POS終端、工業人機介面螢幕和車載資訊娛樂系統等領域的日益普及。驍龍8 Gen 3和天璣9300 SoC的功耗在5-15瓦範圍內,非常適合無風扇機殼。獨立GPU雖然出貨量較小,但其複合年成長率高達38.48%,以支援需要12 TFLOPS/30幀/秒性能的4K視訊分析流。蘋果的40核心「M3 Max」將65 TFLOPS的性能整合到一體式外形規格中,模糊了產品類別的界限,其性能可與入門級獨立GPU相媲美。隨著歐洲生態設計標籤於2024年生效,在公共採購中優先考慮整合晶片,這個細分市場將進一步鞏固其在整體邊緣AI GPU市場中的地位。
在純粹的平行處理能力遠超過功耗限制的領域,獨立顯示卡仍佔據主導地位。例如,70瓦的RTX A2000可提供26 TFLOPS的運算能力,使市政交通分析中每個攝影機的即時偵測數量加倍。隨著基於變壓器的視覺模型參數數量激增至超過1億,配備專用張量核心的獨立顯示卡正在加速其在工廠和智慧城市的部署。在異質藍圖中,隨著更多GPU模組堆疊在SoC之上,整合顯示卡和獨立顯示卡的效能指標正在趨於一致。
區域分析
預計到2025年,亞太地區將佔據邊緣AI GPU市場66.71%的佔有率,並在2031年之前以38.83%的複合年成長率成長。中國已訂購80萬個GPU節點,用於其智慧城市項目,作為其「新基礎建設」宣傳活動的一部分。日本已累計500億日圓(約3.4億美元)補貼中小型製造商,以促進其轉型為邊緣AI。韓國計畫在2025年交付4.5萬台具備GPU推理能力的協作機器人。印度的目標是到2027年在農業和醫療領域部署1萬個GPU節點。
北美排名第二。美國能源局已撥款4.5億美元,用於2025年電網邊緣分析試點項目,在變電站安裝GPU節點。在加拿大一家汽車工廠,GPU被用於焊接視覺引導和缺陷零件的修整。歐洲GDPR的資料最小化原則正促使企業使用本地GPU,一家德國汽車製造商透過預測性維護將停機時間減少了25%。
儘管南美洲的市佔率目前較小,但隨著基於GPU的遙感探測在巴西農場和智利礦場的部署,其市佔率正在成長。在中東和非洲,杜拜正在啟動智慧城市早期部署,已部署5,000個GPU節點進行交通分析。出口限制制約了俄羅斯和其他一些市場的出貨,在一定程度上限制了邊緣AI GPU市場的地理擴張。
其他好處:
- Excel格式的市場預測(ME)表
- 3個月的分析師支持
目錄
第1章:引言
- 研究假設和市場定義
- 調查範圍
第2章:調查方法
第3章執行摘要
第4章 市場狀況
- 市場概覽
- 市場促進因素
- 物聯網設備的激增需要低延遲人工智慧處理
- 5G的快速部署帶來了邊緣頻寬的提升。
- 智慧城市對即時影像分析的需求日益成長
- 擴大自主移動機器人在製造業的應用
- 資料隱私法規的進步正在推動設備內處理。
- 醫藥物流中低溫運輸邊緣節點的興起
- 市場限制因素
- GPU的高功耗和散熱限制
- 先進包裝供應鏈能力不足
- 邊緣站點部署容器化GPU堆疊的技能差距
- 透過法規限制GPU的供應,進而實施出口管制
- 產業價值鏈分析
- 監理情勢
- 技術展望
- 宏觀經濟因素對市場的影響
- 波特五力分析
第5章 市場規模與成長預測
- 按GPU類型
- 整合顯示卡
- 獨立顯示卡
- 依部署類型
- 邊緣伺服器/閘道器
- 嵌入式邊緣設備
- 透過使用
- 影像分析和監控
- 工業人工智慧
- 機器人與自動化
- 醫療保健人工智慧
- 按地區
- 北美洲
- 美國
- 加拿大
- 墨西哥
- 歐洲
- 德國
- 英國
- 法國
- 義大利
- 其他歐洲國家
- 亞太地區
- 中國
- 日本
- 韓國
- 印度
- 東南亞
- 其他亞太國家
- 南美洲
- 中東
- 非洲
- 北美洲
第6章 競爭情勢
- 市場集中度
- 策略趨勢
- 市佔率分析
- 公司簡介
- NVIDIA Corporation
- Intel Corporation
- Advanced Micro Devices Inc.
- Qualcomm Technologies Inc.
- Huawei Technologies Co. Ltd.
- Samsung Electronics Co. Ltd.
- Apple Inc.
- MediaTek Inc.
- Dell Technologies Inc.
- Hewlett Packard Enterprise Co.
- Lenovo Group Ltd.
- Super Micro Computer Inc.
- ADLINK Technology Inc.
- Advantech Co. Ltd.
- Hailo Technologies Ltd.
- Kneron Inc.
第7章 市場機會與未來展望
According to Mordor Intelligence, the edge AI GPU market size expanded from USD 2.97 billion in 2025 to USD 4.01 billion in 2031, registering a 37.99% CAGR from 2026 to 2031.
This report is Segmented by GPU Type (Integrated GPUs and Discrete GPUs), Deployment Type (Edge Servers/Gateways and Embedded Edge Devices), Application (Video Analytics and Surveillance, Industrial AI, Robotics and Automation, and More), and Geography (North America, Europe, Asia-Pacific, South America, and More). The Market Forecasts are Provided in Terms of Value (USD).
Global Edge AI GPU Market Trends and Insights
Proliferation of IoT Devices Requiring Low-Latency AI Processing
The global installed base of IoT endpoints needing on-device inference surpassed 15 billion units in 2025, forcing enterprises to abandon cloud-centric workflows. Round-trip latency of 80-120 milliseconds is incompatible with closed-loop robotics, surgical equipment, and industrial process control. Deploying GPU inference at the sensor collapses latency to under 5 milliseconds and cuts cycle times for collaborative robots by 40% in ABB field trials. Vendors now build 5 nm SoCs with dynamic voltage scaling to keep power under 15 watts, aligning with fanless industrial designs. The trend materially expands addressable edge AI GPU market demand across automotive lines, medical devices, and smart utilities.
Rapid Deployment of 5G Enhancing Edge Bandwidth
Standalone 5G deployments expanded significantly by mid-2025, enabling network slices that deliver sub-10-millisecond paths for edge inference. South Korean operators completed nationwide rollouts in 2024, supporting more than 2,000 GPU nodes at Seoul's Guro Digital Complex for real-time quality inspection. The European Union earmarked EUR 900 million (USD 1.01 billion) in 2025 to seed similar deployments, compelling carriers to co-locate GPU servers at base-station shelters. While the USD 150,000 CAPEX per standalone cell remains high in emerging economies, the value proposition for latency-sensitive analytics is now proven, widening the adoption of edge AI GPUs in telecom ecosystems.
High Power Consumption and Thermal Constraints of GPUs
Discrete GPUs drawing 75 watts generate 256 BTU per hour, overwhelming sealed IP65 enclosures. Vendors down-clock silicon, cutting throughput by up to 20% versus lab ratings, which narrows the advantage over sub-5-watt neural processors. Intel launched a 50-watt Arc A380E variant in 2025, but it faces NVIDIA's 30-watt Orin NX in cost-sensitive segments. European industrial sites pay EUR 95 (USD 107) in annual power for each 75-watt node, a charge that multiplies across 500-plus installations. Battery-powered field sensors, therefore, bypass GPUs for hybrid architectures, capping near-term edge AI GPU market penetration in ultra-low-power edge niches.
Other drivers and restraints analyzed in the detailed report include:
- Rising Demand for Real-Time Video Analytics in Smart Cities
- Growing Adoption of Autonomous Mobile Robots in Manufacturing
- Supply-Chain Shortages of Advanced Packaging Capacity
For complete list of drivers and restraints, kindly check the Table Of Contents.
Segment Analysis
Integrated GPUs held 61.59% share of the edge AI GPU market size in 2025, reflecting design wins in point-of-sale terminals, industrial HMI screens, and automotive infotainment. Snapdragon 8 Gen 3 and Dimensity 9300 SoCs fall within the 5-15 watt envelope, ideal for fanless chassis. Discrete GPUs, although smaller in volume, are expanding at a 38.48% CAGR to support 4K video analytics streams that require 12 TFLOPS at 30 FPS. Apple's 40-core M3 Max blurred category lines by packing 65 TFLOPS into an integrated form factor, rivaling entry discrete cards. European Ecodesign labeling, effective from 2024, privileges integrated silicon in public procurements, further anchoring this segment within the broader edge AI GPU market.
Discrete devices still dominate where raw parallelism trumps power limits. An RTX A2000 at 70 watts offers 26 TFLOPS, doubling real-time detections per camera in municipal traffic analytics. As transformer-based vision models swell past 100 million parameters, discrete SKUs with dedicated tensor cores accelerate uptake in factories and smart cities. Heterogeneous roadmaps now see SoCs stacking extra GPU tiles, converging the performance vectors of integrated and discrete solutions.
Geography Analysis
Asia-Pacific held 66.71% of the edge AI GPU market share in 2025 and is projected to grow at 38.83% CAGR to 2031. China ordered 800,000 GPU-ready nodes for smart-city programs under the New Infrastructure campaign. Japan budgeted JPY 50 billion (USD 340 million) in subsidies for small and medium manufacturers upgrading to edge AI. South Korea shipped 45,000 collaborative robots with GPU inference in 2025. India's mission aims to deploy 10,000 GPU nodes by 2027 across the agriculture and health sectors.
North America ranks second. The U.S. Department of Energy funded USD 450 million in grid-edge analytics pilots in 2025, installing GPU nodes at substations. Canadian auto plants used GPUs for welding vision-guidance and defect trimming. Europe's GDPR data-minimization principle directs enterprises toward local GPUs, and Germany's automakers cut downtime by 25% through predictive maintenance.
South America's share is smaller but rising as Brazilian farms and Chilean mines adopt GPU-based remote sensing. The Middle East and Africa are seeing early smart-city deployments in Dubai, including 5,000 GPU nodes for traffic analytics. Export-control rules limit shipments to Russia and select markets, modestly tempering wider geographic uptake of the edge AI GPU market.
- NVIDIA Corporation
- Intel Corporation
- Advanced Micro Devices Inc.
- Qualcomm Technologies Inc.
- Huawei Technologies Co. Ltd.
- Samsung Electronics Co. Ltd.
- Apple Inc.
- MediaTek Inc.
- Dell Technologies Inc.
- Hewlett Packard Enterprise Co.
- Lenovo Group Ltd.
- Super Micro Computer Inc.
- ADLINK Technology Inc.
- Advantech Co. Ltd.
- Hailo Technologies Ltd.
- Kneron Inc.
Additional Benefits:
- The market estimate (ME) sheet in Excel format
- 3 months of analyst support
TABLE OF CONTENTS
1 INTRODUCTION
- 1.1 Study Assumptions and Market Definition
- 1.2 Scope of the Study
2 RESEARCH METHODOLOGY
3 EXECUTIVE SUMMARY
4 MARKET LANDSCAPE
- 4.1 Market Overview
- 4.2 Market Drivers
- 4.2.1 Proliferation of IoT Devices Requiring Low-Latency AI Processing
- 4.2.2 Rapid Deployment of 5G Enhancing Edge Bandwidth
- 4.2.3 Rising Demand for Real-Time Video Analytics in Smart Cities
- 4.2.4 Growing Adoption of Autonomous Mobile Robots in Manufacturing
- 4.2.5 Regulatory Push for Data Privacy Favouring On-Device Processing
- 4.2.6 Emergence of Cold-Chain Edge Nodes in Pharmaceutical Logistics
- 4.3 Market Restraints
- 4.3.1 High Power Consumption and Thermal Constraints of GPUs
- 4.3.2 Supply-Chain Shortages of Advanced Packaging Capacity
- 4.3.3 Skills Gap in Deploying Containerised GPU Stacks at Edge Sites
- 4.3.4 Regulatory Export Controls Limiting GPU Availability
- 4.4 Industry Value-Chain Analysis
- 4.5 Regulatory Landscape
- 4.6 Technological Outlook
- 4.7 Impact of Macroeconomic Factors on the Market
- 4.8 Porter's Five Forces Analysis
- 4.8.1 Threat of New Entrants
- 4.8.2 Bargaining Power of Suppliers
- 4.8.3 Bargaining Power of Buyers
- 4.8.4 Threat of Substitutes
- 4.8.5 Competitive Rivalry
5 MARKET SIZE AND GROWTH FORECASTS (VALUE)
- 5.1 By GPU Type
- 5.1.1 Integrated GPUs
- 5.1.2 Discrete GPUs
- 5.2 By Deployment Type
- 5.2.1 Edge Servers / Gateways
- 5.2.2 Embedded Edge Devices
- 5.3 By Application
- 5.3.1 Video Analytics and Surveillance
- 5.3.2 Industrial AI
- 5.3.3 Robotics and Automation
- 5.3.4 Healthcare AI
- 5.4 By Geography
- 5.4.1 North America
- 5.4.1.1 United States
- 5.4.1.2 Canada
- 5.4.1.3 Mexico
- 5.4.2 Europe
- 5.4.2.1 Germany
- 5.4.2.2 United Kingdom
- 5.4.2.3 France
- 5.4.2.4 Italy
- 5.4.2.5 Rest of Europe
- 5.4.3 Asia-Pacific
- 5.4.3.1 China
- 5.4.3.2 Japan
- 5.4.3.3 South Korea
- 5.4.3.4 India
- 5.4.3.5 Southeast Asia
- 5.4.3.6 Rest of Asia-Pacific
- 5.4.4 South America
- 5.4.5 Middle East
- 5.4.6 Africa
- 5.4.1 North America
6 COMPETITIVE LANDSCAPE
- 6.1 Market Concentration
- 6.2 Strategic Moves
- 6.3 Market Share Analysis
- 6.4 Company Profiles (includes Global Level Overview, Market Level Overview, Core Segments, Financials as available, Strategic Information, Market Rank/Share, Products and Services, Recent Developments)
- 6.4.1 NVIDIA Corporation
- 6.4.2 Intel Corporation
- 6.4.3 Advanced Micro Devices Inc.
- 6.4.4 Qualcomm Technologies Inc.
- 6.4.5 Huawei Technologies Co. Ltd.
- 6.4.6 Samsung Electronics Co. Ltd.
- 6.4.7 Apple Inc.
- 6.4.8 MediaTek Inc.
- 6.4.9 Dell Technologies Inc.
- 6.4.10 Hewlett Packard Enterprise Co.
- 6.4.11 Lenovo Group Ltd.
- 6.4.12 Super Micro Computer Inc.
- 6.4.13 ADLINK Technology Inc.
- 6.4.14 Advantech Co. Ltd.
- 6.4.15 Hailo Technologies Ltd.
- 6.4.16 Kneron Inc.
7 MARKET OPPORTUNITIES AND FUTURE OUTLOOK
- 7.1 White-Space and Unmet-Need Assessment
 邊緣人工智慧推理晶片市場預測至2034年—按晶片類型、製程節點、功耗、應用、最終用戶和地區分類的全球分析
 人工智慧處理器市場:按技術、應用、部署模式、最終用戶、國家和地區分類-全球產業分析、市場規模、市場佔有率及2026年至2033年預測邊緣人工智慧NPU市場預測至2034年—全球組件、類型、外形規格、技術、應用、最終用戶和區域分析邊緣人工智慧分析市場預測至2034年—按組件、部署模式、資料類型、應用、最終用戶、用例複雜性和區域分類的全球分析邊緣人工智慧分析平台市場預測—全球分析(按組件、分析類型、部署模式、輸入來源、技術、應用和地區分類)—2034年邊緣人工智慧工業監控市場預測至2034年——按組件、人工智慧模型類型、安全協議、應用、最終用戶和地區分類的全球分析邊緣運算處理器市場預測至2034年-按處理器類型、應用、最終用戶和地區分類的全球分析
 2026-2030年全球邊緣人工智慧安全市場
 TinyML全球市場2026-2030邊緣人工智慧平台市場預測——全球分析(按組件、部署模式、平台類型、技術、連接方式、邊緣設備類型、組織規模、應用、最終用戶和地區分類)——2034年