


 |
市場調查報告書
商品編碼
2065497
GPU伺服器:市佔率分析、產業趨勢與統計、成長預測(2026-2031年)GPU Server - Market Share Analysis, Industry Trends & Statistics, Growth Forecasts (2026 - 2031) |
||||||
※ 本網頁內容可能與最新版本有所差異。詳細情況請與我們聯繫。
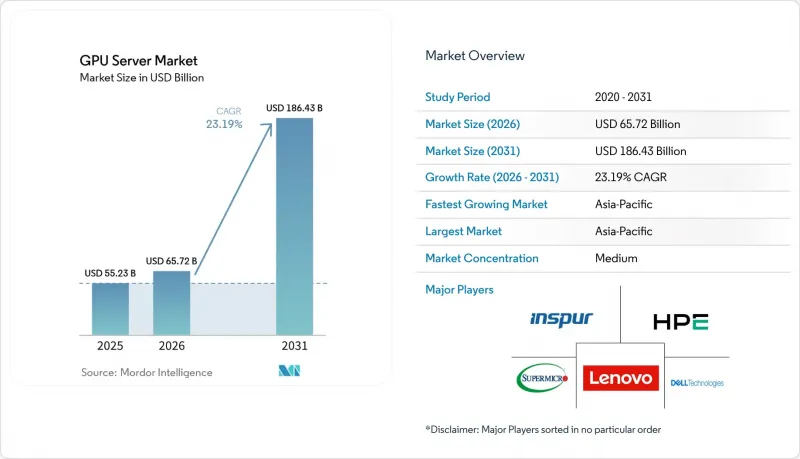
據 Mordor Intelligence 稱,2025 年 GPU 伺服器市值為 552.3 億美元,預計到 2031 年將達到 1864.3 億美元,而 2026 年為 657.2 億美元,預測期(2026-2031 年)的複合年成長率為 23.19%。
本報告按部署類型(資料中心、邊緣)、工作負載(AI 訓練、AI 推理等)、配置(單 GPU、多 GPU)、外形規格(機架式、刀片式等)、GPU 整合方式(基於 PCIe、基於 SXM/NVLink 等)、最終用戶(雲端服務供應商、企業、政府和研究機構等)以及地區政府進行細分。市場預測以美元 (USD) 為單位。
全球GPU伺服器市場趨勢與洞察
超大規模資料中心對人工智慧訓練能力的需求激增
超大規模營運商正在部署包含超過 10 萬個加速器的集群,用於訓練擁有超過兆個參數的尖端模型。要達到如此規模需要投資建置專用變電站和高容量互連網路。 Meta 的目標是營運約 60 萬個 H100 級 GPU,而微軟計劃在 2026 會計年度 800 億美元的計畫中,投資數十億美元用於水冷機架。為期 10 至 20 年的購電協議可確保每個園區獲得 50 至 100 兆瓦的電力。歐盟和中東地區自主制定的 AI 政策強制要求在本地託管高度敏感的訓練數據,進一步推動了對 GPU 伺服器的需求。這些發展共同增強了訓練能力的基礎,並將 GPU 伺服器的訂單預測延長至未來數年。
生成式人工智慧的蓬勃發展正在加速GPU伺服器的升級換代。
企業正在將傳統的四年伺服器生命週期縮短至兩年,以GPU加速器取代CPU密集型節點,以運行聊天機器人、程式碼助理和多模態內容工具。戴爾報告稱,2025會計年度GPU伺服器訂單量將加倍,HPE也宣布其AI最佳化系統銷售量成長了35%。 NVIDIA的「Blackwell」系列和AMD的「MI300」系列顯示卡每瓦效能提升2-3倍,這為淘汰兩年前推出的硬體提供了理由。此外,企業需要大量記憶體來支援多模態模型,這也推動了配備最新GPU的伺服器的採購。
先進封裝基板的供應鏈限制
台積電的CoWoS產能於2025年擴大了50%,但訂單仍超過供應量,訂單將持續到2026年上半年。 SK海力士的HBM3生產線已滿載運作,迫使英偉達和AMD限制其核心產品的供應。美國對中國封裝設備的出口限制導致生產集中在台灣和韓國,加劇了風險。這種供不應求導致企業交貨延遲長達九個月,阻礙了資料中心的擴張,並為OEM廠商的獲利前景帶來了不確定性。
細分市場分析
到2025年,邊緣部署在GPU伺服器市場中所佔佔有率將非常小。然而,預計此細分市場將以23.59%的複合年成長率穩定成長,逐步削弱資料中心的主導地位(資料中心在基準年佔了88.21%的營收佔有率)。推動這一成長的主要因素是5G賦能的商業模式的普及,這些模式優先考慮低於10毫秒的響應時間和本地數據處理,進一步提升了邊緣部署在不斷變化的市場格局中的重要性。儘管如此,預計到2031年,資料中心部署仍將是GPU伺服器市場的基礎。這主要是由於超大規模學習叢集的存在,這些叢集依靠每個機房數千個GPU來處理高要求的運算任務。
然而,邊緣運算領域正在迅速擴張,尤其是在韓國、日本和印度等人口稠密的城市地區。這些地區面臨著諸如可用資源有限以及需要接近性用戶等挑戰,因此邊緣部署成為更現實的解決方案。目前市場上正在湧現兩條截然不同的供應鏈:一條是面向邊緣應用的低功耗單GPU節點,這些節點採用堅固的機殼;另一條是面向核心資料中心園區的16GPU水冷機架。這種差異凸顯了驅動GPU伺服器市場的多樣化需求和應用。
預計人工智慧推理收入將以 23.99% 的複合年成長率成長,顯著高於整個 GPU 伺服器市場,甚至超過了訓練的成長率。雖然預計到 2025 年訓練收入將佔總收入的 53.47%,但 ChatGPT 等工具的每日推理查詢量已遠遠超過訓練輪數。這項轉變凸顯了現實世界應用中對推理能力日益成長的需求,因為企業和消費者越來越依賴人工智慧驅動的解決方案來完成各種任務。人工智慧模型的成熟是這一趨勢的主要驅動力。一旦多模態基礎模型訓練完成,它們就能支援開發涵蓋醫療保健、金融、零售和娛樂等眾多行業的數千種面向客戶的應用程式。
這些應用需要低延遲推理才能提供流暢且有效率的使用者體驗。為了滿足這一日益成長的需求,硬體供應商正在推出專門針對 INT8 和 FP8 計算最佳化的加速器 SKU,與 FP16 訓練卡相比,其每瓦吞吐量提高了 2-3 倍。硬體技術的這些進步使得推理處理更加有效率且經濟。因此,預計到本世紀末,與推理相關的 GPU 伺服器市場銷售額將超過與訓練相關的銷售額,這標誌著市場動態的重大轉變,也凸顯了人工智慧生態系統內部優先事項的變化。
區域分析
預計到2025年,亞太地區將佔據GPU伺服器市場67.63%的佔有率,到2031年將維持24.19%的複合年成長率。中國正逐步轉向國產GPU,華為「Ascend 910C」的出貨量便是例證,這在一定程度上抵消了H200進口量的下降。印度的資料中心建設計畫已突破1吉瓦大關,Yotta公司決定投資20億美元,力爭2027年前將其GPU機房容量提升三倍。日本已撥款1000億韓元(約6.9億美元)用於建造百萬兆級超級電腦,以接替“富嶽”,重點利用GPU加速人工智慧和氣候研究。韓國已撥款5,000億韓元(約3.75億美元)用於建構國家人工智慧運算骨幹網,該骨幹網將結合國產HBM3和進口GPU。
預計到2025年,北美將佔全球銷售額的約20%,這主要得益於Meta、微軟和谷歌承諾到2026年投資超過2000億美元用於人工智慧基礎設施建設。維吉尼亞北部電網的限制導致互聯延遲過長,促使新建設轉向可再生能源資源豐富的中西部和山區。儘管邊緣運算部署在美國正在推進,但其用戶採用率仍落後於亞太地區。
預計到2025年,歐洲將佔全球銷售額的約10%。平均每千瓦時0.30歐元(0.32美元)的高電價和嚴格的碳排放法規抑制了市場擴張,但也推動了水冷技術的應用。營運商正將目光轉向斯堪地那維亞市場,尋求更便宜的水力發電,而歐盟內部各國主導的人工智慧需求則使該地區的GPU需求維持在最低水平。南美洲、中東和非洲總合佔比不到5%,但沙烏地阿拉伯和阿拉伯聯合大公國正在資助國家主導的人工智慧叢集,這可能會在預測期後半段提升該地區的市場佔有率。
其他好處:
- Excel格式的市場預測(ME)表
- 3個月的分析師支持
目錄
第1章:引言
- 研究假設和市場定義
- 調查範圍
第2章:調查方法
第3章執行摘要
第4章 市場狀況
- 市場概覽
- 市場促進因素
- 超大規模資料中心對人工智慧訓練能力的需求激增
- 生成式人工智慧的蓬勃發展正在推動GPU伺服器的升級週期。
- 金融科技和零售業對GPU加速資料庫的採用正在不斷擴大。
- 政府資助的百萬兆級運算項目
- 在網路邊緣引入大規模語言模型推理。
- 過渡到液冷高密度機架
- 市場限制因素
- 先進封裝基板的供應鏈限制
- 由於資料中心電力成本飆升,導致總擁有成本 (TCO) 增加。
- 高階GPU的地緣政治出口限制
- 異質系統中平行程式設計的技能差距
- 宏觀經濟因素對市場的影響
- 產業價值鏈分析
- 監理情勢
- 技術展望
- 波特五力分析
第5章 市場規模與成長預測
- 不同的發展
- 資料中心
- 邊緣
- 按工作量
- 人工智慧訓練
- 人工智慧推理
- HPC
- 視覺化
- 透過配置
- 單GPU
- 多GPU(2-4)
- 按外形規格
- 架子
- 刀刃
- 模組化的
- GPU 整合類型
- 基於 PCIe 的
- 基於 SXM/NVLink
- OAM 基地
- 最終用戶
- 雲端服務供應商(超大規模資料中心業者)
- 公司
- 政府和研究機構
- 通訊業者/邊緣營運商
- 按地區
- 北美洲
- 美國
- 加拿大
- 墨西哥
- 歐洲
- 英國
- 德國
- 法國
- 其他歐洲國家
- 亞太地區
- 中國
- 日本
- 印度
- 韓國
- 其他亞太國家
- 南美洲
- 中東和非洲
- 北美洲
第6章 競爭情勢
- 市場集中度
- 策略趨勢
- 市佔率分析
- 公司簡介
- Dell Technologies Inc.
- Hewlett Packard Enterprise Company
- Lenovo Group Limited
- Super Micro Computer Inc.
- Inspur Group Co. Ltd.
- Huawei Technologies Co. Ltd.
- GIGABYTE Technology Co. Ltd.
- ASUSTeK Computer Inc.
- NVIDIA Corporation
- Advanced Micro Devices Inc.
- International Business Machines Corporation
- Fujitsu Limited
- Atos SE
- Penguin Computing Inc.
- TYAN Computer Corporation
- H3C Technologies Co. Ltd.
- BOXX Technologies LLC
- Lambda Labs Inc.
- NEC Corporation
- Sugon Information Industry Co. Ltd.
第7章 市場機會與未來展望
According to Mordor Intelligence, the gPU server market size was valued at USD 55.23 billion in 2025 and estimated to grow from USD 65.72 billion in 2026 to reach USD 186.43 billion by 2031, at a CAGR of 23.19% during the forecast period (2026-2031).
This report is Segmented by Deployment (Data Center, Edge), Workload (AI Training, AI Inference, and More), Configuration (Single GPU, and Multi-GPU), Form Factor (Rack, Blade, and More), GPU Integration (PCIe-Based, SXM/NVLink-based, and More), End-User (Cloud Service Providers, Enterprise, Government and Research Institutions, and More), and Geography. The Market Forecasts are Provided in Terms of Value (USD).
Global GPU Server Market Trends and Insights
Surging Demand for AI Training Capacity in Hyperscale Data Centers
Hyperscale operators are rolling out clusters containing more than 100,000 accelerators to train frontier models with parameter counts exceeding 1 trillion, a scale that requires investment in dedicated substations and high-capacity interconnects. Meta aims to operate roughly 600,000 H100-class GPUs, while Microsoft's USD 80 billion fiscal-2026 plan steers billions toward liquid-cooled racks. Power-purchase agreements stretching 10-20 years are locking in 50-100 megawatts per campus. Sovereign AI policies in the European Union and the Middle East are driving incremental demand by requiring local hosting of sensitive training data. Collectively, these moves lift the base of training capacity, extending multi-year visibility for GPU server orders.
Generative AI Boom Driving GPU Server Refresh Cycles
Enterprises have trimmed the traditional four-year server life cycle to barely two, swapping CPU-heavy nodes for GPU accelerators to run chatbots, code assistants, and multimodal content tools. Dell reported a doubling of GPU server bookings in fiscal 2025, and HPE posted 35% growth in AI-optimized systems. The debut of NVIDIA's Blackwell and AMD's MI300 families, each offering 2-3X the performance per watt, creates a financial case for retiring hardware installed just 2 years ago. Enterprises also need larger memory footprints to support multimodal models, driving purchases of servers equipped with the latest GPUs.
Supply Chain Constraints for Advanced Packaging Substrates
CoWoS capacity at TSMC expanded by 50% in 2025 yet remained oversubscribed, with booking queues stretching into the first half of 2026. SK Hynix kept HBM3 lines fully allocated, forcing NVIDIA and AMD to ration flagship parts. U.S. curbs on shipments of packaging equipment to China compound the risk by centralizing production in Taiwan and South Korea. The shortfall delays enterprise deliveries by up to 9 months, stalling data center buildouts and compressing revenue visibility for OEMs.
Other drivers and restraints analyzed in the detailed report include:
- Deployment of Large-Language-Model Inference at the Network Edge
- Shift Toward Liquid-Cooled High-Density Racks
- Escalating TCO Due to Soaring Data-Center Power Tariffs
For complete list of drivers and restraints, kindly check the Table Of Contents.
Segment Analysis
Edge installations accounted for a modest slice of the GPU server market share in 2025. However, this segment is projected to grow at a robust CAGR of 23.59%, gradually reducing the dominance of data centers, which commanded 88.21% of the revenue in the base year. This growth is primarily driven by the adoption of 5G-enabled monetization models that prioritize sub-10-millisecond response times and local data processing, making edge installations increasingly relevant in the evolving market landscape. Despite this growth, data-center deployments are expected to remain the cornerstone of the GPU server market through 2031. This is largely due to hyperscale training clusters that rely on thousands of GPUs per hall to handle intensive computational tasks.
Nevertheless, the edge segment is expanding faster, particularly in regions such as South Korea, Japan, and densely populated metropolitan areas in India. These regions face challenges such as limited real estate availability and the need for user proximity, making edge installations a more viable solution. The market is witnessing the emergence of two distinct supply chains: low-power single-GPU nodes housed in rugged enclosures for edge applications, and 16-GPU liquid-cooled racks designed for core data center campuses. This differentiation highlights the diverse requirements and applications driving the GPU server market forward.
AI inference revenue is projected to climb at a 23.99% CAGR, significantly outpacing the broader GPU server market and surpassing the growth rates of training. In 2025, training accounted for 53.47% of total revenue; however, the volume of daily inference queries for tools such as ChatGPT had already exceeded the number of training epochs by a substantial margin. This shift highlights the growing demand for inference capabilities in real-world applications, as businesses and consumers increasingly rely on AI-driven solutions for a range of tasks. The maturation of AI models is a key driver of this trend. Once a multimodal foundation model is trained, it enables the development of thousands of customer-facing applications across various industries, ranging from healthcare and finance to retail and entertainment.
These applications require low-latency inference to deliver seamless, efficient user experiences. In response to this growing demand, hardware vendors have introduced accelerator SKUs specifically optimized for INT8 and FP8 arithmetic, which deliver 2-3X the throughput per watt compared to FP16 training cards. These advancements in hardware technology are enabling more efficient and cost-effective inference operations. As a result, the GPU server market segment associated with inference is expected to surpass training revenue before the end of the decade, marking a significant shift in market dynamics and highlighting the evolving priorities within the AI ecosystem.
Geography Analysis
Asia-Pacific dominated the GPU server market share at 67.63% in 2025 and is projected to record a 24.19% CAGR to 2031. China's pivot to domestic GPUs, illustrated by Huawei's Ascend 910C shipments, partially offsets curtailed H200 imports. India's data-center pipeline broke the 1 gigawatt mark, with Yotta committing USD 2 billion to triple GPU hall capacity by 2027. Japan earmarked JPY 100 billion (USD 690 million) for an exascale successor to Fugaku, emphasizing GPU acceleration for AI and climate research. South Korea budgeted KRW 500 billion (USD 375 million) to build a national AI compute backbone, pairing domestic HBM3 with imported GPUs.
North America accounted for roughly 20% of 2025 revenue, underpinned by Meta, Microsoft, and Google pledging over USD 200 billion in AI infrastructure funding through 2026. Grid constraints in Northern Virginia lengthen interconnect queues, steering new construction into the Midwest and Mountain regions where renewable capacity is available. The U.S. also incubates edge deployments, though regional uptake lags Asia-Pacific on a per-subscriber basis.
Europe captured about 10% of revenue in 2025. High power tariffs averaging EUR 0.30 (USD 0.32) per kilowatt-hour and stringent carbon rules temper expansion, yet they also catalyze the adoption of liquid cooling. Operators pivot to Scandinavian markets for cheaper hydro power, while sovereign AI requirements inside the EU keep a baseline of in-region GPU demand. South America, the Middle East, and Africa remained sub-5% combined; however, Saudi Arabia and the United Arab Emirates are funding sovereign AI clusters that could lift regional share in the late forecast years.
- Dell Technologies Inc.
- Hewlett Packard Enterprise Company
- Lenovo Group Limited
- Super Micro Computer Inc.
- Inspur Group Co. Ltd.
- Huawei Technologies Co. Ltd.
- GIGABYTE Technology Co. Ltd.
- ASUSTeK Computer Inc.
- NVIDIA Corporation
- Advanced Micro Devices Inc.
- International Business Machines Corporation
- Fujitsu Limited
- Atos SE
- Penguin Computing Inc.
- TYAN Computer Corporation
- H3C Technologies Co. Ltd.
- BOXX Technologies LLC
- Lambda Labs Inc.
- NEC Corporation
- Sugon Information Industry Co. Ltd.
Additional Benefits:
- The market estimate (ME) sheet in Excel format
- 3 months of analyst support
TABLE OF CONTENTS
1 INTRODUCTION
- 1.1 Study Assumptions and Market Definition
- 1.2 Scope of the Study
2 RESEARCH METHODOLOGY
3 EXECUTIVE SUMMARY
4 MARKET LANDSCAPE
- 4.1 Market Overview
- 4.2 Market Drivers
- 4.2.1 Surging Demand for AI Training Capacity in Hyperscale Data Centers
- 4.2.2 Generative AI Boom Driving GPU Server Refresh Cycles
- 4.2.3 Rising Adoption of GPU-Accelerated Databases in FinTech and Retail
- 4.2.4 Government-Funded Exascale HPC Programs
- 4.2.5 Deployment of Large-Language-Model Inference at the Network Edge
- 4.2.6 Shift Toward Liquid-Cooled High-Density Racks
- 4.3 Market Restraints
- 4.3.1 Supply Chain Constraints for Advanced Packaging Substrates
- 4.3.2 Escalating TCO Due to Soaring Data-Center Power Tariffs
- 4.3.3 Geopolitical Export Controls on High-End GPUs
- 4.3.4 Skills Gap in Parallel Programming for Heterogeneous Systems
- 4.4 Impact of Macroeconomic Factors on the Market
- 4.5 Industry Value Chain Analysis
- 4.6 Regulatory Landscape
- 4.7 Technological Outlook
- 4.8 Porter's Five Forces Analysis
- 4.8.1 Bargaining Power of Suppliers
- 4.8.2 Bargaining Power of Buyers
- 4.8.3 Threat of New Entrants
- 4.8.4 Threat of Substitutes
- 4.8.5 Intensity of Competitive Rivalry
5 MARKET SIZE AND GROWTH FORECASTS (VALUE)
- 5.1 By Deployment
- 5.1.1 Data Center
- 5.1.2 Edge
- 5.2 By Workload
- 5.2.1 AI Training
- 5.2.2 AI Inference
- 5.2.3 HPC
- 5.2.4 Visualization
- 5.3 By Configuration
- 5.3.1 Single GPU
- 5.3.2 Multi-GPU (2-4)
- 5.4 By Form Factor
- 5.4.1 Rack
- 5.4.2 Blade
- 5.4.3 Modular
- 5.5 By GPU Integration
- 5.5.1 PCIe-based
- 5.5.2 SXM / NVLink-based
- 5.5.3 OAM-based
- 5.6 By End-User
- 5.6.1 Cloud Service Providers (Hyperscalers)
- 5.6.2 Enterprise
- 5.6.3 Government and Research Institutions
- 5.6.4 Telecom / Edge Operators
- 5.7 By Geography
- 5.7.1 North America
- 5.7.1.1 United States
- 5.7.1.2 Canada
- 5.7.1.3 Mexico
- 5.7.2 Europe
- 5.7.2.1 United Kingdom
- 5.7.2.2 Germany
- 5.7.2.3 France
- 5.7.2.4 Rest of Europe
- 5.7.3 Asia-Pacific
- 5.7.3.1 China
- 5.7.3.2 Japan
- 5.7.3.3 India
- 5.7.3.4 South Korea
- 5.7.3.5 Rest of Asia-Pacific
- 5.7.4 South America
- 5.7.5 Middle East and Africa
- 5.7.1 North America
6 COMPETITIVE LANDSCAPE
- 6.1 Market Concentration
- 6.2 Strategic Moves
- 6.3 Market Share Analysis
- 6.4 Company Profiles (includes Global Level Overview, Market Level Overview, Core Segments, Financials as available, Strategic Information, Market Rank/Share, Products and Services, Recent Developments)
- 6.4.1 Dell Technologies Inc.
- 6.4.2 Hewlett Packard Enterprise Company
- 6.4.3 Lenovo Group Limited
- 6.4.4 Super Micro Computer Inc.
- 6.4.5 Inspur Group Co. Ltd.
- 6.4.6 Huawei Technologies Co. Ltd.
- 6.4.7 GIGABYTE Technology Co. Ltd.
- 6.4.8 ASUSTeK Computer Inc.
- 6.4.9 NVIDIA Corporation
- 6.4.10 Advanced Micro Devices Inc.
- 6.4.11 International Business Machines Corporation
- 6.4.12 Fujitsu Limited
- 6.4.13 Atos SE
- 6.4.14 Penguin Computing Inc.
- 6.4.15 TYAN Computer Corporation
- 6.4.16 H3C Technologies Co. Ltd.
- 6.4.17 BOXX Technologies LLC
- 6.4.18 Lambda Labs Inc.
- 6.4.19 NEC Corporation
- 6.4.20 Sugon Information Industry Co. Ltd.
7 MARKET OPPORTUNITIES AND FUTURE OUTLOOK
- 7.1 White-Space and Unmet-Need Assessment
 2026-2030年全球伺服器市場
 高可用性伺服器市場:按組件、架構、可用性等級、部署類型和最終用戶產業分類-2026年至2032年全球市場預測
 全球GPU伺服器市場(至2040年):產業趨勢與預測
 2026年全球伺服器市場報告2026年全球網路伺服器市場報告
 快取伺服器市場:按部署模式、快取類型、應用程式和區域分類
 人工智慧伺服器市場報告:趨勢、預測和競爭分析(至2035年)
 伺服器市場規模、佔有率和成長率;全球產業分析;按類型、應用和地區進行分析;以及未來預測(2026-2034 年)。
 伺服器市場分析及預測(至2035年):按類型、產品、服務、技術、組件、應用、形式、部署方式及最終用戶分類2026年全球儲存與伺服器支援服務市場報告